
ABSTRACT
Devils Lake, a terminal lake in eastern North Dakota, rose more than 9 m between 1992 and 2013, producing a 286% increase in lake area, and causing more than US$1 billion in direct damages. An annual volumetric lake water budget is developed from monthly hydroclimatological variables for the period 1951–2010 to investigate the rapid lake expansion. The lake is an amplifier terminal lake in which long-term climatic changes are amplified by positive feedback mechanisms, causing the lake to transition from a precipitation-dominated to a runoff-dominated water budget. Factors specific to the Devils Lake Basin further amplify this positive feedback relationship. These include principles of fill–spill hydrology that operate between individual sub-basins within the closed basin, and between the innumerable wetland complexes within each sub-basin. These factors create a pronounced non-stationary precipitation–runoff relationship in the basin during both long-term wetting and drying phases.
Editor A. Castellarin Associate editor H. Lins
1 Introduction
A large portion of the surface of Earth drains to inland lowland depressions that form terminal lakes. These closed basin lakes are normally saline and are often referred to as inland saline (salt) lakes. The total volume of water contained within saline lakes is comparable to that of freshwater lakes, and they form an important global water resource (Williams Citation1996, Citation2002).
Terminal lakes are dynamic hydrological systems, and their record of historical lake level fluctuations is considered a sensitive indicator of climate change (Mason et al. Citation1994). Such lakes can experience large and rapid changes in lake level, lake area, and lake volume due to the integrated effects of multiple climatic forcings (Szesztay Citation1974, Mason et al. Citation1994). Lake level fluctuations are driven by short-term and long-term variations in climate, and also by lake bathymetry such that the lake area–lake volume relationship of a saline lake can have preferred states in lake level (Street Citation1980, Mohammed and Tarboton Citation2011, Haghighi et al. Citation2016). Terminal lake level fluctuation is also extremely sensitive to human modification of basin hydrology, including human abstraction or augmentation of surface or groundwater inflow, diversion of tributaries, and alteration of basin land use/land cover (Williams Citation1996, Citation2002, Coe and Foley Citation2001, Micklin Citation2007).
Devils Lake is a terminal saline lake in the Devils Lake closed basin in eastern North Dakota (). The closed basin has an area of 9868 km2, of which 8599 km2 drains to Devils Lake, and 1269 km2 drains to Stump Lake, an adjacent saline lake to the east. The rise in lake level, and increase in lake area and lake volume of Devils Lake has been large and sudden since 1993 (). From 30 September 1992 to 30 September 2013 the lake level (LL, m) rose from 433.62 to 442.75 m (ΔLL = 9.13 m), lake area (LA, km2) expanded from 179.9 to 694.6 km2 (ΔLA = 286%), and lake volume (LV, km3) increased from 0.704 to 4.003 km3 (ΔLV = 469%) (). Devils Lake began spilling into Stump Lake in 1999, and the two lakes now form a single lake system. At a lake level of 444.40 m Devils Lake spills naturally through the Tolna Coulee into the Sheyenne River, and becomes part of the Red River of the North drainage basin.
Figure 1. Location of Devils Lake Basin, North Dakota (USA). Lake extent shown is approx. 1999. Large, lake open water surfaces are shown in black; small, wetland open water surfaces are shown in grey. Source: Sethre et al. (Citation2005).
Figure 2. Lake volume (LV, km3) time series for Devils Lake; lake volumes are shown to 31 January 2014. Source: USGS (Citation2013, Citation2014).
The lake has experienced catastrophic flooding over the past two decades (Larson Citation2012). The lake flooding that resulted required the raising and extension of levees to protect the City of Devils Lake, the raising of roads and bridges to preserve critical infrastructure, the destruction or relocation of more than 500 structures, and the inundation of more than 60 000 hectares of prime agricultural farmland (Zheng et al. Citation2014). Direct federal and state payments for flood damages have exceeded US$1 billion, although the total direct/indirect and tangible/intangible flood losses are certainly much higher (Smith and Katz Citation2013).
The abrupt and dramatic change in the hydrological regime at Devils Lake has not been fully explained. Basic hydrological investigations by Ryan and Wiche (Citation1988), Wiche (Citation1992), Wiche and Pusc (Citation1994), and Vecchia (Citation2008) provide an overview of the lake hydrology, while Hoerling et al. (Citation2010) present a preliminary investigation of the climatological basis of the recent lake rise. Todhunter and Knish (Citation2014) examined the relationship between the frequency of weather types and lake volume changes in the period 1965–2010, and found statistically significant changes in the frequency of selected weather types over time that indicated a trend toward increased advection of more humid weather types consistent with the historical rise in lake level. Their results and those of Hoerling et al. (Citation2010) support a climatic explanation for the historical lake rise at Devils Lake, but the results are not as strong nor as profound as might have been anticipated given the unprecedented rate of lake rise.
The purpose of this study is to investigate the hydrological basis of the sudden rise in Devils Lake. The first objective is to construct an annual volumetric water budget for the lake for water years 1951–2010 that considers both hydroclimatic variability and the effects of lake bathymetry. The second objective is to quantify the relationship between precipitation input to the basin and runoff inflow to the lake for the same study period.
2 Background
2.1 Study area
Devils Lake Basin lies within the Drift Prairie physiographic region which was traversed by a continental ice sheet during the last glaciation (Bluemle and Clayton Citation1984). Devils Lake includes a series of separate bays arranged in a linear sequence, separated from one another by a swale of higher elevation, and underlain by the Spiritwood Aquifer. The bays were formed by glacial thrusting of subglacial materials caused by elevated pore water pressures beneath the advancing ice sheet (Bluemle and Clayton Citation1984).
The closed basin includes a series of sub-basins, each drained by a major coulee that flows south and empties into a small lake (Ryan and Wiche Citation1988). These sub-basin lakes form a natural chain of lakes; each lake is located within a glacial depression, separated from each of the adjacent lakes in the chain by a swale with a unique spill elevation. Runoff from one sub-basin and lake does not directly contribute to the next lower sub-basin until the swale elevation separating the two sub-basins is reached and the lake can spill into the lower lake in the chain. Runoff along the chain of lakes proceeds in an east to west direction, and enters into northwest Devils Lake through Big Coulee. Prior to 1979, all runoff produced within the chain of lakes moved east to west through Big Coulee and into Devils Lake. In 1979 a levee was constructed along the natural outlet from Dry Lake, and Channel A was constructed connecting Dry Lake to Sixmile Bay on Devils Lake. Detailed maps of all channels, sub-basins, and the chain of lakes are available in Wiche and Pusc (Citation1994) and from the North Dakota State Water Commission.Footnote1
Surface runoff now enters Devils Lake through three sources: the eastern sub-basins that enter Devils Lake through Channel A, the western sub-basins that enter Devils Lake through Big Coulee, and a limited amount of local runoff from areas adjacent to Devils Lake. The upper basin lands consist of clay-rich surficial deposits underlain by Cretaceous shale; both possess very low permeability, and groundwater flow rates are extremely small (Wiche and Pusc Citation1994).
A great number of topographically closed depressions of variable size and depth were left by the continental ice sheet in the prairie landscape (Zhang et al. Citation2009, Shaw et al. Citation2013). Water storage in these prairie potholes is normally highest in the spring following the melt of the winter snow cover (Hayashi et al. Citation2016). A large portion of the upper basin drains internally to these pothole depressions, which frequently do not fill to a high enough level to spill to adjacent lower level pothole depressions. Surface water drainage between adjacent depressions is thus normally disconnected. The region lacks a well-defined surface drainage system, and the fraction of the area contributing to the surface stream network varies on a seasonal and inter-annual basis. The volume of water stored within prairie potholes varies dynamically across time, which results in great temporal variation in the number, average depth, and permanence of prairie potholes in the landscape. Pothole abundance, depth, and permanence are greatest in the early spring and during deluge periods, and decrease through summer and during drought periods (Zhang et al. Citation2009). Regional runoff totals are primarily driven by snowmelt and rain-on-snow processes (Berghuijs et al. Citation2016).
This complex natural hydrological setting has been extensively modified by human action over time. Extensive historical land cover change from native prairie grasses to cultivated crops has occurred, which would have resulted in decreased surface infiltration and increased surface runoff (Van Der Kamp et al. Citation2003). The region has experienced moderate land cover change between 1973 and 2000 (Auch et al. Citation2011, Drummond et al. Citation2012), including extensive wetland drainage (Johnson Citation2013).
2.2 Late Holocene and historical lake level fluctuations
Geological field investigations show that within the past 4000 years Devils Lake has gone completely dry four times, and spilled over to the Red River of the North three times (Bluemle et al. Citation1999). The natural condition for the lake is to be rising toward overflow to the neighbouring Stump Lake or Sheyenne River, or falling toward desiccation as a dry lake bed (Bluemle et al. Citation1999). Widely fluctuating lake levels are the normal condition for the lake, while long periods of stable lake levels are uncommon. Multiple paleolimnological studies of Holocene climate variability from northern Great Plains saline lakes show a similar pattern of lake level instability (Laird et al. Citation2003, Shapley et al. Citation2005, Grimm et al. Citation2011). These studies reveal a coherent regional pattern during the late Holocene of large oscillations between longer periods of high salinity–dry conditions, and shorter periods of low salinity–wet conditions. The transitions between these two modes appear to be relatively rapid, suggesting large and abrupt changes in the long-term hydroclimatic drivers controlling surface moisture availability, and rapid response of the lake system to such changing inputs (Laird et al. Citation2003).
2.3 Hydroclimate modes
Studies of the climatological basis of the historical rise in lake level at Devils Lake identified 1980 as one such transition point between drier and wetter hydroclimatic modes (Vecchia Citation2008, Hoerling et al. Citation2010, Todhunter and Fietzek-DeVries Citation2016). These low-frequency variations in regional hydrology must be related to persistent, large-scale, low-frequency circulation anomalies (Hirschboeck Citation1987), but the precise mix and phase of climate indices driving the two modes has yet to be identified.
The two hydroclimatic modes are associated with distinctive hydrological responses, producing what has been referred to as a drought to deluge cycle (Winter and Rosenberry Citation1998, Todhunter and Rundquist Citation2004, Zhang et al. Citation2009). Todhunter (Citation2016) developed a hydroclimatic profile of the two climate modes that included: climate variables (precipitation, mm; air temperature, °C), lake hydrology variables (lake evaporation, mm; net lake evaporation, mm), closed lake variables (inflow factor, %; climate parameter, fraction), selected climatic water balance variables (aridity index, fraction; precipitation minus potential evapotranspiration, mm; potential evapotranspiration minus actual evapotranspiration, mm; mean annual soil moisture, mm; dryness index, fraction; moisture index, fraction), and hydrology variables (surface inflow, km3; runoff ratio, %). Mode 1 was a cooler and drier mode, while Mode 2 was a warmer and wetter mode. Mean annual precipitation onto the lake increased from 466 to 579 mm from Mode 1 to Mode 2 (113 mm or 24% increase). This modest but sustained increase in the primary hydrological driver was amplified into much larger changes in regional hydrology between the two modes. Mean annual surface inflow to the lake increase from 0.041 to 0.198 km3 (383% increase) and mean annual runoff ratio increased from 1.08 to 4.12% (282% increase) from Mode 1 to Mode 2.
2.4 Regional hydrology
Devils Lake has experienced a precipitous increase in lake volume since 1993 (). This increase would appear to require additional causation than the transition from a drier and cooler hydroclimate mode to a wetter and warmer hydroclimate mode, and the basin’s location along a sharp hydrotone gradient (Todhunter Citation2016). In the absence of human drivers of landscape change, the relationship between precipitation input and streamflow output in most environments is assumed to be linear and stationary (Gupta et al. Citation2015).
There are three reasons to question this assumption for the Devils Lake Basin. First, even in basins where the annual precipitation–runoff relationship varies linearly across the normal range of precipitation variations, a nonlinear relationship may occur with extreme high and low precipitation variations due to the effect of basin hydrological memory, and the manner by which basin antecedent wetness conditions control the partitioning of climatic input to hydrological output (Risbey and Entekhabi Citation1996). Fundamental changes in internal basin dynamics during multiyear dry periods can impact the annual precipitation–runoff relationship (Saft et al. Citation2016a). The climate mode transition that occurred in 1980 makes such a non-stationary relationship probable (Todhunter and Fietzek-DeVries Citation2016).
Second, principles of fill–spill hydrology operate within the multiple wetland complexes within each sub-basin (Spence and Woo Citation2003). These principles have been studied for wetlands in the Canadian Prairie Pothole Region, and must certainly hold for the North Dakota Prairie Pothole Region (Spence Citation2007, Shook and Pomeroy Citation2011, Ehsanzadeh et al. Citation2012, Shaw et al. Citation2012, Citation2013, Dumanski et al. Citation2015, Shook et al. Citation2015). Snowmelt is the dominant source of runoff, and the transformations of snowmelt to runoff, and runoff to streamflow are nonlinear (Shook et al. Citation2015). Local depressions within a sub-basin do not contribute runoff to that sub-basin’s lake until its spill elevation is reached, and the wetland complex is hydrologically connected to its lake. Sub-basin contributing area is spatially and temporally dynamic, with the contributing area of each sub-basin expanding and contracting based upon the wetland storage levels and wetland connectivity experienced across the multitude of sub-basin wetland complexes.
Third, the sub-basins in the upper Devils Lake basin follow similar principles of fill–spill hydrology (Ryan and Wiche Citation1988). Each sub-basin drains to the next lowest sub-basin only when its lake level exceeds the elevation of the topographic swale separating the two adjacent lakes and the two adjacent sub-basins become hydrologically connected. The entire upper basin contributes runoff into Devils Lake only when every lake in the chain is above its spill elevation and flowing over its swale to the next lowest lake in the chain. If any lake along the chain is below spill elevation its sub-basin area, and that of all sub-basins above it in the chain, is not contributing runoff to Devils Lake (Ryan and Wiche Citation1988). The entire upper basin is hydrologically connected to Devils Lake only when multiple thresholds of lake level are exceeded. Thus, the area contributing surface inflow to the lake (Ri) is dynamic through time, expanding during wet phases, and contracting during dry phases, and producing a non-stationary contributing area to Devils Lake. It is hypothesised that all three effects contribute to the non-stationary runoff regime apparent in the hydrology of Devils Lake (Saft et al. Citation2015, Shook et al. Citation2015).
3 Data and methods
3.1 Monthly lake water budget data
Monthly water budget data for Devils Lake were provided by the US Geological Survey (USGS) North Dakota Water Science Center (A. Vecchia, personal communication, 14 October 2011). These included monthly totals of lake precipitation (PL, mm), lake evaporation (EL, mm) and inflow (Ri, km3) for January 1950 to December 2010. Net lake evaporation (EL − PL, mm) was determined as a secondary variable from the primary data. These data are considered the best available estimate of the lake hydrology, and served as the basis for a lake level frequency analysis for Devils Lake (Wiche and Vecchia Citation1996), and two versions of a stochastic simulation model used to evaluate the impact of pumping from proposed outlets upon future lake levels (Vecchia Citation2002, Citation2008). The total inflow term (Ri) includes the sum of inflow from the USGS streamgauges at Big Coulee and Channel A, and local ungauged inflow from the peripheral area of Devils Lake. Full details concerning the development of the monthly PL, EL, and Ri time series are given in Wiche and Vecchia (Citation1996) and Vecchia (Citation2002, Citation2008). A standard water year running from 1 October to 30 September is examined to capture winter snow accumulation, spring snowmelt production, and summer thunderstorm precipitation within a single year.
3.2 Lake water budget
For a large lake with high lake volume inertia it is appropriate to analyse the lake water budget over an annual time step. The change in lake volume (ΔLV) for an annual time step is given by the water balance equation for a terminal lake:
ΔLV = Ri + PLLA + Gi – ELLA – Go (1)
where Ri is surface runoff into the lake (km3), PL is direct precipitation onto the lake (mm), LA is lake area (km2), EL is evaporation from the lake (mm), and Gi and Go are groundwater inflow and outflow from the lake (Mason et al. Citation1994). Shallow groundwater inflow from glacial till deposits and deep groundwater contributions to the lake are estimated to be only 0.0037 km3 year−1, and do not have an important effect upon annual lake fluctuations (Wiche and Pusc Citation1994). In the summer of 2005 construction began on a series of outlets to pump and remove water from the Devils Lake system to mitigate flood damages (North Dakota State Water Commission Citation2014). When operative, the two outlets have a pumping capacity of 17.0 m3 s−1. The last year of minimal pumping volume was 2010, which marks the ending date of the analysis (W. Schuh, personal communication, North Dakota State Water Commission, 22 June 2015).
By assuming that net groundwater flow (Gi − Go) is negligible and can be dropped from the analysis (Wiche and Pusc Citation1994), and ending the analysis in 2010 when human abstraction by pumping became an important water balance term, Equation (1) can be simplified:
ΔLV = Ri + P – E (2)
where ΔLV is the change in lake volume (km3), and surface inflow to the lake (Ri) is the water year total of the monthly values provided by the USGS. Lake precipitation (P, km3) and lake evaporation (E, km3) are discretized annual totals obtained by multiplying the water year total precipitation on the lake (PL, mm) and evaporation from the lake (EL, mm) by the lake area (LA, km2) on 30 September (Mohammed and Tarboton Citation2012).
3.3 Historical lake level and lake volume time series
Historical observations of lake level for Devils Lake were obtained from USGS Water Data for the Nation (USGS (United States Geological Survey) Citation2013). This dataset is a composite of infrequent 19th century survey elevations, annual observations to 1930, discontinuous daily observations to 1965, and daily observations to the present.
Advances in satellite remote sensing have led to recent improvements in our ability to measure lake level and lake area, and thus to estimate lake volume variations (Gao Citation2015). The complete lake hypsometry defining the relationships between lake level, lake area, and lake volume is normally not known for closed lakes, but is available for Devils Lake. Tables of LL–LA and LL–LV relationships for lake levels in the ranges 426.7–445.6 m (1400.0–1462.0 feet) were obtained from the USGS (Citation2014), which allowed for the creation of a LV time series from the historical LL series.
4 Results
4.1 Annual volumetric lake water budget totals
Direct precipitation onto the lake (PL), evaporation from the lake (EL), and lake net evaporation (EL – PL), in units of depth (mm), are the standard measurements available for examining the hydrology of terminal lakes (Gao Citation2015). Surface runoff into the lake (Ri), is usually measured as a flow rate (m3 s−1) but is easily converted to an annual surface runoff volume (km3). A plot of the annual totals for PL (mm), EL (mm), and EL − PL (mm) for water years 1951–2010 is available in Todhunter (Citation2016). gives the mean (X), standard deviation (SD) and coefficient of variation (CV) for each variable for the 60-year study period.
Table 1. Summary statistics for annual water budget variables for standard lake measurements (mm) at Devils Lake. X: mean; SD: standard deviation; CV: coefficient of variation. Source: USGS.
Annual precipitation onto the lake surface (PL) averages 523 mm, and has a coefficient of variation (CV) of 21% (). Annual lake evaporation (EL) averages 763 mm, and is much less variable, with a CV of only 8% (). The lake freezes over during the cold season, so lake evaporation normally only occurs between April and November. The maximum lake depth is currently about 15.0 m, with an average lake depth of about 5.8 m. The shallow lake depth, large wind fetch, and active regional wind regime produce a well-mixed lake with a single thermal layer that experiences minimal lake heat storage, and a maximum average monthly lake evaporation of 153 mm occurring in August.
Lake net evaporation (EL − PL) is the only natural source of water loss unless the lake level exceeds the ordinary high water mark of 444.4 m. Average lake net evaporation is 241 mm (), with annual totals ranging between −73.4 and 586.7 mm; negative values occurred in only three of the 60 years. The CV for lake net evaporation is 59%, the second highest CV for the four lake water budget variables (). A weak but statistically significant inverse linear relationship occurs between PL and EL (, P = 0.031, SAS for Windows v.9.4), which leads to high inter-annual variability in lake net evaporation (). Evaporation from shallow freshwater lakes is controlled by the lake energy budget (Schertzer Citation1997, Lenters et al. Citation2005). Net radiation is the dominant driver of inter-annual variation of lake evaporation, and net radiation and lake evaporation have a strong positive relationship in this region (Lenters et al. Citation2005). Moderate inverse relationships are found between lake evaporation and the lake–air temperature difference and Bowen ratio (Lenters et al. Citation2005). Years with increased annual precipitation are associated with higher levels of cloud cover, decreased solar radiation transmission, reduced surface net radiation, and reduced lake evaporation (Lenters et al. Citation2005).
Figure 3. Plot of annual lake evaporation (EL, mm) against annual lake precipitation (PL, mm) for Devils Lake for water years 1951–2010.
Annual totals for the lake water budget variables determined from the volumetric analysis for water years 1951–2010 are shown in and summarized in . These are the annual totals for PL, EL, and EL − PL (mm) shown in Todhunter (Citation2016), but here converted to volumetric totals for P, E, and E − P (km3). Direct precipitation onto the lake (P, km3) exceeded the surface inflow to the lake (Ri, km3) in 44 of the 60 years; the volume of surface inflow to the lake was greatest for the remaining 16 years. Total water input to Devils Lake over the 60-year period was 15.73 km3, of which 8.33 km3 (53.0%) was by direct precipitation on the lake, 7.18 km3 (45.7%) was by surface inflow, and 0.22 km3 (1.3%) by groundwater inflow. Total water output from Devils Lake was 11.56 km3 over the 60-year period, of which lake evaporation contributed 11.47 km3 (99.2%). Pumping from the lake outlets totalled only 0.09 km3 (0.8%) and was inconsequential through 2010, but has become an important output variable since 2010. Pumping removed 0.063 km3 of water in 2010, which is comparable to the average annual net evaporation (E − P) of 0.054 km3 (). Pumping can now potentially double the average lake net evaporation, and will have an important role in the future lake water budget.
Table 2. Summary statistics for annual volumetric water budget variables (km3) at Devils Lake. Source: USGS.
Figure 4. Annual volumetric water budget totals (km3) for Devils Lake for water years 1951–2010.
Surface inflow to the lake (Ri) is the most variable lake water budget component, and is the lake input most responsible for the dramatic rise in lake level at Devils Lake. Mean annual Ri is 0.120 km3 (), but annual totals range between 0.0 and 0.720 km3, producing a CV of 141%. Surface inflow to the lake is dominated by spring snowmelt production, with peak monthly Ri totals occurring in April. Winter precipitation (Dec–Feb) is only 9% of annual precipitation, but spring surface inflow (Mar–May) is 69% of annual surface inflow to the lake. Summer runoff (Jun–Aug) to the lake is only 24% of annual Ri although summer precipitation is 46% of annual PL. A preliminary examination of annual Ri in reveals three distinct clusters. First, a period of minimal Ri from the beginning of the period of analysis through the late 1960s; second, a period of moderate Ri beginning in the late 1960s and lasting through the early 1990s; finally, a period of much greater Ri beginning in the early 1990s and continuing through the end of the period of analysis.
The net change in lake volume (ΔLV) obtained from the discretized water budget shown in is 3.42 km3, while the measured change in lake volume between 30 September 1950 and 30 September 2010 is 4.17 km3, for a closure error of −0.75 km3 (−18%). This small closure error is most likely attributable to the assumptions and uncertainties associated with development of the lake water budget database (Vecchia Citation2008), and the use of an annual time step in discretizing the volumetric lake water budget.
Several additional variables used to characterize terminal lakes are given in (Szesztay Citation1974, Street Citation1980, Mason et al. Citation1994). These include the inflow factor (IF, %):
Table 3. Summary statistics for selected annual volumetric water budget totals for Devils Lake.
A precipitation factor (PF, %) can also be determined as a complementary variable:
Neglecting the minimal groundwater input, surface inflow contributes 30.2% of lake volume input for the study period, with precipitation on the lake providing the remaining 69.8% ().
4.2 Ratio of lake area to closed basin area
The area of a closed basin (A, km2) is the sum of the lake area (LA, km2) and the basin area (BA, km2). shows lake area as a percentage of closed basin area for 1901–2014. The percentage averages 2.8% over the study period, but varies over 1.1 < LA/A < 9.0%. This variable has an important control over the relative contribution of PL and Ri to lake input, and has been found to range between less than 1.0% and nearly 50% for closed basins throughout the world (ILEC Citation2005). Even after the spectacular rise in lake level the percentage is still less than 9% for the Devils Lake basin, placing it toward the lower end of the distribution among global closed basins.
Figure 5. Lake area (LA, km2) of Devils Lake as a percentage of the Devils Lake closed basin area (A, km2) for 15 June 1901 to 31 January 2014.
4.3 Precipitation–runoff relationship
The precipitation–runoff relationship is a statistical model that shows drainage basin runoff response across a range of years of variable wetness (Saft et al. Citation2015). It aggregates drainage basin runoff response to precipitation input at an annual time step, and is a simple yet effective characterization of drainage basin precipitation–runoff processes (Saft et al. Citation2015). If human influences upon runoff are minor and precipitation is the main driver of runoff variations, the plot of annual precipitation against annual runoff will assume a linear pattern in most hydrological environments (Gupta et al. Citation2015). For cold regions, however, Dumanski et al. (Citation2015) and Shook and Pomeroy (Citation2012) have shown that changes in precipitation phase, and the duration of precipitation events can also influence hydrological response even with no change in annual precipitation amount. In a water-limiting environment a nonlinear relationship may arise due to human influences upon drainage basin processes, or due to climatic drivers other than annual precipitation totals (Saft et al. Citation2015). The scatter plot of annual lake precipitation (PL, mm) versus annual surface inflow (Ri, km3) for the study period reveals no coherent aggregate linear or nonlinear relationship (). For example, for an annual PL total of 600 mm, annual runoff (Ri) ranges from 0.0 km3 to more than 0.7 km3.
Figure 6. The annual precipitation–runoff relationship for Devils Lake for water years 1951–2010.
The runoff ratio (RR, %) is defined as the volume of runoff to the lake (Ri) divided by the volume of precipitation falling on the sub-basin (PB, mm). It is determined by:.
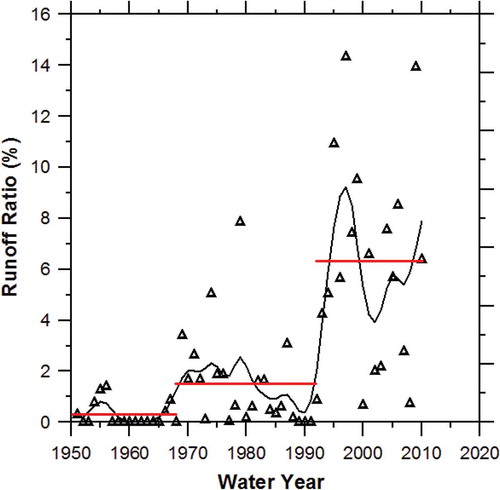
where PB is assumed equal to PL. The time series of RR for the 60-year study period is shown in . The average RR value is 2.6% (), but varies for individual years between 0.0 and 14.3%. Only one year had no runoff (RR = 0.0), although many years experienced minimal runoff with RR values close to zero. The inter-annual variation in RR is extreme, with a CV of 136%, and RR ranging by more than three orders of magnitude. A nine-term binomial filter has been applied to the annual RR time series in to help identify long-term patterns of variation (Richard Heim, Jr., personal communication, Meteorologist, NOAA National Centers for Environmental Information, 5 March 2018).
Figure 7. Runoff ratio (%) for Devils Lake basin for water years 1951–2010. Individual water years are shown with open triangles; a nine-term binomial filter (solid curve) has been applied to the time series to clarify temporal patterns. Horizontal (red) lines show the average values for Phases 1–3.
The use of double-mass curves to check the consistency of the relationship between hydrological variables is a standard method in hydrology (Searcy and Hardison Citation1960). In cumulative surface runoff to the lake (Ri, km3) is plotted against cumulative precipitation on the lake (PL, mm) for water years 1951–2010. If the relationship between the two variables is a fixed ratio the two variables should plot as a linear trend, with scatter about the line due to short-term basin memory effects. A break in the plotted double-mass curve would indicate a change in the relationship between precipitation input and runoff generation over time (Searcy and Hardison Citation1960). In , three distinct phases occur in the double-mass curve: (a) Phase 1: 1951–1968; (b) Phase 2: 1969–1992; and (c) Phase 3: 1993–2010. indicates a non-stationary precipitation–runoff relationship during the study period, with regime transitions occurring in 1969 and 1993.
Figure 8. Double mass curve of cumulative lake precipitation (PL, mm) against cumulative runoff (Ri, km3) for Devils Lake for water years 1951–2010. Critical thresholds occur in 1969 and 1993.
The sub-totals for each set of variables given in , , and 3 were determined for the three periods of precipitation–runoff relationship identified in . The annual water budget variables for standard lake measurements are summarized in : PL shows a steady increase from Phase 1 to Phase 3. The coefficient of variation for PL is comparable for Phases 1 and 2, but much smaller for Phase 3; EL shows a moderate increase from Phase 1 to Phase 2, and then a small decline for Phase 3; and EL − PL has a small increase from Phase 1 to Phase 2, but then a more substantial decline for Phase 3.
The annual water budget variables for the volumetric analysis are summarized in . All four variables increase from Phase 1 to Phase 2, and then again from Phase 2 to Phase 3: P increases by 89% and then 168% from Phase 1 to Phase 3; E increases by 85% and then 126% from Phase 1 to Phase 3; and E − P also increases progressively from Phase 1 to Phase 3, but by smaller percentages of 80 and 44%, respectively. The largest percentage increase occurs for Ri, which shows a 417% increase from Phase 1 to Phase 2, and a 392% increase from Phase 2 to Phase 3. The CVs for P, E, and E − P all increase from Phase 1 to Phase 3, while the CV for Ri decreases continuously from Phase 1 to Phase 3.
Key closed lake variables for the three phases defined by are shown in . Average lake area (LA) as a percentage of closed basin area (A) increased from 1.3% in Phase 1 to 5.2% in Phase 3, which contributed to the increase in the volume of direct precipitation onto the lake (P, ). Although the magnitude of P increased from Phase 1 to Phase 3, the relative contribution of P to the lake water budget declined, with the average precipitation factor (PF, %) decreasing from 87.7 to 51.9% from Phase 1 to Phase 3 (). The explosive growth in Ri as a contributor to the lake water budget is shown by the increase in the inflow factor from an average of 12.3% in Phase 1 to an average of 48.1% in Phase 3. By the end of the study period, Ri was the largest contributor to the lake volumetric water budget. Average runoff ratios (RR, %) for the three phases were 0.3, 1.5, and 6.4%, respectively (, horizontal red lines), for a nearly 20-fold increase from Phase 1 to Phase 3.
5 Discussion
The large fluctuations in reconstructed lake level during the late Holocene (Bluemle et al. Citation1999), and observed lake level during the late 20th century (), are the result of special characteristics of the Devils Lake water balance. Devils Lake is an example of an amplifier terminal lake, a term first proposed by Street (Citation1980) following the general classification of lake water budgets presented by Szesztay (Citation1974). The water budgets of amplifier terminal lakes are dominated by Ri and E. Their lake levels exhibit a large-amplitude response to long-term climatic fluctuations because numerous positive feedbacks amplify or attenuate runoff generation from their contributing areas (Street Citation1980). Two additional factors are also operative in the Devils Lake Basin that create temporal lags in the lake system response to the hydroclimatic drivers, and affect the rate of amplification/attenuation to the forcings. These concern the location of the basin along a dry sub-humid/moist sub-humid hydroclimatic boundary, and the principles of fill−spill hydrology that regulate precipitation–runoff relationships at both the basin and sub-basin scales.
shows a conceptual model of the positive feedback relationships in an amplifier lake associated with a long-term increase in precipitation (+ΔPL). The same positive feedback relationships hold for a long-term decrease in precipitation (−ΔPL), except that all of the terms in the figure would change sign. Direct precipitation on the lake (PL) is the single greatest input to lake volume (LV), contributing 53% of the input to the lake over the period of record. Annual +ΔPL inputs, however, can only produce a small impact upon annual +ΔLV. Long-term climate change producing an increase in annual PL leads to an increase in LV for two reasons. First, the increase in PL contributes directly to an increase in lake precipitation (P, km3). For Devils Lake, average PL increased by 113 mm (24%) from climate Mode 1 to Mode 2 (Todhunter Citation2016). Second, as lake area (LA) expands it produces an additional linear increase in P due to the expanding lake area. The increase in LA/A from 1 to 9% over the period of record () creates a steadily increasing trend in the P time series (,) which is in marked contrast to the inter-annual variability in the PL time series shown in Todhunter (Citation2016). A long-term increase in PL, however, leads to an absolute increase in the contribution of P to LV, but a relative decrease in the contribution of P to LV. Average annual PL increases from 471 to 585 mm from Phase 1 to Phase 3 (), and average annual P increases from 0.054 to 0.274 km3 for the same period (). , however, shows a decrease in the precipitation factor of 87.7 to 51.9% from Phase 1 to Phase 3.
Figure 9. Conceptual model of the positive feedback relationship in an amplifier lake. The figure shows the positive feedback associated with a long-term increase in precipitation (+ΔPL). All of the signs change for the positive feedback associate with a long-term decrease in precipitation (–ΔPL). The units for all variables are depth (mm).
A long-term increase in PL also contributes to an increase in lake volume (+ΔLV) through its direct effect on lake evaporation (EL) and net lake evaporation (EL − PL). Mean annual air temperature warmed by an average of 0.63°C from climate Mode 1 to Mode 2 (Todhunter Citation2016), but lake evaporation remained mostly unchanged, increasing from 752 to 774 mm for the two climate modes, or from 736 to 750 mm from Phase 1 to Phase 3 (). Increasing cloud cover and atmospheric humidity are effective at attenuating most of the increased evaporative demand associated with atmospheric warming (Schertzer Citation1997, Lenters et al. Citation2005).
More importantly, net lake evaporation, which is the only natural source of lake volume loss except for those occasions when the lake overflows through the ordinary high water mark and the lake transitions from a closed lake to a flowing lake (Szesztay Citation1974), decreased as the long-term climate transitioned from a drier to a wetter mode. shows a decrease in EL − PL from 266 to 165 mm from Phase 1 to Phase 3. This reduces the ability of the lake to remove water, on a unit depth basis, from the lake by evaporation.
As the hydroclimate regime shifts from a drier to a wetter climate mode, Devils Lake transitions from a precipitation-dominated to a runoff-dominated water budget, or from a P-E to an IP-E lake water budget in the nomenclature of Szesztay (Citation1974) and Street (Citation1980). The slow, progressive, and cumulative effects of the prolonged wetter climate mode produce important changes in the water budget and runoff characteristics of the upper basin. The increasing trend in PL and decreasing trend in EL – PL have a direct positive impact upon ΔLV. These direct effects, however, are small in comparison to their indirect effects upon +ΔLV through surface inflow (Ri). Although the increase in PL from Mode 1 to Mode 2, from 466 to 579 mm, is substantial (+24%), it can only have a small direct effect upon +ΔLV. The continuation of the wet cycle has a large effect upon the moisture status of the upper basin that dynamically changes Ri. Average annual soil moisture (SM) is 57 mm for climate Mode 1 and 97 mm for climate Mode 2 (Todhunter Citation2016), while mean annual SM increases from 67 to 100 mm from Phase 1 to Phase 3.
During Phase 1 the runoff ratio (RR) averages only 0.3%, and the average precipitation factor (PF) is seven times greater than the average inflow factor (IF), even though the basin area is 99% of the closed basin area (). As climate Mode 2 becomes established, SM slowly begins to increase, leading to a slow but progressive increase in RR and Ri. Once Phase 3 becomes established, basin area is only 91% of the closed basin, but RR now averages 6.4%, for a 20-fold increase from Phase 1; Ri has increased from 0.012 to 0.305 km3 from Phase 1 to Phase 3 (), for a 25-fold increase; and PF and IF are of comparable magnitude during Phase 3 (). The establishment of the wetter climate regime causes both the absolute contribution (Ri, km3) and the relative contribution (PF, %) of surface inflow to the volumetric lake water budget to increase.
The volumetric lake water budget time series illustrates these effects and transitions (). During Phase 1 (1951–1968) Devils Lake exhibits a clear pattern of a precipitation-dominated amplifier terminal lake (P-E). Inflow factors are always less than 35%, both P and E are large relative to Ri, and E controls the lake water budget, since net lake evaporation allows only small annual fluctuations in LV (Szesztay Citation1974, Street Citation1980). Phase 3 (1993–2010) shows the pattern for an inflow-dominated amplifier terminal lake (IP-E). Inflow factors now range between 35 and 65%, and Ri is large relative to P and E. The lake basin now amplifies the effects of the climatic cycle fluctuations on the lake water budget leading to a new equilibrium hydrological state. Lake level and lake volume are highly unstable, rising quickly when high annual Ri overwhelms net lake evaporation, but declining slowly in years when low annual Ri allows net lake evaporation to remove water from the lake. Phase 2 (1969–1992) is a transitional period during which the direct effects of PL fluctuations on the lake water budget become less important, and the indirect effects of PL fluctuations on the lake water budget become dominant through their effects upon inflow. Results from Todhunter (Citation2016) show that there is about a 15-year lag between the establishment of the wetter PL mode and the initiation of the upward trend in LV due to the substantial hydrological inertia present in the closed lake system (Street Citation1980, Mason et al. Citation1994).
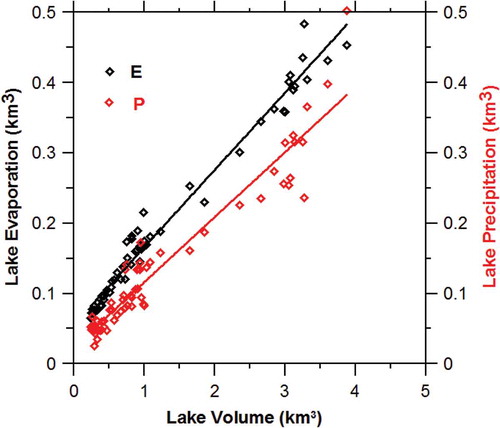
Equilibrium is restored to the positive feedback relationship through the relative changes in P and E shown in . Because EL is normally greater than PL, net lake evaporation is normally positive, producing an annual net loss in lake volume. As LA expands, the rate of growth of E exceeds the rate of growth of P due to the surface area dependence of both terms. shows that both P and E show large increases during Phase 3, but the continued increase in lake volume is dependent upon annual Ri being greater than annual E − P. The weak negative relationship between EL and PL () is overridden by the positive relationship between E − P and LV (), creating a negative feedback that works to restore equilibrium to the lake water budget.
Figure 10. Plot of lake evaporation (E, km3) and lake precipitation (P, km3) against lake volume (LV, km3) for Devils Lake for water years 1951–2010.
The precipitous rise in lake volume results from several probable causes (). First, the Devils Lake Basin lies along a hydrotone or a region of sharp hydroclimatical transition (Todhunter Citation2016). As the climate mode shifts from climate Mode 1 to Mode 2 the position of the moist–sub-humid/dry–sub-humid boundary shifts westward, producing changes in the regional moisture status that are small on an absolute basis, but much larger on a relative basis.
Second, basin antecedent wetness conditions play a critical role in precipitation–runoff partitioning. Most hydrological investigations assume stationarity in hydrological processes across the range of climatic variations (Saft et al. Citation2015). They also assume that the historical record of precipitation–runoff dynamics captures the full range of basin response (Saft et al. Citation2016b). Basins that exhibit a linear precipitation–runoff relationship for most years may exhibit a nonlinear relationship during extremes in the precipitation distribution (Risbey and Entekhabi Citation1996). Saft et al. (Citation2016a, Citation2016b)) show that prolonged drought of decadal-scale or longer causes a reduction in the normal precipitation–runoff relationship, and that such a reduction is most likely in drier, flatter, less forested basins such as characterize the Devils Lake Basin. The prolonged drought to deluge climate change experienced in the study area would likely produce a nonlinear increase in the precipitation–runoff partitioning.
Third, the fill–spill principles of hydrology experienced at the basin scale and among the innumerable wetland complexes within each sub-basin would produce nonlinear relationship precipitation–runoff relationships across all levels of precipitation. This has been demonstrated for watersheds within the glacial drift prairie region of Canada (Shook and Pomeroy Citation2011, Ehsanzadeh et al. Citation2012, Citation2016, Shaw et al. Citation2012, Dumanski et al. Citation2015, Shook et al. Citation2015). At the basin scale, the filling and spilling of the upper basin chain of lakes would lead to an increase in the hydrological connectivity of the sub-basins contributing inflow to Devils Lake, which would produce a pattern of step function increases in the effective contributing area to the lake system. At the sub-basin scale, the innumerable wetland complexes would also experience a filling and spilling pattern leading to an increase in hydrological connectivity, but the pattern of increase in effective contributing area would be much more continuous in nature due to the vast number of wetland complexes.
shows three phases in the precipitation–runoff relationship, with distinct thresholds occurring in 1969 and 1993. Phase 1 illustrates the precipitation–runoff relationship of climate Mode 1, the cooler and drier climate mode, marked by sub-basin lakes and wetland complexes with storage volumes below capacity and not spilling to lower elevation areas, minimal hydrological connectivity between the lakes and wetland complexes, and low basin-wide antecedent wetness conditions. Phase 3 illustrates the precipitation–runoff relationships of climate Mode 2, the warmer and wetter climate mode. Long-term establishment of this climate mode leads to increased basin-wide antecedent wetness conditions, increased surface runoff, increased sub-basin lake and wetland complex water storage, and increased hydrological connectivity at the basin and sub-basin scales. Phase 2 is a transitional period marked by a progressive increase in basin-wide antecedent wetness conditions, increased sub-basin lake water levels, increased maximum wetland complex water storage, and improving hydrological connections between individual wetland complexes and sub-basins.
Several topics for further investigation arise. First, the explanation provided for the rapid rise in lake level at Devils Lake was based upon a bulk or basin-wide analysis of hydrological processes. A study employing a physically-based, distributed hydrological model would confirm and elaborate upon the explanation offered in this paper (Pomeroy et al. Citation2007). Second, following Wiche and Pusc (Citation1994), it has been assumed that groundwater inflow was a negligible contributing factor to the lake rise. The Spiritwood Aquifer underlies the chain of lakes and bays that comprise Devils Lake, so this assumption may not be valid as the wet phase becomes fully established. Rising groundwater levels close to the lake could lead to both increasing groundwater inflow to the lake, and higher surface runoff coefficients in the adjacent area. Finally, Devils Lake acts as a low-pass filter on low-frequency climate variability (Mason et al. Citation1994). Climate variation is not random, but exhibits preferred time scales of residence within each transient state. Each closed basin lake, acting as a low-pass filter with specific internal system dynamics, will translate that low-frequency climate signature into a unique land surface hydrological response. Understanding this nonlinear behaviour is essential to providing meaningful assessments of hydrological response to simulations of future climate change.
6 Conclusions
The hydrology of Devils Lake exhibits features common to all amplifier terminal lakes, as well as features specific to its glacial formation. These factors combine to produce the large oscillations in lake level that characterize the late Holocene. During the drier drought phase the lake has a precipitation-dominated water budget. As the long-term climate transitions to the wetter deluge phase the lake takes on a runoff-dominated water budget, following a time lag due to basin memory effects. Fill–spill hydrology effects further accentuate the natural amplifications and dampenings of the positive feedback relationships, producing a non-stationary precipitation–runoff relationship in surface inflow to the lake.
These nonlinear precipitation–runoff relationships may explain the weak correlations obtained between measured streamflow variables and a range of standard climate indices (McCabe and Wolock Citation2014). The low-frequency variations in regional hydrology must be related to persistent, large-scale, low-frequency circulation anomalies, but their identification has remained elusive. Efforts to investigate the direct relationship between climate indices and precipitation (rain and/or snowfall) may be more productive than the more indirect relationship between climate indices and streamflow. The fill–spill hydrological principles and nonlinear precipitation–runoff relationships present in the northern glaciated plains also have important implications for the investigation of the impact of anthropogenic climate warming upon trends in regional hydrology.
Acknowledgements
I thank Rick Thalacker for his work in making . Aldo Vecchia, Jr. of the USGS North Dakota Water Science Center in Bismarck, ND, provided the monthly lake water budget data for Devils Lake. Bill Schuh of the North Dakota State Water Commission provided the discharge data for the outlets on Devils Lake. Two reviewers provided several comments that helped improve the final manuscript.
Disclosure statement
No potential conflict of interest was reported by the author.
Notes
1 http://www.swc.nd.gov/info_edu/reports_and_publications/ pdfs/wr_investigations/wr22_report.pdf.
References
- Auch, R.F., et al., 2011. Ecoregional differences in late-20th-century land-use and land-cover change in the U.S. northern Great Plains. Great Plains Research, 21 (2), 231–243.
- Berghuijs, W.R., et al., 2016. Dominant flood generating mechanisms across the United States. Geophysical Research Letters, 43, 4382–4390. doi:10.1002/2016GL068070
- Bluemle, J.P. and Clayton, L., 1984. Large-scale glacial thrusting and related processes in North Dakota. Boreas, 13 (3), 279–299. doi:10.1111/j.1502-3885.1984.tb01124.x
- Bluemle, J.P., Sabel, J.M., and Karlén, W., 1999. Rate and magnitude of past global climate changes. Environmental Geosciences, 6 (2), 63–75. doi:10.1046/j.1526-0984.1999.08036.x
- Coe, M.T. and Foley, J.A., 2001. Human and natural impacts on the water resources of the Lake Chad Basin. Journal of Geophysical Research D, 106 (D4), 3349–3356. doi:10.1029/2000JD900587
- Drummond, M.A., et al., 2012. Land change variability and human-environment dynamics in the United States Great Plains. Land Use Policy, 29 (3), 710–723. doi:10.1016/j.landusepol.2011.11.007
- Dumanski, S., Pomeroy, J.W., and Westbrook, C.J., 2015. Hydrological regime changes in a Canadian Prairie basin. Hydrological Processes, 29 (18), 3893–3904. doi:10.1002/hyp.v29.18
- Ehsanzadeh, E., et al., 2012. On the behaviour of dynamic contributing areas and flood frequency curves in North American Prairie watersheds. Journal of Hydrology, 414415, 2802–2813. doi:10.1016/j.jhydrol.2011.11.007
- Ehsanzadeh, E., Van Der Kamp, G., and Spence, C., 2016. On the changes in long-term streamflow regimes in the North American Prairies. Hydrological Sciences Journal, 61 (1), 64–78. doi:10.1080/02626667.2014.967249
- Gao, H., 2015. Satellite remote sensing of large lakes and reservoirs: from elevation and area to storage. WIREs Water, 2 (2), 147–157. doi:10.1002/wat2.1065
- Grimm, E.C., Donovan, J.J., and Brown, K.J., 2011. A high-resolution record of climate variability and landscape response from Kettle Lake, northern Great Plains, North America. Quaternary Science Reviews, 30 (1920), 2626–2650. doi:10.1016/j.quascirev.2011.05.015
- Gupta, S.C., et al., 2015. Climate and agricultural land use change impacts on streamflow in the upper midwestern United States. Water Resources Research, 51, 5301–5317. doi:10.1002/2015WR017323
- Haghighi, A.T., et al., 2016. Can lake sensitivity to desiccation be predicted from lake geometry? Journal of Hydrology, 539, 599–610. doi:10.1016/j.jhydrol.2016.05.064
- Hayashi, M., Van Der Kamp, G., and Rosenberry, D.O., 2016. Hydrology of prairie wetlands: understanding the integrated surface-water and groundwater processes. Wetlands, 36 (S2), 237–254. doi:10.1007/s13157-016-0797-9
- Hirschboeck, K., 1987. Catastrophic flooding and atmospheric circulation anomalies. In: L. Mayer and D. Nash, eds. Catastrophic Flooding. Boston: Allen and Unwin, 23–56.
- Hoerling, M., et al., 2010. Understanding and explaining hydro-climate variations at Devils Lake. Climate Assessment. Silver Spring, MD: National Oceanic and Atmospheric Administration.
- ILEC, 2005. Managing lakes and their basins for sustainable use: a report for lake basin managers and stakeholders. Kusatsu, Japan: International Lake Environment Committee Foundation.
- Johnson, C., 2013. Wetland losses due to row crop expansion in the Dakota Prairie Pothole Region. Wetlands, 33 (1), 175–182. doi:10.1007/s13157-012-0365-x
- Laird, K.R., et al. 2003. Lake sediments record large-scale shifts in moisture regimes across the northern prairies of North America during the past two millennia. Proceedings, National Academy of Sciences, 100 (5), 2483–2488. doi:10.1073/pnas.0530193100
- Larson, D., 2012. Runaway Devils Lake. American Scientist, 100 (1), 46–53.
- Lenters, J.D., Kratz, T.K., and Bowser, C.J., 2005. Effects of climate variability on lake evaporation: results from a long-term energy budget study of Sparkling Lake, northern Wisconsin (USA). Journal of Hydrology, 308 (14), 168–195. doi:10.1016/j.jhydrol.2004.10.028
- Mason, I.M., et al., 1994. The response of lake levels and areas to climatic change. Climatic Change, 27 (2), 161–197. doi:10.1007/BF01093590
- McCabe Jr., G.J. and Wolock, D.M., 2014. Spatial and temporal patterns in conterminous United States streamflow characteristics. Geophysical Research Letters, 41, 6889–6897. doi:10.1002/2014GL061980
- Micklin, P., 2007. The Aral Sea disaster. Annual Review of Earth and Planetary Science, 35, 47–72. doi:10.1146/annurev.earth.35.031306.140120
- Mohammed, I.N. and Tarboton, D.G., 2011. On the interaction between bathymetry and climate in the system dynamics and preferred levels of the Great Salt Lake. Water Resources Research, 47, W0252. doi:10.1029/2010WR009561
- Mohammed, I.N. and Tarboton, D.G., 2012. An examination of the sensitivity of the Great Salt Lake to changes in inputs. Water Resources Research, 48, W11511. doi:10.1029/2012WR011908
- North Dakota State Water Commission, 2014. Devils Lake Flood Facts [online]. Bismarck, ND. Available from: http://www.swc.nd.gov/4dlink9/4dcgi/GetContentPDF/PB-206/Fact%20Sheet.pdf [accessed 29 September 2015].
- Pomeroy, J.W., et al., 2007. The cold regions hydrological model: a platform for basing process representation and model structure on physical evidence. Hydrological Processes, 21 (19), 2650–2667. doi:10.1002/(ISSN)1099-1085
- Risbey, J.S. and Entekhabi, D., 1996. Observed Sacramento Basin streamflow response to precipitation and temperature changes and its relevance to climate impact studies. Journal of Hydrology, 184 (34), 209–223. doi:10.1016/0022-1694(95)02984-2
- Ryan, G.L. and Wiche, G.J., 1988. Hydrology of the Chain of Lakes tributary to Devils Lake and water-level simulations of Devils Lake, Northeastern North Dakota. U.S. Geological Survey Water Resources Investigations Report 88-4020, Denver: United States Geological Survey. doi:10.3168/jds.S0022-0302(88)79586-7
- Saft, M., et al., 2016a. Bias in streamflow projections due to climate-induced shifts in catchment response. Geophysical Research Letters, 43, 1574–1581. doi:10.1002/2015GL067326
- Saft, M., et al., 2016b. Predicting shifts in rainfall-runoff partitioning during multiyear drought: roles of dry period and catchment characteristics. Water Resources Research, 52, 9290–9305. doi:10.1002/2016WR019525
- Saft, M., et al., 2015. The influence of multiyear drought on the annual rainfall-runoff relationship: an Australian perspective. Water Resources Research, 51, 2444–2463. doi:10.1002/2014WR015348
- Schertzer, W.M., 1997. Freshwater Lakes. In: W.G. Bailey, T.R. Oke, and W.R. Rouse, eds. The Surface Climates of Canada. Montreal: McGill-Queen’s University Press, 124–148.
- Searcy, J.K. and Hardison, C.H., 1960. Double-mass curves. In: U.S. Geological Survey Water-Supply Paper 1541-B. Washington, DC: United States Government Printing Office.
- Sethre, P.R., Rundquist, B.C., and Todhunter, P.E., 2005. Remote detection of prairie pothole ponds in the Devils Lake basin of North Dakota. GIScience and Remote Sensing, 42 (4), 277–296. doi:10.2747/1548-1603.42.4.277
- Shapley, M.D., et al., 2005. Late-Holocene flooding and drought in the Northern Great Plains, USA, reconstructed from tree rings, lake sediments and ancient shorelines. The Holocene, 15 (1), 29–41. doi:10.1191/0959683605hl781rp
- Shaw, D.A., Pietroniro, A., and Mertz, L.W., 2013. Topographic analysis for the prairie pothole region of Western Canada. Hydrological Processes, 27 (22), 3105–3114.
- Shaw, D.A., et al., 2012. The fill-spill hydrology of prairie wetland complexes during drought and deluge. Hydrological Processes, 26 (20), 3147–3156. doi:10.1002/hyp.8390
- Shook, K., Pomeroy, J., and Van Der Kamp, G., 2015. The transformation of frequency distributions of winter precipitation to spring streamflow probabilities in cold regions; case studies from the Canadian Prairies. Journal of Hydrology, 521, 395–409. doi:10.1016/j.jhydrol.2014.12.014
- Shook, K.R. and Pomeroy, J.W., 2011. Memory effects of depressional storage in Northern Prairie hydrology. Hydrological Processes, 25 (25), 3890–3898. doi:10.1002/hyp.v25.25
- Shook, K.R. and Pomeroy, J.W., 2012. Changes in the hydrological character of rainfall on the Canadian prairies. Hydrological Processes, 26 (12), 1752–1766. doi:10.1002/hyp.9383
- Smith, A.B. and Katz, R.W., 2013. US billion-dollar weather and climate disasters: data sources, trends, accuracy and biases. Natural Hazards, 67 (2), 387–410. doi:10.1007/s11069-013-0566-5
- Spence, C., 2007. On the relation between dynamic storage and runoff: A discussion of thresholds, efficiency, and function. Water Resources Research, 43, W12416. doi:10.1029/2006WR005645
- Spence, C. and Woo, M.-K., 2003. Hydrology of subarctic Canadian shield: soil-filled valleys. Journal of Hydrology, 279 (14), 151–166. doi:10.1016/S0022-1694(03)00175-6
- Street, F.A., 1980. The relative importance of climate and local hydrogeological factors in influencing lake-level fluctuations. Palaeoecology of Africa, 12, 137–158.
- Szesztay, K., 1974. Water balance and water level fluctuations of lakes. Hydrological Sciences Bulletin, 19 (1), 73–84. doi:10.1080/02626667409493872
- Todhunter, P.E., 2016. Mean hydroclimatic and hydrological conditions during two climatic modes in the Devils Lake Basin, North Dakota (USA). Lakes & Reservoirs: Research and Management, 21 (4), 338–350. doi:10.1111/lre.12152
- Todhunter, P.E. and Fietzek-DeVries, R., 2016. Natural hydroclimatic forcing of historical lake volume fluctuations at Devils Lake, North Dakota (USA). Natural Hazards, 81 (3), 1515–1532. doi:10.1007/s11069-015-2143-6
- Todhunter, P.E. and Knish, E.A., 2014. Lake flooding and synoptic weather-type frequency at Devils Lake, North Dakota, USA, between 1965 and 2010. Climate Research, 61 (3), 191–201. doi:10.3354/cr01253
- Todhunter, P.E. and Rundquist, B.C., 2004. Terminal lake flooding and wetland expansion in Nelson County, North Dakota. Physical Geography, 25 (1), 68–85. doi:10.2747/0272-3646.25.1.68
- USGS, 2014.Devils Lake and Stump Lake Area-Capacity Table [online]. USGS Water Data for the Nation. Available from: http://nd.water.usgs.gov/devilslake/pdf/elevation-area-volume.pdf [accessed 18 February 2014].
- USGS (United States Geological Survey), 2013. USGS 05056500 Devils Lake nr Devils Lake, ND [online]. USGS Water Data for the Nation. Available from: http://nwis.waterdata.usgs.gov/nd/nwis/nwisman? [accessed 15 November 2013].
- Van Der Kamp, G., Hayashi, M., and Gallén, D., 2003. Comparing the hydrology of grassed and cultivated catchments in the semi-arid Canadian prairie. Hydrological Processes, 17 (3), 559–575. doi:10.1002/hyp.1157
- Vecchia, A.V., 2002. Simulation of a proposed emergency outlet from Devils Lake, North Dakota. U.S. Geological Survey Water-Resources Investigations Report 02-4042. Denver: United States Geological Survey. doi:10.1044/1059-0889(2002/er01)
- Vecchia, A.V., 2008. Climate simulation and flood risk analysis for 2008-40 for Devils Lake, North Dakota.U.S. Geological Survey Scientific Investigations Report 2008-5011. Denver: United States Geological Survey.
- Wiche, G.J., 1992. Hydrology and water-level fluctuations of Devils Lake, North Dakota. U.S. Geological Survey Water-Supply Paper 2340, 75–87, Denver: United States Geological Survey.
- Wiche, G.J. and Pusc, S.W., 1994. Hydrology of Devils Lake area, North Dakota.North Dakota State Water Commission Water Resources Investigation 22. Bismarck, North Dakota: North Dakota State Water Commission. doi:10.3168/jds.S0022-0302(94)77044-2
- Wiche, G.J. and Vecchia, A.V., 1996. Lake-level frequency analysis for Devils Lake, North Dakota. U.S. Geological Survey Water-Supply Paper 2469. Denver: United States Geological Survey.
- Williams, W.D., 1996. What future for saline lakes? Environment, 38 (9), 13–20, 38–39.
- Williams, W.D., 2002. Environmental threats to salt lakes and the likely status of inland saline ecosystems in 2025. Environmental Conservation, 29 (2), 207–212. doi:10.1017/S0376892902000103
- Winter, T.C. and Rosenberry, D.O., 1998. Hydrology of Prairie Pothole wetlands during drought and deluge: A 17-Year study of the Cottonwood Lake wetland complex in North Dakota in the perspective of longer term measured and proxy hydrological records. Climatic Change, 40 (2), 189–209. doi:10.1023/A:1005448416571
- Zhang, B., Schwartz, F.W., and Liu, G., 2009. Systematics in the size structure of prairie pothole lakes through drought and deluge. Water Resources Research, 45, W04421. doi:10.1029/2008WR006878
- Zheng, H., Barta, D., and Zhang, X., 2014. Lessons learned from adaptation response to Devils Lake flooding in North Dakota, USA. Regional Environmental Change, 14 (1), 185–194. doi:10.1007/s10113-013-0474-y