
ABSTRACT
The effect of pressure-driven groundwater recharge signal propagation in the Andean-Atacamenian environment is investigated by assessing a record of 15 years of water table fluctuations of an unconfined–confined aquifer system. Based on a singular spectrum analysis of water table time series, it is shown that, in the given case, groundwater levels in the central Atacama Desert are hydraulically controlled by two distant recharge areas associated with the Andes. The maximum observed range of the pressure signal propagation is ~50 km over an elevation difference of more than 3000 m at a lag of ~25 months. Several findings indicate that an often-cited study misinterpreted a water level rise at the same site as an in-situ alluvial fan recharge. Thus, the effect’s impact on groundwater dynamics in complex aquifer systems can easily be overlooked. Singular spectrum analysis could be of use to investigate pressure effects at hydrologically comparable sites.
Editor A. Castellarin Associate editor A. Fiori
1 Introduction
Many aquifers in northern Chile are being overexploited (Valdés-Pineda et al. Citation2014, Chávez et al. Citation2016, Scheihing and Tröger Citation2017). Understanding groundwater recharge processes in the environment of the arid Andes and the hyper-arid Atacama Desert is a key to the successful management of scarce water resources in northern Chile ()) (Valdés-Pineda et al. Citation2014, Uribe et al. Citation2015, Kikuchi and Ferré Citation2016, Herrera et al. Citation2017, Oyarzún et al. Citation2017, Custodio et al. Citation2018, Viguier et al. Citation2018). However, in many cases, Atacamenian hydrogeological systems lack a profound functional understanding, due to their complex geology as well as often remote and vastly extended areas which complicate data collection. The same is true for a variety of arid regions worldwide. A significant hydrogeological parameter for assessing the sustainability of groundwater extractions and the influence of modern recharge on aquifers – including the Atacama region – is the water table fluctuation (Houston Citation2002, Valdés-Pineda et al. Citation2014, Ribeiro et al. Citation2015, Chávez et al. Citation2016, Scheihing and Tröger Citation2017).
Figure 1. (a) South America (study area marked by a rectangle), and (b) topographic map of the study area. Arrows indicate the direction of recharge signal propagation (first value of white annotations indicates identified lag of pressure signal propagation and the second value indicates mean residence times). Water table contour lines are based on Jica (Citation1995).
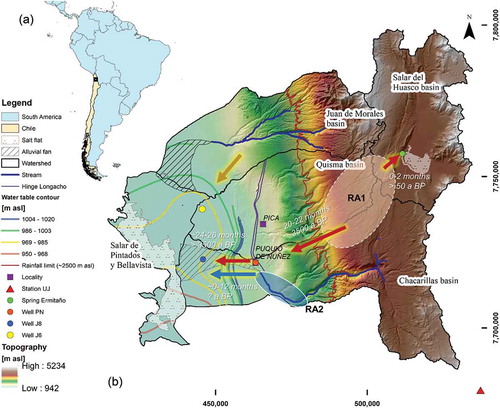
Central to this technical note are the water table dynamics at well J8, which penetrates parts of a sedimentary unconfined–confined aquifer system, the Pampa del Tamarugal Aquifer (PdT), found in the central Atacama Desert of northern Chile (Aravena Citation1995, Jica Citation1995). Well J8 is a deep well approximately 200 m below ground level (b.g.l.) (Jica Citation1995). A recent thorough assessment of δ18O isotopes of meteoric water in the study area, combined with depth-related groundwater isotope samples from well J8, suggests that the well receives water from two different recharge areas (Scheihing et al. Citation2018). The first recharge area is situated in the Andean Precordillera (RA1, )), which is located above the regional rainfall limit of ~2500 m a.s.l. (Houston Citation2006). The second recharge area was identified to be the lower stream segment of the Chacarillas River (RA2, )) that regularly bears water after rainfall events over the Chacarillas catchment (main recharge area at elevations between 1200 and 2200 m a.s.l.) (Scheihing et al. Citation2018). However, the water level fluctuation at well J8 has also been the subject of an often-cited study to investigate in-situ groundwater recharge amounts through the Chacarillas alluvial fan due to occasional flash floods ()) (Houston Citation2002).
Based on the signal decomposition of the water table time series at well J8 ()), this technical note demonstrates that interpreting the rise of groundwater tables in the Atacama Desert as the sole effect of in-situ groundwater recharge can run the risk of leading to false conclusions. Recharge-driven pressure effects are an often neglected but essential factor when assessing groundwater dynamics in complex aquifer systems, particularly in arid, mountainous regions. It is demonstrated that the effect can control water table fluctuations in the short term, even over distances of tens of kilometres. In this regard, the presented methodology could be of use for identifying the influence of pressure effects on water table fluctuations in similar environments.
2 Methodology
The methodology applied to execute the time series analysis at well J8 ()) followed a procedure proposed by Hanson et al. (Citation2004). It consisted in interpolating the time series to monthly values from tri-monthly data with an Akima spline (Akima Citation1978). Hence, the interpolated time series was detrended by a linear fit and standardized by mean and variance (Hanson et al. Citation2004). Finally, a signal decomposition by singular spectrum analysis was carried out (window length: 24 months) (Vautard et al. Citation1992, Hanson et al. Citation2004). Data from the spring Ermitaño (SE) and well Puquio Nuñez (PN) were likewise interpolated by an Akima spline from bi- and tri-monthly measurements to monthly data.
Another concept entertained is the cumulative rainfall departure (crd), which yields a rainfall trend time series based on monthly precipitation amounts (Houston Citation2002, Weber and Stewart Citation2004, Scheihing et al. Citation2017). The study area, as well as the locations of relevant hydrological stations, are displayed in ).
Prepared time series were correlated using the Pearson cross-correlation, which measures the degree of linear correlation between two variables for a pre-set number of time steps (lag) (Kendall and Gibbons Citation1990). Cross-correlation is commonly used in hydrology in conjunction with interpolation techniques to investigate the interdependence of hydrological time series (Marco et al. Citation1993, USGS Citation2014). However, particularly irregular sampled data experience a reduction in variance toward the high-frequency range after interpolation (Rehfeld et al. Citation2011). Hence, the accuracy of calculated peak cross-correlation coefficients for interpolated time series decreases for short observation periods (Rehfeld et al. Citation2011). Thus, the methodology yields reliable results only if the sampling interval is considerably shorter than the trend time scale assessed. This is achieved in the given case by correlating time series of observation periods greater than 10 years. All data were retrieved from public servers of the Chilean Water Directorate (DGA Citation2017).
3 Results
) depicts the water table fluctuation at well J8 from 1998 to 2016, and the two resulting signal components as derived by singular spectrum analysis. While the first component (J8 RC1) represents a low-frequency signal that explains 23% of the time series fluctuations, the remaining residuals exhibit a higher frequency and reflect short-term variations. ) demonstrates rainfall data measured at meteorological station Ujina (UJ) and the resulting cumulative rainfall departure. Station UJ is the closest rainfall station to the Chacarillas catchment. On the second y-axis of ), the first reconstructed component J8 RC1 was added. Both time series show a very high cross-correlation coefficient with a maximum of ~0.75 ()). Due to the low frequency of the signal, the precise lag for the signal correlation cannot be determined. However, highest cross-correlation coefficients above 0.5 plot at a lag of 0–12 months.
Figure 2. (a) Water table time series of well J8 and resulting reconstructed components yielded by singular spectrum analysis. A standardized hydraulic head time series of well J6 was added for comparison. (b) Rainfall data of station UJ and calculated cumulative rainfall departure (crd) together with the first reconstructed component of well J8 (J8 RC1). (c) Comparison of water table fluctuations at well PN in the Andean foothills and the lagged time series of spring discharge at spring Ermitaño (SE) in the Andes. (d) Water table fluctuations at well PN compared to the residuals from the time series of well J8 (J8 residuals).
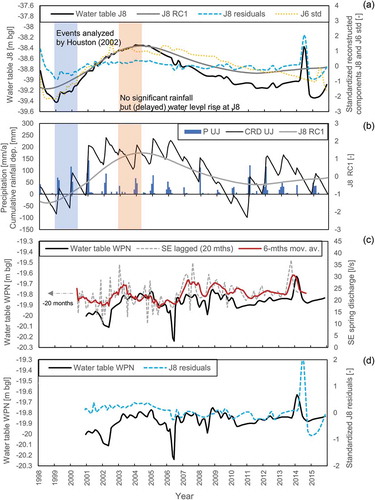
Figure 3. (a) Pearson cross-correlation coefficients for the time series of (a) crd UJ and J8 RC1 (see )), and (b) well PN and J8 residuals (see )).
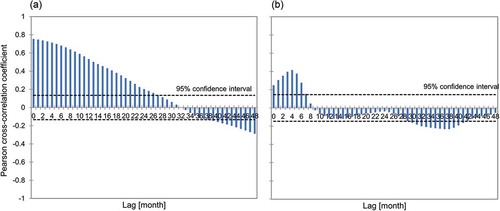
) shows the time series of the water table fluctuation at well PN (in the Andean foothills, )) and the spring discharge of SE lagged by 20 months (situated in the Andean Altiplano). The physical correlation between both series was demonstrated statistically by Scheihing et al. (Citation2017). The time series at well PN follows the hydraulic head signal trend of SE at a lag of 20–22 months, while the associated groundwater exhibits corrected mean residence times of ~3500 years before present (BP). At the same time, discharge amounts at SE respond hydraulically to rainfall events within 2 months but show corrected mean residence times above 50 years BP (Scheihing et al. Citation2017). Both well PN and spring SE join the same recharge area, which is here termed RA1 ()). Further, ) visualizes the time series of well PN and the residuals of the spectral decomposition for the time series at well J8 (J8 residuals). A cross-correlation of both datasets reveals a maximum cross-correlation coefficient of 0.4 at a lag of 4 months (above 95% confidence interval) ()).
4 Discussion and conclusions
The cumulative rainfall departure time series of station UJ can be understood as a relative proxy of river discharge amounts in the Chacarillas catchment. Hence, the very high and positive cross-correlation at a lag of a few months between the time series CRD UJ and J8 RC1 ( and (a)) confirms that a significant part of the well’s water table fluctuation is controlled by a recharge pressure signal provided by RA2. The smooth trend strongly suggests that the component J8 RC1 is indeed caused by riverbed infiltrations and not by occasional flooding events at the respective alluvial fan channels. Such flood events show a mean return period of 4 years (Houston Citation2002) and should cause abrupt, isolated recharge signals and not a water level rise proportional to the rainfall trend. The lacking influence of alluvial fan recharge is supported by the apparent delay of the water table response at well J8 to rainfall events over the Chacarillas catchment. For example, in ) and (b), it can be seen that, despite the absence of significant rainfall in the region in 2003 and 2004, the water level component J8 RC1 at well J8 continues to rise over a 2-year period. This effect is very likely induced by infiltrating recharge fronts along the Chacarillas River that slowly reach the hydraulic system of the investigated aquifer, and the time the respective pressure signal needs to propagate over the ~20 km distance to the well’s position. Such pressure-signal propagations are controlled by the hydraulic diffusivity of the aquifer and are mainly of importance for confined aquifers that typically exhibit low specific storage (Tóth Citation2009, Maliva and Missimer Citation2012). The lower the specific storage, the higher the aquifer’s sensitivity to pressure changes and the faster the signal transmission (Tóth Citation2009).
The results confirm the hydro-isotopic findings of Scheihing et al. (Citation2018), who proposed that there is no significant recharge occurring from the alluvial fan of the Chacarillas catchment (contrary to suggestions by Houston Citation2002). Houston (Citation2002) interpreted the water level rise at well J8 in response to alluvial fan flooding in 1999 and 2000 ()) as the sole result of in-situ alluvial fan recharge from alluvial fan channels. The fact that the residuals time series of the water table fluctuation at well J8 (J8 residuals) positively correlates to a signal recorded at well PN ( and (b)) further substantiates the insignificance of a shallow alluvial fan recharge. That is because it demonstrates that high-frequency fluctuations at well J8 are principally controlled by the confined aquifer section and thus its hydraulic diffusivity due to the fast signal propagation. The hydraulic signal at well PN originates from RA1 at ~4000 m a.s.l. ()) and propagates to well PN at a lag of ~21 months (Scheihing et al. Citation2017). From well PN, the pressure signal continues to propagate in only 4 months to well J8, over a distance of 15 km. Therefore, the total lag between rainfall and recharge events at RA1 and the hydraulic head response at well J8 is ~25 months. This relatively long delay demonstrates that the respective pressure signal cannot originate from the Chacarillas catchment, from which the signal transmits at a much shorter lag. It also implies that the component “J8 residuals” is controlled by rainfall in the Andean Precordillera at a distance of ~50 km, with a height difference of ~3000 m ()).
Besides, there is another observation well in the area (J6) that shows a hydraulic head trend in accord with regional rainfall trends, and which is not associated with an alluvial fan and hence cannot receive an in-situ alluvial fan recharge ()). The well J6 obtains its recharge from the stream bed of the Juan de Morales River, as was recently confirmed by a regional hydro-isotopic assessment ()) (Scheihing et al. Citation2018). It is therefore unquestionably possible that the hydraulic head time series at well J8 is likewise unaffected by in-situ alluvial fan recharge.
It is concluded that the water table fluctuation at well J8 is a composite of recharge pressure signals from two distant and different recharge areas that propagate at unlike lags within the sloping and confined aquifer section of the PdT. This sloping and confined aquifer unit receives its recharge at the basin’s margin, where the related geological formations are exposed.
In this context, it is worthwhile mentioning that Houston (Citation2002) used in his work the water-table-fluctuation method (wtf) to estimate recharge amounts provided by the Chacarillas alluvial fan. The wtf method can only be applied to unconfined aquifers for assessing the amount of in-situ recharge arriving at the shallow water table (Healy and Scanlon Citation2010). Because well J8 penetrates confined aquifer sections, the recharge amounts calculated by Houston (Citation2002) rely on a deficient methodology and are not reliable.
However, the conservation and propagation of recharge signals in the Atacama Desert over tens of kilometres might be favoured by the absence of significant rainfall below ~2500 m a.s.l. (Houston Citation2006) and, hence, the absence of a diffuse recharge below that altitude. Pressure signals by diffuse groundwater recharge could superimpose distant high-frequency pressure signals. Another supporting factor could be the confined to semi-confined nature of the regional PdT Aquifer (Jica Citation1995). However, these hydrological conditions are typical for a variety of arid regions worldwide, which emphasizes the general importance of taking into account far-reaching pressure effects when assessing respective groundwater dynamics.
Consequently, the findings suggest that modern groundwater recharge in the Andes can have an almost immediate impact on water levels at distant sites of the same hydraulic system due to pressure signal propagation. Furthermore, the assessment emphasizes the importance of high-quality, long-term monitoring data for hydrological research in the Atacama region (Lictevout and Gocht Citation2017). The proven hydraulic connection of the Pampa del Tamarugal Aquifer (the largest known aquifer in northern Chile) to Andean recharge areas also demands reconsideration of the conservatively established limits of the aquifer, which so far do not reach higher than ~1300 m a.s.l. (Jica Citation1995). At least in the investigated area, the aquifer needs to be understood as a sloping unit comprising a variety of geological formations that reach elevations of up to roughly 4000 m a.s.l. This understanding has implications for the estimated total storage of the aquifer of 27 km3 (Jica Citation1995), which will in fact be significantly higher.
However, the presented assessment supports the conclusion that the majority of water fractions that occasionally arrive as flash floods at the alluvial fan channels of the Chacarillas catchment are lost by evaporation. This floodwater loss might also apply to other alluvial fans that spread into the Pampa del Tamarugal (Scheihing et al. Citation2018). The understanding that these water fractions might not contribute significantly to groundwater recharge in the Atacama Desert opens the opportunity to investigate options for enhanced management and use of these substantial amounts of water.
The existence of short-term recharge pressure propagation in confined aquifers is an effect addressed by other authors (Fenelon and Moreo Citation2002, Tóth Citation2009, Maliva and Missimer Citation2012). Nevertheless, as demonstrated by this technical note, it is also an effect easily neglected in applied groundwater recharge and management investigations. Thus, the value of this technical note exceeds the scope of a case study by drawing attention to the effect’s relevance for groundwater studies, particularly in arid regions, and its potentially far-reaching impact at short time scales (pressure propagation over 50 km in 25 months). In this context, the presented methodology could be of use at other hydrologically comparable sites to identify the influence of pressure effects on groundwater dynamics in complex aquifer systems.
Disclosure statement
No potential conflict of interest was reported by the author.
References
- Akima, H., 1978. A method of bivariate interpolation and smooth surface fitting for irregularly distributed data points. ACM Transactions on Mathematical Software, 4 (2), 148–159. doi:10.1145/355780.355786
- Aravena, R., 1995. Isotope hydrology and geochemistry of northern chile groundwaters. Bulletin de l’Institut français d’études andines 24.
- Chávez, R.O., et al., 2016. 50 years of water extraction in the Pampa del Tamarugal basin. Can Prosopis tamarugo trees survive in the hyper-arid Atacama Desert (Northern Chile)? Journal of Arid Environments, 124, 292–303. doi:10.1016/j.jaridenv.2015.09.007
- Custodio, E., et al., 2018. Changes in groundwater reserves and radiocarbon and chloride content due to a wet period intercalated in an arid climate sequence in a large unconfined aquifer. Journal of Hydrology, 556, 427–437. doi:10.1016/j.jhydrol.2017.11.035
- DGA (Chilean Water Directorate), 2017. Información Oficial Hidrometeorológica y de Calidad de Aguas en Línea (Oficial online information; hydrometeorology and water quality) [online]. Ministerio de Obras Publicas Chile. Available from: http://snia.dga.cl/BNAConsultas/reportes [Accessed 20 July 2017].
- Fenelon, J.M. and Moreo, M.T., 2002. Trend analysis of ground-water levels and spring discharge in the Yucca Mountain Region, Nevada and California, 1960–2000. Nevada, USA: US Geological Survey, US Geological Survey, Water-Resources Investigations Report 02-4178 doi:10.1044/1059-0889(2002/er01)
- Hanson, R.T., Newhouse, M.W., and Dettinger, M.D., 2004. A methodology to asess relations between climatic variability and variations in hydrologic time series in the southwestern United States. Journal of Hydrology, 287 (1–4), 252–269. doi:10.1016/j.jhydrol.2003.10.006
- Healy, R.W. and Scanlon, B.R., 2010. Estimating groundwater recharge. Cambridge, UK: Cambridge University Press.
- Herrera, C., et al., 2017. Groundwater origin and recharge in the hyperarid Cordillera de la Costa, Atacama Desert, northern Chile. The Science of the Total Environment, 624, 114–132. doi:10.1016/j.scitotenv.2017.12.134
- Houston, J., 2002. Groundwater recharge through an alluvial fan in the Atacama Desert, northern Chile: mechanisms, magnitudes and causes. Hydrological Processes, 16 (15), 3019–3035. doi:10.1002/(ISSN)1099-1085
- Houston, J., 2006. Variability of precipitation in the Atacama Desert: its causes and hydrological impact. International Journal of Climatology, 26 (15), 2181–2198. doi:10.1002/(ISSN)1097-0088
- Jica, 1995. The study on the development of water resources in Northern Chile [online]. Japan International Cooperation Agency. Available from: http://sad.dga.cl/[Accessed 13 May 2016].
- Kendall, M.G. and Gibbons, J.D., 1990. Rank correlation methods. 5th. ed. New York, USA: Oxford Univ. Press.
- Kikuchi, C.P. and Ferré, T.P.A., 2016. Analysis of subsurface temperature data to quantify groundwater recharge rates in a closed Altiplano basin, northern Chile. Hydrogeology Journal, 25 (1), 103–121. doi:10.1007/s10040-016-1472-1
- Lictevout, E. and Gocht, M., 2017. Hydrometric network design in hyper-arid areas. Example of Atacama Desert (North Chile). Hydrology Research, nh2017004. doi:10.2166/nh.2017.004
- Maliva, R. and Missimer, T., 2012. Arid lands water evaluation and management. Berlin, Germany: Springer-Verlag.
- Marco, J., Harboe, R., and Salas, J., 1993. Stochastic hydrology and its use in water resources systems simulation and optimization. The Netherlands: Kluwer Academic Publishers.
- Oyarzún, R., et al., 2017. A simple approach for the analysis of the structural-geologic control of groundwater in an arid rural, mid-mountain, granitic and volcanic-sedimentary terrain. The case of the Coquimbo Region, North-Central Chile. Journal of Arid Environments, 142, 31–35. doi:10.1016/j.jaridenv.2017.03.003
- Rehfeld, K., et al., 2011. Comparison of correlation analysis techniques for irregularly sampled time series. Nonlinear Processes in Geophysics, 18 (3), 389–404. doi:10.5194/npg-18-389-2011
- Ribeiro, L., et al., 2015. Evaluating piezometric trends using the Mann-Kendall test on the alluvial aquifers of the Elqui River basin, Chile. Hydrological Sciences Journal, 60 (10), 1840–1852. doi:10.1080/02626667.2014.945936
- Scheihing, K., et al., 2018. Reassessing hydrological processes that control stable isotope tracers in groundwater of the Atacama Desert (Northern Chile). Hydrology, 5 (1), 3. doi:10.3390/hydrology5010003
- Scheihing, K. and Tröger, U., 2017. Local climate change induced by groundwater overexploitation in a high Andean arid watershed, Laguna Lagunillas basin, northern Chile. Hydrogeology Journal, 16 (7), 1817. doi:10.1007/s10040-017-1647-4
- Scheihing, K.W., Moya, C.E., and Tröger, U., 2017. Insights into Andean slope hydrology. Reservoir characteristics of the thermal Pica spring system, Pampa del Tamarugal, northern Chile. Hydrogeology Journal, 119 (2), 33. doi:10.1007/s10040-017-1533-0
- Tóth, J., 2009. Gravitational systems of groundwater flow. Theory, evaluation, utilization. 1st. ed. Cambridge, UK: Cambridge Univ. Press.
- Uribe, J., et al., 2015. Assessing groundwater recharge in an Andean closed basin using isotopic characterization and a rainfall-runoff model. Salar del Huasco basin, Chile. Hydrogeology Journal, 23 (7), 1535–1551. doi:10.1007/s10040-015-1300-z
- USGS (US Geological Survey), 2014. Hydroclimate manual. Hydrologic and climatic analysis toolkit [online]. Available from: http://pubs.usgs.gov/tm/tm4a9/pdf/tm4-a9.pdf [Accessed 15 August 2016].
- Valdés-Pineda, R., et al., 2014. Water governance in Chile. Availability, management and climate change. Journal of Hydrology, 519, 2538–2567. doi:10.1016/j.jhydrol.2014.04.016
- Vautard, R., Yiou, P., and Ghil, M., 1992. Singular-spectrum analysis. A toolkit for short, noisy chaotic signals. Physica D: Nonlinear Phenomena, 58 (1–4), 95–126. doi:10.1016/0167-2789(92)90103-T
- Viguier, B., et al., 2018. Multidisciplinary study for the assessment of the geometry, boundaries and preferential recharge zones of an overexploited aquifer in the Atacama Desert (Pampa del Tamarugal, Northern Chile). Journal of South American Earth Sciences. doi:10.1016/j.jsames.2018.05.018
- Weber, K. and Stewart, M., 2004. A critical analysis of the cumulative rainfall departure concept. Groundwater, 42 (6), 935–938. doi:10.1111/j.1745-6584.2004.t01-11-.x