
ABSTRACT
The environment of Bosten Lake in the Mid-Eastern Yanqi Basin (MEYB), an arid inland area in northwest China, has deteriorated greatly due to increasing groundwater exploitation and changes in the interactions between groundwater and surface water. This study intended to simulate the spatio-temporal variability of groundwater and surface water across the entire MEYB over the period 2000–2013. The applicable groundwater flow model and mass balance calculation method for river water were constructed to evaluate the change in groundwater recharged by and discharged to different segments of the Kaidu River. Simulation results show that the entire river seepage in the MEYB increased from 1.05 to 6.17 × 10⁸ m3/year between 2000 and 2013. The increasing river seepage, induced by increasing groundwater exploitation, plays the most important role in the water level decline in the downstream reaches of the Kaidu River and in Bosten Lake. This implies that the current utilization of groundwater resources in the MEYB is unsustainable.
Editor D. Koutsoyiannis Associate editor T. Okruszko
1 Introduction
Groundwater and surface water are essential to agricultural, industrial, domestic and environmental uses, and thus have important effects on economic development (Glazer and Likens Citation2012, McCallum et al. Citation2012, Guay et al. Citation2013, Unland et al. Citation2013, Elsawwaf et al. Citation2014, Matula et al. Citation2014). The Mid-Eastern Yanqi Basin (MEYB) is a typical arid inland basin in Bayingolin Mongolian Autonomous Prefecture, where groundwater and surface water depletion has become a critical problem affecting major regions of Xinjiang Uyghur Autonomous Region in northwestern China ( and ). Due to its relatively suitable conditions, the MEYB is the main grain production region in southern Xinjiang and the main water-supply source area to Korla City (Ouyang Citation2008, Zhong Citation2008, Du Citation2009, Tao Citation2012, Wang Citation2013, Citation2014).
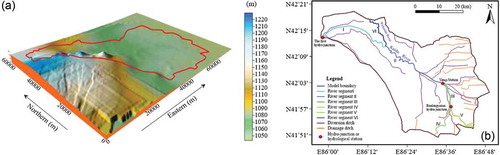
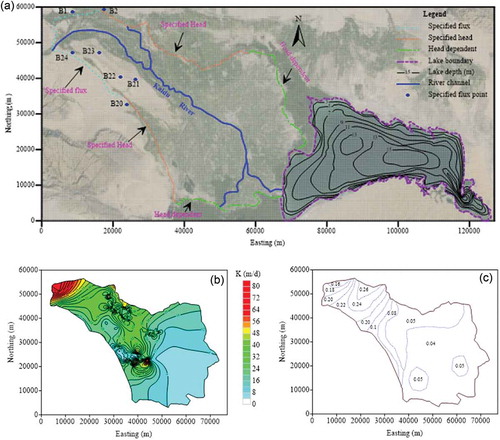
Figure 1. Location and topography of the Mid-Eastern Yanqi Basin. I–I′ and II–II′ are the lines of cross-sections in .
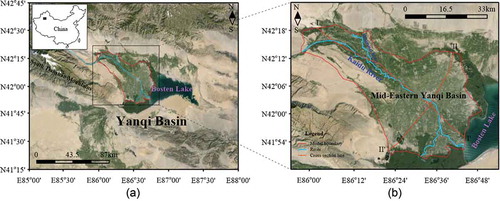
Figure 2. (a) Elevation of the study region, and (b) distribution of diversion ditches, drainage ditches and division of the river channel in the MEYB.
Bosten Lake lies in the eastern MEYB, and is the biggest inland freshwater lake in China, covering an area of 1002.4 km2. As the most important river in the MEYB, the Kaidu River flows through the MEYB into Bosten Lake, with an annual flow of 34.86 × 10⁸ m3/year. Bosten Lake is also the origin of the Kongque River (Wang et al. Citation2014). As the unique outflow stream of Bosten Lake, the Kongque River is the only viable source of water supply for the 0.85 million downstream population. Further south of the Kongque River, the lower reaches of the Tarim River flow through the Tarim basin and into Luobupo Lake in Xinjiang Province. Over the past half century, unbridled water utilization of the Tarim River has led to serious water scarcity and ecological damage. The most seriously adverse effect is on the lower reaches of the Tarim River, where significant groundwater level decline has occurred and the ecosystem has deteriorated. To retrieve the natural environment of the lower reaches of the Tarim River, the Ecological Water Conveyance Project (EWCP) was implemented in 1999 (Ye et al. Citation2009). Under the EWCP, Bosten Lake, as the emergency water source, has been diverted through the Kongque River to the lower reaches of the Tarim River since 2000. Consequently, Bosten Lake has become the main water supply source for those living in the lower reaches of the Tarim and for its ecology; thus, it is known as “the Mother Lake” of the Bayingolin Mongolian Autonomous Prefecture (Ouyang Citation2008, Du Citation2009).
With the rapid development of agriculture, water from the diversion can hardly satisfy the water consumption over the MEYB, so groundwater is exploited. However, the increased groundwater exploitation has changed the interaction between the Kaidu River and the groundwater, and has led to serious problems of water resources and the Bosten Lake environment. Therefore, it is important to study the interaction between the Kaidu River and the groundwater in the MEYB to achieve sustainable development and protect the water resources and environment.
It has been 57 years since the meteorological stations and hydrological stations in the MEYB were built. Then, many projects were launched to conduct hydrogeological reconnaissance, surface water observation, groundwater observation and hydrological budget research. Consequently, various researches were implemented to study soil water, surface water and groundwater in the MEYB. Based on the evaluation of water resources in the MEYB, Liu (Citation2004) built a regional groundwater model to calculate the amount of water exchange between surface water and groundwater. However, this model was limited to short-term variation of interaction between surface water and groundwater, being for only one year. Soil water and salt transportation in a typical experimental area of the MEYB were also studied by Wang (Citation2005). Furthermore, Ouyang (Citation2008) built a water and salt balance model to evaluate the shallow groundwater and irrigation schedule in the MEYB at the field scale. Similarly, a regulation-control model for the whole Yanqi Basin was developed by Zhong (Citation2008) to investigate the water cycle and salt transport in Bosten Lake, although the regional variation of groundwater and surface water is hard to derive from this work. Using chemical and isotopic data, Wang (Citation2013, Citation2014) determined the groundwater age and its recharge conditions, and analysed the groundwater sustainability. The temporal and spatial variation of water stable isotopes in the Kaidu River was investigated by Wang et al. (Citation2014) to identify the hydrological processes and hydrological composition of groundwater in the MEYB. In spite of extensive work and substantial progress in this area, the interaction between surface water and groundwater at the regional scale is still not clear.
Identifying the surface water–groundwater interaction in a watershed is essential for understanding the water cycle and sustainable integrated water resources utilization (Glazer and Likens Citation2012, McCallum et al. Citation2012, Guay et al. Citation2013, Unland et al. Citation2013, Elsawwaf et al. Citation2014, Matula et al. Citation2014). The Navier-Stokes-based shallow water equations for surface water flow and Darcy’s equation for groundwater flow were coupled and applied to a linear Stokes problem by Marco et al. (Citation2002). Considering precipitation, upstream runoff and cultivated land area, a multifactor hydrological response model was developed by Wang et al. (Citation2007) to investigate the responses of hydrological processes to land use in the middle basin of the Heihe River. The stable isotope technique was used to trace a major source of mountain runoff to the Heihe River and make important observations to identify the water cycle process (Wang et al. Citation2009). To investigate hydrological response to multimodel climate output, Sulis et al. (Citation2012) conducted a process-based model of integrated surface water and groundwater. The 222radon technique was applied to evaluate surface water–groundwater connectivity in arid environments (Oyarzún et al. Citation2014). Benthic fluxes were simulated by Sawyer et al. (Citation2013) to investigate the dynamic response of surface water–groundwater exchange in a shallow estuary. Through physico-chemical in-stream profiling, spatial groundwater–surface water interactions were delineated in small headwater catchments by Haria et al. (Citation2013).
Numerical models are applied to assess groundwater–surface water interactions and play an increasingly important role. Based on MODFLOW computer code, a mathematical model was used to estimate the artificial groundwater recharge quantities for a semi-arid basin (Al-Assa’d and Abdulla Citation2010). Similarly, groundwater evapotranspiration was estimated using MODFLOW models in a semi-arid region (Ajami et al. Citation2011). A groundwater flow model was developed by Yao et al. (Citation2014) to assess the flow exchanges between different parts of the water system in the Heihe Basin, and this provided an effective means to understand the complex flow system. For underground coal mining, a flow model had an important effect on evaluating the rapid infiltration of surface water and slow release of groundwater from the mine ore body (Cravotta et al. Citation2014). A transient, integrated hydrological model was applied to a hard-rock catchment by Hassan et al. (Citation2014) to study the dynamics of surface water–groundwater interactions in a complicated hard-rock system. By measuring the hydraulic head in the riparian zone near rivers and the fluid pressure in the river beds, the connectivity between rivers and aquifers was explored in a semi-arid river basin by Lamontagne et al. (Citation2014). Furthermore, the Soil and Water Assessment Tool (SWAT) and MODFLOW were coupled to enhance the ability to understand groundwater–surface water interactions, in which the coupled SWAT-MODFLOW model was applied to simulate surface hydrology and groundwater hydrology accurately for a river system in a semi-arid region (Bailey et al. Citation2016).
In this study, we develop a numerical model to study surface water and groundwater interaction in the MEYB, the main irrigation area on the west bank of Bosten Lake. In contrast to the groundwater flow model on a small time scale and in limited space (cf. Liu Citation2004, Wang Citation2004, Ouyang Citation2008, Du Citation2009), we built a regional-scale, long-term model to evaluate the mass exchange between surface water and groundwater between 2000 and 2013. Investigations and field experiments were conducted to obtain the spatial distribution of the surface water system and of hydrogeological parameters. Then, a conceptual and numerical model based on MODFLOW-NWT was established and calibrated with the long series of observation data. The calibrated model was used to investigate the interactions between surface water and groundwater in the MEYB between 2000 and 2013. Meanwhile, the water balance of the whole river channel was computed using the Streamflow-Routing (SFR2) package (Niswonger and Prudic Citation2005) of MODFLOW-NWT in the study region to evaluate the change in groundwater recharge and discharge in various segments of the Kaidu River over a long period of time. In this study, the surface water and groundwater are treated as an entity and analysed systematically and comprehensively at regional and long-term scales. Current understanding of the MEYB is limited by spatio-temporal variability in depletion at the small scale and the short-term variation of dynamics of the surface water and groundwater. Thus, this study is essential for better understanding of the hydraulic links between the groundwater and surface water systems. Detailed terms in the water budget, the correlations among them, the interaction between surface water and groundwater in six different river segments, and sensitivity analysis of flow model were explored comprehensively to derive the main factors leading to water depletion and deterioration of Bosten Lake. An effective management tool was developed to help estimate the effects of groundwater exploitation and distribute water resources for water supply and environmental protection.
2 Site description and hydrogeology
The MEYB is the main irrigation area on the western shore of Bosten Lake. The location of the MEYB and its boundaries (41°48ʹ–41°24ʹN; 85°54ʹ–86°54ʹE) is shown in . The basin includes Hejing, Yanqi and Bohu counties. It is located in the loose Quaternary sediments of the South Tianshan Mountains, on the middle and lower reaches of the Kaidu River. As the MEYB is situated in inner Eurasia and is remote from the ocean, the environmental and hydrological conditions are influenced by a continental climate with dry weather, dry air and low temperatures, where precipitation is quite low and evaporation is intensive.
There are significant differences in climate between the mountain and plain areas across the Yanqi Basin. There is really no summer season in the mountain area, where the lowest elevation is higher than the semi-permanent snow line and therefore perpetually covered with snow and ice. The annual precipitation in the mountain area ranges from 300 to 500 mm (Liu Citation2004, Du Citation2009). In the plain region, the seasons are demarcated by a short summer and a long and dry winter. The average annual precipitation is 71.3 mm, most of which occurs between May and September. Corresponding to this climate, however, the average pan evaporation reaches 2120.9 mm annually, most of which is concentrated between March and October. Meanwhile, the ratio of open water evaporation to precipitation is more than 30, causing water scarcity all over the MEYB (Liu Citation2004, Zhong Citation2008, Du Citation2009).
As the biggest inland freshwater lake in China (), Bosten Lake consists of three parts: big lake, small lake and swamp, with a total area of about 1002.4 km2 and an amount of surface water of approximately 4.0 × 10⁹ m3. In the MEYB, diversion ditches, drainage ditches and rivers crisscross in the fields ()); the Kaidu River is the largest river, and the only perennial river that supplies Bosten Lake. There are three hydrological stations or major hydro-junctions along the Kaidu River in the MEYB: the first hydro-junction, Yanqi hydrological station, and Baolangsumu hydro-junction ()). The annual discharge from the Kaidu River to Bosten Lake is 34.8 × 10⁸ m3 (2000–2013), accounting for over 80% of the total annual recharge volume of Bosten Lake.
For the Kaidu River, monthly runoff varies tremendously. The dry season is from October to the following March, and the flood season from April to September. In April–May, the runoff amount of the Kaidu River is about 19% of the annual amount, with peak runoff in June–August (45.5%). Then, in September–November, the runoff decreases and recharge comes mainly from groundwater in the whole river basin. The driest period is between December and the following March, with runoff of 14.7% of the annual amount (Ouyang Citation2008, Zhong Citation2008, Du Citation2009, Qian et al. Citation2006, Tao Citation2012). The annual variation in Kaidu River runoff at different hydrological stations is given in .
Table 1. Annual variation in Kaidu River runoff at different stations (2000–2013).
The MEYB is the main agricultural production region of southern Xinjiang, and irrigation water is the major source of water consumption due to the arid climate. Before the 1950s, the agricultural practice was carried out on a small scale and the hydrological cycle was kept in a nearly original or natural state. Since the 1950s, agriculture has been developing rapidly, with large tracts of wasteland being reclaimed. Due to non-uniform water distribution, the agricultural fields have to be irrigated by water diverted from the Kaidu River; as a result, the diversion system and drainage system covering the whole MEYB were built quickly (Ouyang Citation2008, Zhong Citation2008, Du Citation2009, Qian et al. Citation2006, Tao Citation2012). With the rapid growth of agriculture, water from diversion can hardly satisfy the water consumption over the whole MEYB, so groundwater has to be exploited.
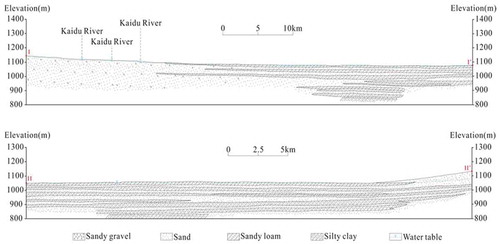
Groundwater in the MEYB exists in Quaternary alluvial aquifers, which comprise laterally discontinuous layers of gravel, sand and clay ( and ). The media in the aquifers vary from coarse particles to fine particles oriented from the piedmont to Bosten Lake, while the aquifers also turn from single-layer to multiple layers. In the piedmont area, sand gravel and sand are distributed alternately, and the groundwater recharges from lateral inflow, river flow, and precipitation infiltration. An aquifer with good permeability generally has a large amount of groundwater resources and excellent water quality. In the alluvial plain, the coarse sandy gravel media are interbedded with silt and silt clay (), and the depth to water table is so shallow (1–3 m below ground level) that evaporation from phreatic water is quite intense and is an important part of the groundwater discharge.
Figure 3. Schematic hydrogeological cross-section and groundwater system oriented west to east through the aquifer of the entire Yanqi Basin.
Figure 4. Hydrogeological cross-sections of the MEYB along the lines I–I′ and II–II′ (see ).
The area of irrigated farmland has been increasing since the beginning of the 21st century, and this has led to more intensive groundwater exploitation. In the MEYB, the cultivated land area has increased from 6700 to 120 000 hm2 since the 1950s (Liu Citation2004). In those areas irrigated by groundwater, irrigation activity has caused groundwater overexploitation. Consequently, the water table level is deepened year by year. The increasing groundwater exploitation has become an important limiting factor to social development and sustainability (Ouyang Citation2008, Zhong Citation2008, Du Citation2009, Gleeson et al. Citation2010, Qian et al. Citation2006, Tao Citation2012). Water diverted from the Kaidu River for crop irrigation is also increasing year by year, and this has been more than 30% of the runoff amount, simultaneously; thus, more and more groundwater is being exploited. As a result, the interaction between the Kaidu River and the groundwater has changed, while the flow rate from the Kaidu River into Bosten Lake is decreasing continuously. The Bosten Lake covered an area of 1262.3 km2 in 2002, which decreased to 800 km2 in 2013, with a decline in water level of up to 4.34 m (2002–2013). Simultaneously, the salinity of Bosten Lake has gradually increased from 1.17 g/L in 2002 to more than 1.5 g/L in 2013. Now, Bosten Lake has become a brackish lake (Liu Citation2004, Zhong Citation2008). In the same period, many precious species have disappeared or come close to extinction, leading to a decline in biological diversity. Furthermore, as the origin of the Kongque River and water supply source for the lower reaches of the Tarim, the water level decline of Bosten Lake is threatening the water safety of the Tarim lower reaches and its watershed ecology. This will adversely affect the ecological health of the Tarim Basin and restrict the sustainable development of both society and the economy in southern Xinjiang (Ye et al. Citation2009, Pang et al. Citation2010, Aishan et al. Citation2013, Chen et al. Citation2013). The combination of these factors makes the interaction between the Kaidu River and groundwater in the MEYB an important research issue.
3 Methodology
3.1 Model set-up and discretization
The governing equation for the flow model in the study region can be expressed as:
where h is the hydraulic head [L]; K is hydraulic conductivity [L T−1]; B is the elevation of the bottom of the aquifer [L]; qs is the volumetric flow rate of fluid sinks/sources per unit volume of aquifer [T−1]; S is the specific yield (dimensionless); and t is time [T].
The flow model is discretized spatially using a finite-difference method, as illustrated in ), which contains 254 columns and 120 rows with a uniform spacing of 500 m. Note that the modelled domain contains Bosten Lake, and the lake grid is set as inactive in the model while the water balance of Bosten Lake is being computed. All of the pumping wells in the study region are fully penetrating wells, penetrating multiple layers from the shallow aquifer through to the deep one so that the aquifers can be vertically grouped and considered as a single unconfined groundwater flow system. Correspondingly, the grids in model are composed of one single layer, specified as an unconfined type vertically to simulate a two-dimensional regional flow system. The Layer Property Flow (LPF) package was utilized to assign both horizontal and vertical hydraulic conductivity values to the aquifers. The horizontal distribution of hydraulic conductivity ()) is interpolated by a kriging method according to data obtained from 196 pumping tests in boreholes distributed all over the study region. In the LPF package, the vertical hydraulic conductivity values are specified as one-tenth of the values in the horizontal direction. Similarly, the specific yield ranges from 0.04 to 0.26 in the study region ()). The top and bottom elevations of the model are derived by interpolation of the data from digital elevation and the 1:200 000 hydrogeological map of the MEYB. For the transient model, the total simulation time is 14 years, discretized into 27 stress periods based on the irrigation scheme; every irrigation period in April–October is a stress period, as is November to the following March. The groundwater flow model is based on and solved by MODFLOW-NWT (Niswonger et al. Citation2011).
Figure 5. (a) Spatial discretization of the modelled domain and the prescribed boundary conditions; (b) distribution of hydraulic conductivity; and (c) distribution of specific yield in the model.
3.2 Boundary conditions and sink/source terms
The boundary setting of the model is illustrated in ). The interface between the plain and mountain terrains lies on the northwestern border of the model, where a significant amount of mountain front groundwater discharges laterally into the study region; thus the northwestern border of the model is defined as a specified-flux boundary based on the Flow and Head Boundary (FBH1) package (Leake and Lilly Citation1997). There are seven observation wells distributed at the northwestern boundary ()), where the hydraulic gradient is 0.0021–0.0054. Also, the hydraulic conductivity values at the seven observation points range from 15.0 to 81.5 m/d. Then the specified flux can be calculated as the product of hydraulic conductivity and hydraulic gradient. On the northern and western borders, the boundaries are defined as specified heads due to the existence of some observation points. Along the northeastern border is swamp area where groundwater reaches the land surface, so specified heads of the border are based on the ground elevation. The big lake and small lake of Bosten Lake are located on the eastern and southern edges, respectively, and were defined using the LAK and GHB packages, respectively. The big lake area of Bosten Lake was modelled using the LAK package (Merritt and Konikow Citation2000) of MODFLOW-NWT, in which both groundwater level and lake stage respond interactively to each other until an equilibrium state is reached. It should be noted that the bottom elevations of the lake are specified in the discretization package and no upper limit of lake stage is required by LAK logically. The lake girds are assigned as inactive cells in the model and the sink/source terms (e.g. precipitation, evaporation) are input to LAK ()). The runoff entering the lake and water diversion from the lake are illustrated in ); the runoff of the Kaidu River into Bosten Lake is calculated using the SFR2 package in our model and the other runoffs into Bosten Lake are aggregated as a direct input to the LAK package.
Figure 6. (a) Zonation of recharge coefficient of precipitation infiltration; (b) distribution of evapotranspiration coefficient; (c) precipitation and evaporation, and inflow/outflow of Bosten Lake; and (d) inflow and diversion of main segments within the study region.
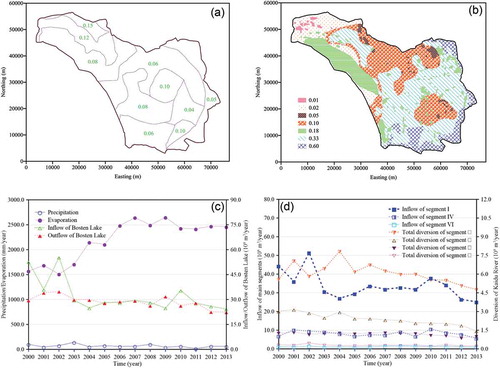
As an open border, the top boundary is implemented using the UZF package (Niswonger et al. Citation2006) in MODFLOW-NWT, and the areal sink/source terms, including precipitation recharge, irrigation infiltration and evaporation discharge, are imposed to the model. The saturated water content beneath the land surface is set as 0.3, and a Brooks-Corey exponent of 3.5 for the unsaturated zone is assigned to all aquifer grids. In this study area, the effective precipitation can be calculated approximately by surface pan precipitation monitored at weather stations and hydrological stations minus interception of 3 mm/month by the vegetation canopy (Du Citation2009). Then the actual recharge to the aquifer from precipitation is equal to the effective precipitation multiplied by the recharge coefficient of precipitation infiltration, as shown in ). Moreover, the return water from irrigation infiltration can be accurately calculated by multiplying the irrigation quota of 3.106–6.715 × 10⁻³ m/d by the irrigation infiltration coefficient of 0.10–0.25, as distributed in our study region (Du Citation2009). Therefore, the total amount of areal recharge in the irrigation area is the sum of infiltration from both precipitation and irrigation. As for the evaporation estimation, the distribution of the evapotranspiration coefficient, as shown in )), is determined by land use and vegetation coverage over the whole study region and the maximum evapotranspiration (ETmax) is equal to the evaporation from the water surface multiplied by the evapotranspiration coefficient. The calculated maximum ET ranges from 7.0058 × 10⁻⁶ to 7.5981 × 10⁻³ m/d in the study region, while the ET extinction depth is assigned as 5.0 m for all grids.
Besides the areal sinks/sources, drainage from ditches and channels can be treated as linear sink/source terms. In this study, the drainage ditches are simulated by the Drain package (DRN) of MODFLOW. The depth of the drainage ditches is 1.39–4.6 m and the width is 8–12 m; the drain conductance is about 5.58–68.9 m2/d. In contrast, the Kaidu River, Wulasitai River and other diversion ditches are simulated by the SFR2 package (Niswonger and Prudic Citation2005) of MODFLOW-NWT. The Kaidu River is divided into five segments (Segments I–V) and the Wulasitai River (Segment VI) and each ditch are set as individual segments. The cross-section of each segment is assumed to be a wide rectangular shape, the stream depth of which is calculated by Manning’s equation with Manning’s roughness coefficient of 0.03. The width of the segments of the Kaidu River ranges from 69 to 114 m, that of the diversion ditches ranges from 3 to 19 m, while the width of the Wulasitai River is set to a constant 22 m. Furthermore, the hydraulic conductivity of the stream bed ranges from 1.39 to 49.27 m/d, and the stream-bed thickness is about 3.0 m for both the Kaidu and Wulasitai rivers and 1.0m for the diversion ditches, according to field surveys and experiments. As shown in ), the runoff from the upstream reaches enters Segment I of the Kaidu River at the first hydro-junction, and then the outflow at the downstream end of Segment I continues flowing into segments II–V in sequence, finally flowing into Bosten Lake. Meanwhile, the outflow of Segment VI is also entering Segment II of the Kaidu River, but Segment VI belongs to the Wulasitai River. In addition, the inflows of the diversion ditches are all diverted from segments I–IV of the Kaidu River, which is measured in the period 2000–2013 and shown in )).
The bottom of the aquifer is specified as a no-flow boundary and groundwater exploitation can be clarified by the Well package, where input data are from the pumping rate at well locations throughout the study region.
3.3 Model calibration and validation
To measure the optimality of model calibration and validation, various quantitative performance criteria were used (Lemann and Casella Citation1998, Krause et al. Citation2005, Hyndman and Koehler Citation2006, SBTSC (State Bureau of Technical Supervision of China) Citation2008):
where Oi is the ith observation for the constituent being evaluated; Si is the ith simulated value; ei is the error term, which is the difference between observed and simulated values; is the mean of observed data for the constituent being evaluated;
is the mean of all simulated values for the constituent being evaluated; and N is the total number of observation data. Equation (2) shows the error terms, being the difference between observed and simulated values; the relative error (RE; Equation (3)) is the ratio of the absolute value of error terms to the observed value; the mean error (ME; Equation (4)) is the arithmetic average of all error terms; the mean absolute error (MAE; Equation (5)) is another popular error measure that averages the absolute value of the error terms; the mean squared error (MSE; Equation (6)) is the arithmetic mean of the sum of the squares of the error terms; the root mean square error (RMSE; Equation (7)) is the square root of the MSE; the standard deviation of residuals (STDres; Equation (8)) is defined as the square root of the variance, which measures the amount of variation or dispersion from the average; the coefficient of correlation (R; Equation (9)) is the ratio between the covariance and the multiplied standard deviations of the observed and simulated values (Lemann and Casella Citation1998, Zuo et al. Citation2015); and the Nash-Sutcliffe efficiency (E; Equation (10)) is the sum of the absolute difference between the simulated and observed values normalized by the variance of the observed values (Garambois et al. Citation2015, Zuo et al. Citation2015).
The calibration process was divided into two steps. First, the steady state was calibrated to the known groundwater field in 1999 when groundwater exploitation was not intensive. In this step, all parameters of the groundwater flow model, such as the hydraulic conductivity distribution and the value of the specified flux in the northwestern border, are adjusted to make the calculated hydraulic heads fit well with the measurements. Since the contour map of the observed water table prior to 1999 is available, the calibration of the steady-state model focuses on visual comparison of calculated and observed contour maps ()).
Figure 7. (a) Comparison of observed and calculated hydraulic head contours in 1999; (b) comparison of observed and computed groundwater heads at all observation wells; (c) groundwater level contours in November 2013; and (d) observed vs computed heads over time at three typical observation locations, indicated in (a).
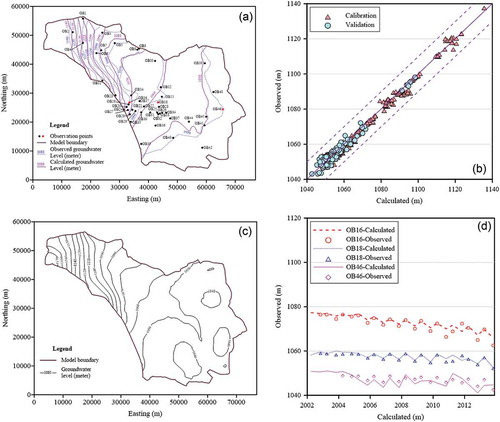
In the second step, based on the preliminary adjusted parameter distribution and boundary conditions, the initial hydraulic heads for the groundwater transient model from 2000 to 2013 were based on the simulation results from the steady-state model prior to 1999. Then the transient model was calibrated according to the groundwater levels at the observation wells distributed throughout the model region ()) between 2000 and 2010, while the observed heads in the period 2011–2012 were used in the validation process. A quantitative comparison between observed heads and calculated heads at all monitoring wells and for all observation times is illustrated in )). The transient model was validated satisfactorily with the value of R2 up to 0.988. It is clear that no significant bias appears in the comparison results. For all of the 46 observation wells ()) in the validation period, the values of the ME and MAE were statistically −0.127 m and 1.369 m, respectively. The calculated groundwater heads match well with the observation data, with RMSE equal to 1.94 m. The calculated and observed groundwater heads are matched at three typical observation locations, as shown in )), which indicates that the model is calibrated and validated very well over a long period of time. Accordingly, the numerical model appears to be a robust simulator to delineate the groundwater dynamics in the study area.
3.4 Sensitivity analysis
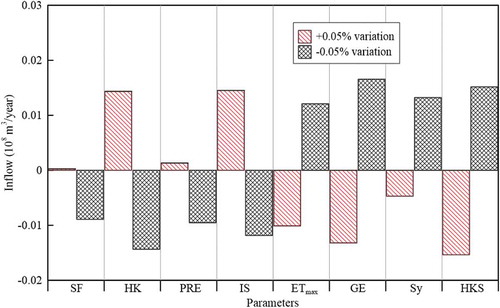
The main parameters in the model include specified flux (SF), horizontal hydraulic conductivity (HK), precipitation (PRE), irrigation seepage (IS), maximum ET rate (ETmax), groundwater exploitation (GE), specific yield (Sy), and hydraulic conductivity of the stream bed (HKS). Considering the uncertainty of the model and the effect of these parameters on the runoff into Bosten Lake, sensitivity analyses were conducted to test the influence of the all the factors on the flows into Bosten Lake. Here the inflow of Bosten Lake in 2013 was chosen to estimate the sensitivity. All parameters were set to increase or decrease 5% of the value to conduct the sensitivity.
4 Results and discussion
4.1 Groundwater budget analysis
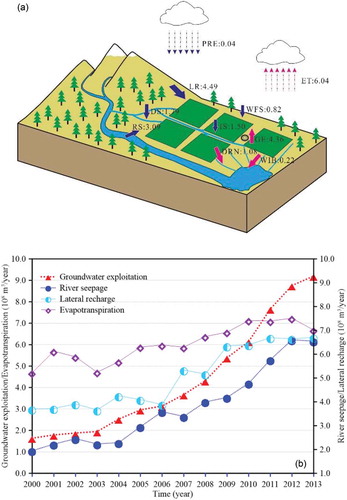
It is essential to analyse the regional groundwater budget to understand water supply and water consumption in the MEYB during the model simulation periods. From the model results, the annual average inflow and outflow in the entire MEYB from 2000 to 2013 are illustrated in ). The main components of the inflow terms of the groundwater budget include precipitation (PRE), irrigation seepage (IS), diversion system seepage (DS), lateral recharge (LR), water quantity from storage (WFS), and river seepage (RS); while the outflow terms include drainage (DRN), evapotranspiration (ET), the water flow into Bosten Lake (WIB) and groundwater exploitation (GE). presents all the water budget components in the groundwater flow model. In general, the main components of inflow are the LR and RS, which make up 64.58% of the total inflow. Specifically, 38.22% of inflow comes from LR and 26.36% from RS. This means LR and RS could significantly affect the total inflow and the water budget. For the outflow, the water amount leaving the MEYB, 51.64% of the total amount is through ET and 37.26% is through GE. According to the groundwater budget, an obvious deficit appears (see ) where the ET is much greater than the PRE, implying that in the MEYB the climate affects the groundwater system mainly through ET rather than PRE. Furthermore, there is an increasing trend in the water pumping quantity from storage (WFS), so storage is declining, which indicates that there is unsustainable groundwater exploitation in the MEYB. The groundwater pumping amount follows an annual cycle, which increases during the crop irrigation period and decreases at other times. It is noteworthy that after 2005 the aquifer storage decreased at a faster rate due to the increased pumping rate. ) shows the changes in the main components of inflow and outflow in the groundwater budget over time. It can be seen that LR, RS and GE increase continuously from 2000 to 2013. Increasing GE leads to more water from the river flowing into the aquifer (i.e. an increase in RS). Also, increasing GE results in quickening the velocity of groundwater flow normal to the lateral boundary, eventually representing the increase in LR.
Table 2. Overall water budget of the simulation period 2000–2013 (108 m3/year). PRE: precipitation; IS: irrigation seepage; DS: diversion system seepage; LR: lateral recharge; WFS: water quantity from storage; RS: river seepage; DRN: drainage; ET: evapotranspiration; WIB: water flow into Bosten Lake; GE: groundwater exploitation.
Figure 8. (a) Annual mean groundwater budget for MEYB (108 m3/year); and (b) variation of the main components of inflow and outflow in the groundwater budget.
Correlations calculated using Equation (9) between all components of the groundwater budget are listed in . There are several highly positive correlations (R > 0.9) between RS–LR, DRN–LR, GE–LR and RS–GE. These highly positive correlations imply that the RS is mainly related to LR and GE, while LR is slightly increasing due to groundwater exploitation (GE). Due to the increased groundwater pumping rate in the study region, the hydraulic connection between river and aquifer system has been changed so that more and more surface water leaks into the groundwater system across the interface along the river bank. Therefore, it can be concluded that the increasing trend of RS absolutely occurs due to the intensive groundwater exploitation in the MEYB.
Table 3. Coefficients of correlation (R) between all components in the groundwater budget. See for explanation of abbreviations. Bold values indicate highly positive correlations (R > 0.9).
Considering the water scarcity in the arid region, the sustainable exploitation and protection of groundwater in the MEYB is especially important. ) shows the spatial distribution of hydraulic head in 2013 based on the calibrated groundwater flow model. Compared with head contours in )), some cones of depression occurred in the eastern area of the MEYB due to increasing groundwater exploitation. The groundwater within 2 km of the river bank is obviously recharged by surface water in the lower reaches of the Kaidu River.
The previous analysis and discussion reveal that, in this study area, the dynamic flow system has varied significantly since 1999 in response to groundwater exploitation and interactions between surface water and groundwater. Due to the dry climate in the MEYB, the amount of recharge from PR is very limited and even negligible. The ET is the dominant outflow, although it only increased slightly from 1999 to 2013. As shown in , the modelling results clearly indicate that the current utilization of the groundwater resources in the MEYB is unsustainable, as intensive pumping makes the RS increase dramatically, leading to a decrease in the runoff from the Kaidu River into Bosten Lake. Due to intensive pumping activities without effective supervision in the whole study region, the water resource shortage will become more serious in the future, causing harm to the environment of Bosten Lake. The salinity of Bosten Lake will keep increasing, having a more serious effect on the water supply source of the Tarim lower reaches, which will produce adverse impacts on the ecological environment in the Tarim basin and make the development of society and the economy unsustainable.
The water budget analysis results indicate that more attention should be paid to sustainable water management in the MEYB. To achieve sustainable development in the MEYB, it is necessary to consider many factors related to the water budget. The ET is the most important consumption of groundwater, so efficient reduction of ET might be the most feasible approach for dealing with water scarcity in the MEYB. Meanwhile, in this arid area of the MEYB, surface water and groundwater exchange frequently, so the groundwater is easily influenced by water use and hydrological conditions. It is shown that pumping water takes up about 37.26% of the total outflow from the groundwater system and has become the main reason for the groundwater resource decrease and river seepage increase in the MEYB, so pumping rates and well locations are the two most important factors that need to be optimized in the entire MEYB.
4.2 Interactions between surface water and groundwater
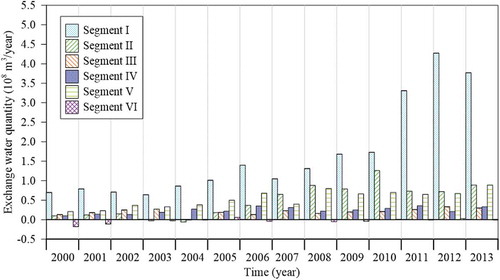
Surface water interacts with groundwater based on their hydraulic connections. To evaluate river seepage in detail, the whole river channel of the Kaidu and Wulasitai rivers in the study region was divided into six different segments (see )), as simulated by the SFR2 package (Niswonger and Prudic Citation2005) of MODFLOW-NWT. The individual net seepages along the six river segments during the simulation period 2000–2013 are shown in and . During the entire simulation period, the river loses its surface water along Segments I–V, while it mainly gains its recharge from the aquifer along Segment VI between 2000 and 2009. In general, the total average leakage of the Kaidu River is 3.12 × 10⁸ m3/year, most of which is through Segment I, taking up to 53.19% of the total leakage. further illustrates the intensively increased river leakage mainly in Segment I. Compared with other segments (see ), Segment I plays the most important role in the interaction between surface water and groundwater in the study region. However, the tendency of the seepage in Segment I to increase indicates that the water exchange is unsustainable. As may be seen in and , groundwater exploitation has the same variation trend as river seepage in Segment I, which implies that groundwater exploitation leads to the river seepage increase in Segment I.
Table 4. Interaction between different river segments and groundwater system. A positive value represents the aquifer gaining water from the river; and a negative value represents the aquifer losing water to the river.
Figure 9. Variation in leakage for different river segments over time (2000–2013). Positive values represent the aquifer gaining water from the river and negative values represent the aquifer losing water to the river.
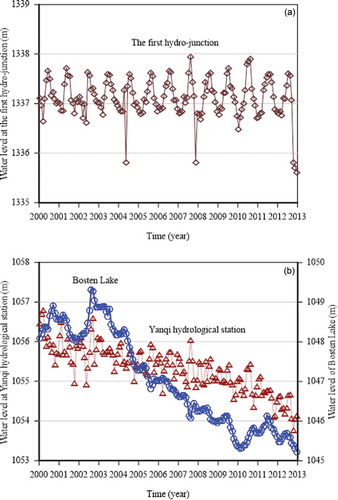
The water levels in the first hydro-junction, Yanqi hydrological station and Bosten Lake during the observation period are shown in . The river level in the first hydro-junction remains nearly unchanged with the same degree of yearly fluctuation, while that in the Yanqi hydrological station decreases continuously. According to the interactions between different segments and groundwater systems shown in and , it can be inferred that increasing seepage in Segments I and II led to the decrease of the river level in Yanqi station. Consequently, increasing seepage in Segments I–V makes the water level of Bosten Lake decline.
Figure 10. Changing water levels observed at the first hydro-junction (top), and in Yanqi hydrological station and Bosten Lake (bottom).
The SFR2 package uses the recharge and discharge of all water items for a river segment and computes flow across the riverbed based on stream depth calculated at the midpoint of a reach. All recharge and discharge items and runoff in the Yanqi hydrological station and Baolangsumu hydro-junction are calculated using the SFR2 package. The flow rates into Bosten Lake can be obtained directly using the SFR2 package. The hydrographs for Yanqi hydrological station and Baolangsumu hydro-junction on the Kaidu River are illustrated in , with the measured runoff also plotted for comparison purposes. The performance criteria for evaluating the difference between the computed results and the measurements are listed in . For example, compared with actual observed runoff in Yanqi hydrological station ()), average relative error (RE) between the observed and calculated runoff is 15.92%, less than the upper limit of 20% required by the standard for hydrological information and hydrological forecasting (GB/T 22,482–2008 Citation2008), which indicates this is an acceptable result. The calculation errors for Baolangsumu hydro-junction are much smaller than those for Yanqi hydrological station: the qualification rate (QR) of the calculated runoff at Yanqi is 0.667, while that for Baolangsumu hydro-junction is up to 0.833 (). This result shows that calculation results for runoff at Yanqi hydrological station and Baolangsumu hydro-junction are both accurate.
Table 5. Error analysis of the calculated runoff. RE: relative error; ME: mean error; MAE: mean absolute error; RMSE: root mean square error; E: Nash-Sutcliffe efficiency; R: correlation coefficient; QR: qualification rate.
Figure 11. Comparison of observed and computed runoff of Kaidu River at (a) Yanqi hydrological station and (b) Baolangsumu hydro-junction.
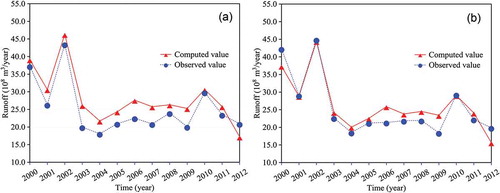
The high-level agreement between the calculated and measured runoff over time for both Yanqi hydrological station and Baolangsumu hydro-junction shows the feasibility and applicability of the methodology used in this study to evaluate the interactions between surface water and groundwater. Based on the analysis of river seepage () and water balance from the SFR2 package, the flow rates of the Kaidu River (Segments I–V) to Bosten Lake are illustrated in . Thus a declining trend is the common feature of the runoff at Yanqi hydrological station and Baolangsumu hydro-junction () and the flow rates into Bosten Lake (). Specifically, after 2010, the flow rates into Bosten Lake were decreasing with a faster declining trend. Again, taking the groundwater budget (see and ) and the river seepage analysis ( and ) into consideration, it is obvious that intensively increasing groundwater exploitation and river seepage has caused the steady decrease of flow rates into Bosten Lake. This indicates that groundwater exploitation plays the most important role in the water level decline of Bosten Lake, implying that the current utilization of the groundwater resources in the MEYB is unsustainable.
Figure 12. Flow rates from Kaidu River to Bosten Lake in the period 2000–2013.
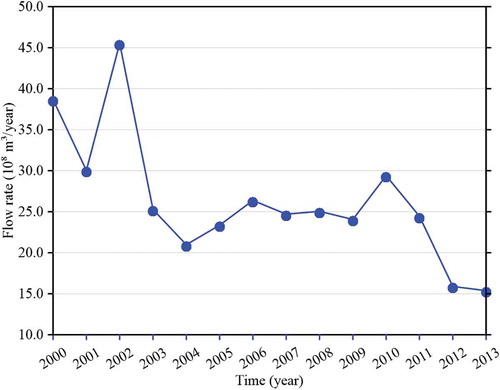
Figure 13. Sensitivity analyses of inflow to Bosten Lake with respect to different model input parameters.
4.3 Uncertainty analysis and some countermeasures
The results of sensitivity analyses are listed in and illustrated in . From the results one can tell that the hydraulic conductivity of the stream bed is horizontal, which means that the aquifer parameters have the most obvious effects on the inflow of Bosten Lake. Besides, human activities in the study region also influence the flow rates into Bosten Lake significantly. Thus the inflow into Bosten Lake is very sensitive to groundwater exploitation and irrigation infiltration, indicating that increasing these activities will affect the river seepage and play a key role in reducing the inflow into Bosten Lake, which has decreased from 38.68 × 10⁸ m3 in 2000 to 15.37 × 10⁸ m3 in 2013 ().
Table 6. Results of the parameter sensitivity analysis. SF: specified flux; HK: horizontal hydraulic conductivity; PRE: precipitation; IS: irrigation seepage; ETmax: maximum ET rate; GE: groundwater exploitation; Sy: specific yield; HKS: hydraulic conductivity of stream bed. The ranking of sensitivity is relative: 1 indicates the highest sensitivity and 8 the lowest sensitivity.
Analysis of the water balance for the whole channel of the Kaidu River ( and ) indicates that the annual water leakage mostly occurs in Segment I of the river and this has is increased from 0.70 × 10⁸ m3 in 2000 to 3.77 × 10⁸ m3 in 2013. Therefore, it is necessary to reduce the river seepage of Segment I to protect the water supply and environment of Bosten Lake and the Tarim lower reaches. As the main cause for the river seepage increase, groundwater exploitation reached 9.20 × 10⁸ m3/year in 2013 (), which indicates a rise of 460% in 14 years. The pumping rate of groundwater exploitation and the well locations in the field are the two most important factors that need to be optimized to reduce the river seepage for the entire MEYB. In addition, in allusion to the large amount of evapotranspiration, with a high value of 6.68 × 10⁸ m3/year in 2013 (), some measures to protect and improve the regional environment, such as adopting water-saving technologies, changing the crop rotation type, adjusting irrigation and surface water diversion schemes, would be beneficial for relieving the pressure of water shortage in the MEYB and increasing the inflows into Bosten Lake.
5 Conclusions
The Mid-Eastern Yanqi Basin (MEYB) is a typical arid inland basin in Northwestern China, an important location in the Silk Road Economic Belt, where the interaction between surface water and groundwater is greatly changed by groundwater overexploitation. Groundwater and surface water measurement data and a developed flow model based on MODFLOW-NWT have provided valuable insight into the interaction between surface water and groundwater in the basin. The developed model, at the regional spatial scale and long temporal scale, is a useful method for the exploration of sustainable groundwater–surface water resources in the MEYB. According to the results of the calibrated groundwater flow model, groundwater levels have declined significantly in some areas and formed hydraulic depression cones between 2000 and 2013. After 2005 the aquifer storage decreased at a faster rate due to increased groundwater pumping, implying unsustainable groundwater overexploitation in some local areas. Strong positive correlations (>0.9) were obtained between: river seepage and lateral recharge (RS–LR), drainage and lateral recharge (DRN–LR), groundwater exploitation and lateral recharge (GE–LR) and river seepage and groundwater exploitation (RS–GE). Besides, the variations in groundwater exploitation and river seepage have the same trends, which suggests that the river seepage increases to compensate for the deficit in water resources caused by groundwater exploitation.
To evaluate river seepage in different parts of the MEYB, both the Kaidu and Wulasitai rivers in the study region were divided into six segments ()) and the water balance was calculated directly using the SFR2 package. The calculated runoff amounts in Yanqi hydrological station and Baolangsumu hydro-junction were well qualified against the actual runoff measurements. As shown in and , the entire river seepage increased from 1.05 × 10⁸ m3/year in 2000 to 6.17 × 10⁸ m3/year in 2013, with the increased river leakage occurring mainly in Segment I. Furthermore, the calculated runoff rates in Yanqi hydrological station and Baolangsumu hydro-junction are also well matched with the measured values. Declining trends may be seen for runoff at Yanqi hydrological station ()) and Baolangsumu hydro-junction ()), and the runoff into Bosten Lake (). Based on the water budget in the whole region, it is apparent that groundwater overexploitation and river seepage have led to the steady decreasing trend for the runoff into Bosten Lake, indicating groundwater exploitation is the key factor for the water level decline of Bosten Lake.
Both water budget analyses of the groundwater flow model and the water balance for different Kaidu River segments suggest that the current utilization of the groundwater resources in the MEYB is unsustainable. For the groundwater system, evapotranspiration is an important water consumer, so it is direct and feasible to find approaches to reduce ET in the MEYB to alleviate the problem of water scarcity. With over 53% of the average total seepage of the Kaidu River (3.12 × 10⁸ m3/year) being from Segment I, a reduction in the river seepage at this segment is very important and will be a practical way to protect the water supply and environment of Bosten Lake and the Tarim lower reaches. Among the measures that can be taken to prevent groundwater exploitation in the MEYB, the pumping rate and locations of well fields are the two most important factors to be optimized in the entire MEYB to reduce the river seepage. Sensitivity analysis also indicates that human activities such as groundwater exploitation and agricultural irrigation greatly affect the runoff of the Kaidu River into Bosten Lake, which suggests the major factor for water-level depletion is groundwater and surface water exploitation. To make water consumption in agriculture more efficient, it is necessary to adopt water-saving technologies, change the crop rotation type, adjust irrigation and implement surface water diversion schemes to improve efficiency of water use. Combining all four strategies may be the most effective method to solve the water resources shortage and environmental problems in the MEYB. These management strategies are essential for solving problems and improving sustainable development in the MEYB. Simultaneously, they are also valuable and effective approaches for developing sustainable management strategies for water resources in other hotspots with depletion of the groundwater−surface water resource. The regional-scale and long time-scale model is very important for studying the interactions between groundwater and surface water systems.
Acknowledgements
The authors appreciate the support from the Nanjing Hydraulic Research Institute and Xinjiang Tarim River Basin Management Bureau, Xinjiang Uyghur Autonomous Region of China. The numerical calculations in this paper were implemented on the IBM Blade cluster system in the High Performance Computing Center of Nanjing University. The authors have benefited from communications with Dr Xiaoqing Shi and Dr Xing Min in establishing numerical modelling. The authors are also profoundly grateful to the Co-editor Professor Demetris Koutsoyiannis, Associate Editor Dr Tomasz Okruszko, and the anonymous reviewer whose invaluable suggestions and constructive comments helped to improve the manuscript significantly.
Disclosure statement
No potential conflict of interest was reported by the authors.
Additional information
Funding
References
- Aishan, T., et al., 2013. Monitoring the hydrological and ecological response to water diversion in the lower reaches of the Tarim River, Northwest China. Quaternary International, 311, 155–162. doi:10.1016/j.quaint.2013.08.006
- Ajami, H., et al., 2011. Impact of land-surface elevation and riparian evapotranspiration seasonality on groundwater budget in MODFLOW models. Hydrogeology Journal, 19, 1181–1188. doi:10.1007/s10040-011-0743-0
- Al-Assa’d, T.A. and Abdulla, F.A., 2010. Artificial groundwater recharge to a semi-arid basin: case study of Mujib aquifer, Jordan. Environmental Earth Sciences, 60, 845–859. doi:10.1007/s12665-009-0222-2
- Bailey, R.T., et al., 2016. Assessing regional-scale spatio-temporal patterns of groundwater-surfaces water interactions using a coupled SWAT-MODFLOW model. Hydrological Processes, 30, 4420–4433. doi:10.1002/hyp.10933
- Chen, Y.N., et al., 2013. Progress, challenges and prospects of eco-hydrological studies in the Tarim River Basin of Xinjiang, China. Environmental Management, 51, 138–153. doi:10.1007/s00267-012-9823-8
- Cravotta III, C.A., et al., 2014. Surface water and groundwater interactions in an extensively mined watershed, upper Schuylkill River, Pennsylvania, USA. Hydrological Processes, 28, 3574–3601. doi:10.1002/hyp.9885
- Du, J.L., 2009. Coupled Modeling and controlling of water and salt transport in the unsaturated-saturated zone in an arid salinization region – A case study in Yanqi Basin of Xinjiang, China. Thesis (PhD). China University of Geosciences.
- Elsawwaf, M., et al., 2014. Groundwater-surface water interaction in Lake Nasser, Southern Egypt. Hydrological Processes, 28, 414–430. doi:10.1002/hyp.9563
- Garambois, P.A., et al., 2015. Characterization of catchment behavior and rainfall selection for flash flood hydrological model calibration: catchments of the eastern Pyrenees. Hydrological Sciences Journal, 60 (3), 424–447. doi:10.1080/02626667.2014.909596
- Glazer, A.N. and Likens, G.E., 2012. The water table: the shifting foundation of life on land. AMBIO, 41, 657–669. doi:10.1007/s13280-012-0328-8
- Gleeson, T., et al., 2010. Groundwater sustainability strategies. Nature Geoscience, 6 (3), 378–379. doi:10.1038/ngeo881
- Guay, C., et al., 2013. Comparison of two modeling approaches for groundwater-surface water interactions. Hydrological Processes, 27, 2258–2270. doi:10.1002/hyp.9323
- Haria, A.H., et al., 2013. Spatial delineation of groundwater-surface water interactions through intensive in-stream profiling. Hydrological Processes, 27, 628–634. doi:10.1002/hyp.9551
- Hassan, S.M.T., et al., 2014. Surface-groundwater interactions in hard rocks in Sardon catchment of western Spain: an integrated modeling approach. Journal of Hydrology, 517, 390–410. doi:10.1016/j.jhydrol.2014.05.026
- Hyndman, R.J. and Koehler, A.B., 2006. Another look at measures of forecast accuracy. International Journal of Forecasting, 22, 679–688. doi:10.1016/j.ljforecast.2006.03.001
- Krause, P., Boyle, D.P., and Base, F., 2005. Comparison of different efficiency criteria for hydrological model assessment. Advances in Geosciences, 5, 87–89. doi:10.5194/adgeo-5-89-2005
- Lamontagne, S., et al., 2014. Field assessment of surface water-groundwater connectivity in a semi-arid river basin (Murray-Darling, Australia). Hydrological Processes, 28, 1561–1572. doi:10.1002/hyp.9691
- Leake, S.A. and Lilly, M.R., 1997. Documentation of a computer program (FHB1) for assignment of transient specified-flow and specified-head boundaries in applications of the Modular Finite-Difference Ground-Water Flow Model (MODFLOW). Tucson, AZ: US Geological Survey, US Geological Survey Open-File Report 97-571.
- Lemann, E.L. and Casella, G., 1998. Theory of point estimation. 2nd. New York: Springer.
- Liu, Y.F., 2004. Interactions between surface water and groundwater and sustainable utilization of water resources in Yanqi Basin, Xinjiang, P.R. China. Thesis (PhD). China University of Geosciences.
- Marco, D., Edio, M., and Alfio, Q., 2002. Mathematical and numerical models for coupling surface and groundwater flows. Applied Numerical Mathematics, 43, 57–74. doi:10.1016/S0168-9274(02)00125-3
- Matula, S., et al., 2014. Simulations of groundwater-surface water interaction and particle movement due to the effect of weir construction in the sub-watershed of the river Labe in the town of Děčín. Environmental Monitoring and Assessment, 186, 7755–7770. doi:10.1007/s10661-014-3964-6
- McCallum, A.M., et al., 2012. A 1-D analytical method for estimating surface water-groundwater interactions and effective thermal diffusivity using temperature time series. Water Resources Research, 48, W11532. doi:10.1029/2012WR012007
- Merritt, M.L. and Konikow, L.F., 2000. Documentation of a computer program to simulate lake-aquifer interaction using the MODFLOW ground-water flow model and the MOC3D solute-transport model. Reston, VA: US Geological Survey, US Geological Survey Open-File Report 00-4167.
- Niswonger, R.G., et al., 2006. Documentation of the Unsaturated-Zone Flow (UZF1) package for modeling unsaturated flow between the land surface and the water table with MODFLOW-2005. Reston, VA: US Geological Survey, US Geological Survey Techniques and Methods 6-A19.
- Niswonger, R.G., et al., 2011. MODFLOW-NWT, A Newton Formulation for MODFLOW-2005. Reston, VA: US Geological Survey, US Geological Survey Techniques and Methods 6-A37.
- Niswonger, R.G. and Prudic, D.E., 2005. Documentation of the Streamflow-Routing (SFR2) Package to include unsaturated flow beneath streams-A modification to SFR1. Reston, VA: USGS, US Geological Survey Techniques and Methods, Book 6, Chap. A13.
- Ouyang, Z.P., 2008. Numerical simulation and movement regularity of soil water and salt in typical experimentation area of Yanqi Basin, Xinjiang. Master Thesis. China University of Geosciences.
- Oyarzún, R., et al., 2014. Use of 222radon as a simple tool for surface water–groundwater connectivity assessment: a case study in the arid Limari Basin, north-central Chile. Water and Environment Journal, 28, 418–422. doi:10.1111/wej.12057
- Pang, Z.H., Huang, T.M., and Chen, Y.N., 2010. Diminished groundwater recharge and circulation relative to degrading riparian vegetation in the middle Tarim River, Xinjiang Uygur, Western China. Hydrological Processes, 24, 147–159. doi:10.1002/hyp.7438
- Qian, Y.B., et al. 2006. Exploitation of water and land resources and its ecoenvironment issues in Xinjiang of China in resent 50a. Journal of Arid Land Resources and Environment, 20 (3), 58–63. [In Chinese with English abstract].
- Sawyer, A.H., et al., 2013. Dynamic response of surface water-groundwater exchange to currents, tides, and waves in a shallow estuary. Journal of Geophysical Research: Oceans, 118, 1749–1758. doi:10.1002/jgrc.20154
- SBTSC (State Bureau of Technical Supervision of China), 2008. Standard for hydrological information and hydrological forecasting. GB_T 22482-2008. China: SBTSC.
- Sulis, M., et al., 2012. Hydrologic response to multimodel climate output using a physically based model of groundwater/surface water interactions. Water Resources Research, 48, W12510. doi:10.1029/2012WR012304
- Tao, J.H., 2012. Coupled modeling of surface water and groundwater in Shayinghe River basin. Master Thesis. Hefei University of Technology.
- Unland, N.P., et al., 2013. Investigating the spatio-temporal variability in groundwater and surface water interactions: a multi-technique approach. Hydrology and Earth System Sciences, 17, 3437–3453. doi:10.5194/hess-17-3437-2013
- Wang, G.X., et al., 2007. Effects of land-use changes on hydrological processes in the middle basin of the Heihe River, northwest China. Hydrological Processes, 21, 1370–1382. doi:10.1002/hyp.6308
- Wang, J.L., 2004. The relationship of transformation between the surface water and groundwater in Yanqi Basin. Master Thesis. School of Environmental Studies, China University of Geosciences. doi:10.1007/s00726-003-0001-4
- Wang, N.L., et al., 2009. Tracing the major source area of the mountainous runoff generation of the Heihe River in northwest China using stable isotope technique. Chinese Science Bulletin, 54, 2751–2757. doi:10.1007/s11434-009-0505-8
- Wang, S.X., 2005. Study on soil water and salt numerical simulation in typical experimentation area of Yanqi Basin. Master Thesis. Xinjiang Agricultural University.
- Wang, S.X., 2013. Groundwater quality and its suitability for drinking and agricultural use in the Yanqi Basin of Xinjiang Province, Northwest China. Environmental Monitoring Assessment, 185, 7469–7484. doi:10.1007/s10661-013-3113-7
- Wang, S.X., 2014. Hydrochemical and isotopic characteristics of groundwater in the Yanqi Basin of Xinjiang province, northwest China. Environmental Earth Sciences, 71, 427–440. doi:10.1007/s12665-013-2450-8
- Wang, Y., Chen, Y.N., and Li, W.H., 2014. Temporal and spatial variation of water stable isotopes (18O and 2H) in the Kaidu River basin, Northwestern China. Hydrological Processes, 28, 653–661. doi:10.1002/hyp.9622
- Yao, Y.Y., et al., 2014. Conceptual and numerical models for groundwater flow in an arid inland river basin. Hydrological Processes, 29, 1480–1492. doi:10.1002/hyp.10276
- Ye, Z.X., et al., 2009. Groundwater fluctuations induced by ecological water conveyance in the lower Tarim River, Xinjiang, China. Journal of Arid Environments, 73, 726–732. doi:10.1016/j.jaridenv.2009.01.016
- Zhong, R.S., 2008. Research and practical application on distributed 3D water-salt transport model in arid oasis area. Thesis (PhD). Xinjiang Agricultural University.
- Zuo, D.P., et al., 2015. Response of runoff to climate change in the Wei River basin, China. Hydrological Sciences Journal, 60 (3), 508–522. doi:10.1080/0262667.2014.943668