
ABSTRACT
The objectives of this research were to evaluate the effect of land-use change on streamflow, sediment and water quality data along the Lower Yom River, Thailand, covering an intensively agricultural area of 14 613.6 km2, and to assess the relative impact of point and non-point sources of pollution from multiple-land-use watersheds. Long-term calibration and validation of the SWAT (Soil and Water Assessment Tool) model was performed on data for 2000–2013. Land-use change led to a 13–49% increase in runoff in the basin and resulted in 37–427% increased sediment yield. The amount of NO3-N load doubled in the upper and middle parts of the study area, while the increase in PO43– ranged from 37 to 377%, reflecting the increase in agricultural lands and urban areas. It is concluded that the changed land use is closely associated with the quantity of runoff, sediment yield and the NO3-N and PO43– concentrations.
Editor A. Castellarin; Associate editor X. Fang
1 Introduction
Land-use/land-cover (LULC) change is one of the main contributing factors, affecting discharge and water quality in watersheds, due to anthropogenic activities, for example, increasing population and urbanization, encroachment of forests by agriculture and urban areas, and the degradation of forest resources (Konkul et al. Citation2014, Waiyasusri et al. Citation2016). This can result in a decrease in infiltration and, in turn, an increase in the rate and volume of surface runoff (Chotpantarat and Chanyotha Citation2003, Fitzpatrick Citation2005, Klongvessa et al. Citation2017), as well as having a negative impact on water quality, which is a major concern in terms of drinkable water supplies (Buda and DeWalle Citation2009, Oeurng et al. Citation2010). Nitrogen (N) and phosphorus (P) are nutrients that are often the limiting factors in plant growth. Thus, they are heavily applied as fertilizer on agricultural land, but significant other sources include wastewater treatment effluent, animal waste, antiseptics and detergents. Agricultural activities are an important source of these nutrients (Yang et al. Citation2008). When nitrate (NO3–) and phosphate (PO43–) flow into water sources, the elevated levels of these nutrients can cause accelerated eutrophication or enrichment of the waters that, in turn, stimulates the growth of algae and changes the ecology of the stream as the algal populations increase (Bhavya et al. Citation2016). This is a serious problem that can have many negative impacts on aquatic systems and the use of water for different purposes, such as fishing, industry and farming, and especially for drinking (Caldy Citation2004, Maier et al. Citation2009). Along with potassium, NO3-N and PO43– are the common components of multi-nutrient fertilizers, where, for example, a fertilizer grade of 16–16–16 contains (by weight) 16% nitrogen, 16% PO43–, and 16% potassium. Contamination of groundwater and rivers with NO3-N and PO43– from applied fertilizers, or runoff from animal feed, is ubiquitous in agricultural regions (Chotpantarat et al. Citation2011, Liljeström et al. Citation2012, Boithias et al. Citation2014, Li and Bush Citation2015, Liu et al. Citation2017). Inappropriate management of sewage treatment plants and septic frameworks are other significant sources through which effluent is released into waterways. Furthermore, PO43– comes from residential sewage (especially from clothing cleansers). The national drinking standard in the USA for NO3-N is ≤ 10 ppm, but a NO3-N level of only 1 ppm is sufficient to cause algal blooms (Boeykens et al. Citation2017). The desired maximum total phosphorus level of the US Environmental Protection Agency (EPA) for streams entering lakes and for other flowing water bodies was 0.05 and 0.10 ppm, respectively (Borah and Bera Citation2004). An amount of 0.02 ppm of phosphorus has appeared to affect algal growth in lakes (Sharpley et al. Citation1987).
The SWAT (Soil and Water Assessment Tool) model, developed by the Blackland Research Center in Texas, USA, is a river basin model that includes physical, biogeochemical and hydrochemical processes, and combines components of a physical and conceptual semi-empirical nature (Neitsch et al. Citation2005a). Therefore, it can be capable of quantifying and simulating the impact of land-use change on water flow, sediment flux and nutrient loadings in a river basin (Arnold et al. Citation1999, Krysanova et al. Citation2005). Worldwide studies have been done using the SWAT model, and it has been applied to watershed-scale projects in different parts of the world such as the USA, Europe (e.g. Arnold et al. Citation2012, Mbonimpa et al. Citation2012, Jha and Gassman Citation2014, Havrylenko et al. Citation2016), China (Hao et al. Citation2004), India (Kaur et al. Citation2004), Australia (Sun and Cornish Citation2006), Africa (Schuol and Abbaspour Citation2006) and Southeast Asia (Oeurng et al. Citation2016, Shrestha et al. Citation2016). Results have shown that the SWAT model is capable of assessing streamflow and sediment loads of a river basin with satisfactory accuracy. Several researchers (e.g. Cui et al. Citation2015, Andriamananjara et al. Citation2016) have performed hydrological SWAT modelling to evaluate the impact of land-use changes, including agricultural management, on the amount of NO3-N that affects the water quality of rivers: for example, at the Jajrood River watershed, Iran (Jamshidi and Tajrishy Citation2010), the Hii River Basin, Japan (Takeda Citation2012), and in the northeast of China (Ouyang et al. Citation2017). Therefore, the SWAT model is considered to be a suitable tool for evaluating the impact of land-use change on nitrate and phosphate levels in surface waters. The results from the SWAT modelling can provide useful information for preventing non-point source (NPS) pollution in terms of land-use management within those regions. Moreover, in recent years, the effects of climate change have been taken into account together with the effects of land-use changes by using SWAT modelling to explain hydrological processes (Eugenio et al. Citation2014, El-Khoury et al. Citation2015, Krysanova and White Citation2015). However, as mentioned above, most of the research focused on the effects of streamflow and only some focused on nutrient loads, and these were carried out in small- to medium-scale watersheds. Only a few studies have applied the SWAT model to assess the impact of land-use changes on water flow, sediment load and water quality in a large, intensively agricultural river basin, especially in tropical areas. Therefore, in a large and intensively agricultural area, the assessment of such impacts needs to use the appropriate hydrological model to assess the gradual changes in terms of water quantity and quality and, moreover, it needs to use distributed monitoring stations with long-term recording data.
Interestingly, during the past few decades, land use in the Yom River Basin, Thailand, covering an area of approx. 23 948 km2, has been gradually changing from mainly forest land to mostly agricultural land (paddy fields, field crops and perennial crops), especially in the lower part of the basin (area: 1359 km2), followed by urban and developed land (approx. 310 km2) (Kitichuchairit Citation2013). To bridge the gap in the previous research, the current study applied a SWAT model to assess the effect of land-use change on the streamflow and sediment, including nitrate and phosphate, in the Lower Yom River, one of the largest drainage areas in Thailand with distributed and long-term monitoring data (13 years of recorded data). The main objective of this research was to assess the effects of land-use changes on streamflow, sediment transport, and the NO3-N and PO43– concentrations discharging along the Lower Yom River over a long period of time (2000–2013). The SWAT model was used to investigate the influence of spatial and temporal changes in the intensive agricultural catchment in terms of point and non-point sources, such as urbanization and agricultural activities.
2 Materials and methods
2.1 Study area
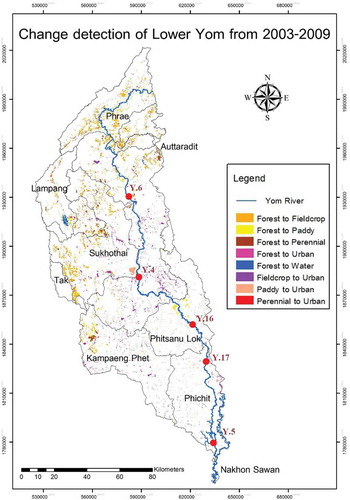
The study was focused on the lower part of the Yom River Basin (), which is located in the northern part of Thailand, covering the seven provinces of Phrae, Sukhothai, Uttaradit, Phitsanulok, Kamphaeng, Phichit and Nakhon Sawan. The lower part of the Yom River and its tributaries drain a total area of 14 613.7 km2, about 60.8% of the Yom River Basin (Hydro and Agro Informatics Institute Citation2012). The river is approximately 420 km long and the people living along it are mainly farmers (RID [The Royal Irrigation Department] Citation2008). The increased population in the area has led to a continuous deterioration of the river water quality, especially in the Lower Yom River. Recently, the situation has become worse due to increased runoff from various agricultural activities and wastewater discharged from urban areas and industries.
Figure 1. Lower Yom River Basin showing the 14 water sampling points.

Moreover, in the period May–October, when crops are grown and fertilizer is applied, between three and five typhoons strike Thailand, influencing an episodic runoff in the Lower Yom River Basin, resulting in a large amount of erosion and nutrient load to the catchment system. Furthermore, in this area, agriculture-associated land use is limited by government policy, with nutrient export contingent on the runoff and land use.
2.2 Analysis of nitrate-N and phosphate levels in the Yom River
The water quality of the surface water was ascertained from samples collected at 14 stations, as detailed in and .
Table 1. Location of surface water stations.
The samples were collected from these 14 stations (YO.01–09 and W01–05) in May (summer) and August (rainy season) during 2012 and 2013. The water samples were vertically collected at mid-depth at the centre of the width of the river and transferred into separate 1-litre HDPE plastic bottles and adjusted to pH < 2 with sulphuric acid. Samples were then stored for subsequent analysis of the NO3-N and PO43– contents. All samples were labelled with the station name, packed in foam boxes, and kept at 4°C to reduce bacterial, physical and chemical processes. The samples were then taken to the laboratory at the Department of Environmental Science, Chulalongkorn University, for further analysis. The Brucine method was employed for analysis of the NO3-N in the water samples according to the standards set out in the Standard Methods for the Examination of Water and Wastewater (APHA, AWWA, WEF Citation2005).
2.3 SWAT model description
The SWAT is a physical watershed model operating on a daily time step (Neitsch et al. Citation2005a). It depends on the topographical, geological, soil property, vegetative and input data of land management and uses both physical and empirical components to predict runoff, sediment and the chemical properties of agricultural yields from the impacts of land management practices in large watersheds over long periods of time (Neitsch et al. Citation2005b). The model inputs consist of the digital elevation model (DEM), soil type, land use, daily rainfall, maximum and minimum temperatures, relative humidity, radiation and wind speed, which allow users to monitor and assess the scenarios by using substitute input data such as weather, land-use activities and land cover. The SWAT model is separated into homogenous units referred to as hydrological response units (HRUs) according to the unique characteristics of the soil, land use and slope in each sub-watershed. The Soil Conservation Service curve number (CN) technique and daily rainfall are used for calculating the surface runoff volume. Moreover, the sediment yields from each sub-basin are simulated by using the Universal Soil Loss Equation (USLE; Williams and Berndt Citation1977). In addition, non-point source pollutants discharged into the streamflow are evaluated by calculating the surface flow, lateral flow and seeped water from 10 cm of the main layer of soil (Arnold et al. Citation1998).
2.4 Preparing input data for the SWAT model
The watershed was delineated into 29 HRUs, with the necessary data types and their data sources for the SWAT model set-up shown in ; the input map is shown in . The main database of the SWAT model was considered and applied mainly from the Mekong River Commission (MRC), which developed the soil database for SWAT modelling in the Mekong River Basin, and which could be applied as the Southeast Asian database, as mentioned in previous studies (Wangpimool et al. Citation2010, MRC [Mekong River Commission] Citation2010, Oeurng et al. Citation2016). Details of agricultural activities and the period of fertilizer application in the study area, as derived from the Office of Agricultural Economics, Thailand (2012), are given in Supplementary Material (Table S1).
Table 2. Data sources for the SWAT (Soil and Water Assessment Tool) model.
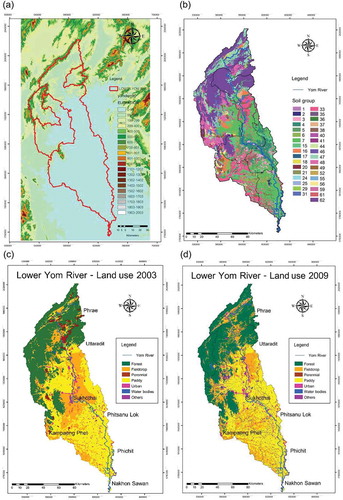
Figure 2. Spatial input maps for the SWAT model in the Lower Yom River showing (a) the digital elevation model (DEM), (b) soil groups, (c) land use in 2003, and (d) land use in 2009.
2.5 SWAT model calibration and validation
The SWAT display was adjusted by comparing the simulated water flow with the field-measured flow values from the observation stations of the watershed outlet. For the calibration process, the model was run with input parameters, and some parameters were gradually adjusted to get a good agreement. Afterwards, the model was validated without any adjusted parameters, which were set in the calibration process. All input data, such as land cover and soil type, were considered the same, except for the inputs of weather conditions (Heuvelmans et al. Citation2004).
The set of 13 years of monitoring data (2000–2013) for the observed flow obtained from the hydrological stations of the Royal Irrigation Department (RID), Thailand, was separated into three periods consisting of a calibration period and two validation periods. The SWAT model was first calibrated using the land-use map of 2009 with the observed flow data for the period 2006–2009. The first validation was carried out using the observed flow data for 2010–2013 (see )). Then, the land-use map of 2003 was used for validation of the observed flow data for the period 2000–2004.
Figure 3. Observation stations in the Lower Yom River Basin used for the SWAT model calibration and validation.
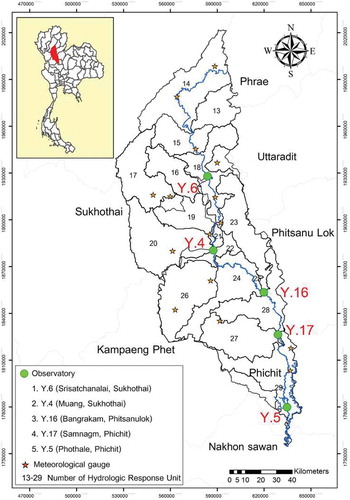
Figure 4. Calibration and validation periods of (a) streamflow, (b) sediment and (c) nitrate and phosphate.
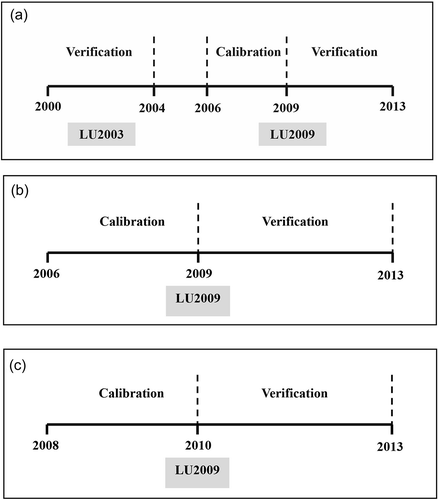
For the sediment transport, the SWAT model was calibrated and validated using the land-use map of 2009 with 7 years of observed sediment data (2006–2013), which were obtained from the RID ()). The observed sediment data for the period 2006–2009 were used for the calibration, whilst those for the period 2010–2013 were used for validation.
After finishing the hydrological and sediment calibration and validation, the SWAT model was calibrated using the land-use map for 2009 with the observed NO3-N and PO43– levels for the 2008–2010 period, which were obtained from the local environmental offices in the Lampang and Phitsanulok provinces. This was validated with the observed data for the period 2011–2013, including the observed results from this current study (see )). The details and location of the observation stations used for the model calibration and validation are shown in and and .
Table 3. Location of the hydrological observation stations used for the calibration and validation of flow, sediment yields and NO3− and PO43− levels.
The predicted discharge, sediment, and NO3-N and PO43– levels were statistically evaluated using the coefficient of determination (R2), which is used as an indicator of model performance for the calibration and validation periods. Models with higher R2 are presumed to perform better than those with a lower coefficient (Gikas et al. Citation2006). Additional parameters, such as those for the flow, sediment, and NO3-N and PO43– calibration and validation procedures are shown in .
3 Results and discussion
3.1 Water quality analysis
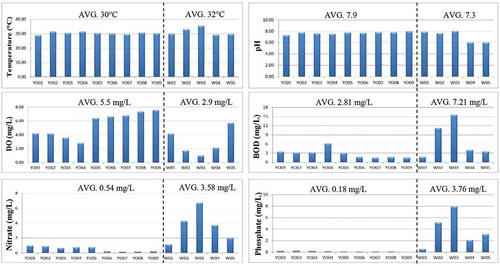
The water quality was determined from the surface water samples collected at 14 stations of the Lower Yom River over two years (2012 and 2013), as described in Section 2.2. The average water pH and temperature were 7.6 and 30.6°C, respectively, while the average dissolved oxygen (DO), biological oxygen demand (BOD), and NO3-N and PO43– concentrations were 5.10, 3.50, 1.02 and 0.74 mg L−1, respectively. The water quality for the Sawankalok district, Sukhothai province (station YO.07), and Wangching district, Phrae province (YO.09), was defined as good for use in fisheries, while river quality measured in the Mueang district, Sukhothai province stations (YO.06 and W03), was lower than the Thailand Surface Water Quality Standard and Classification: the ambient water quality standards established in 1994 that serve as guidelines for water based on major beneficial uses (Pollution Control Department Citation2000). The results of the water quality analysis for six parameters are shown in .
Figure 5. Analysis of water quality of the Lower Yom River Basin showing the average temperature, pH, dissolved oxygen (DO), biochemical oxygen demand (BOD), NO3-N and PO43− levels.
3.2 Parameter sensitivity analysis
Sensitivity analysis for the water flow was performed for nine hydrological parameters that have the potential to influence monthly water flow. The range of variation of these parameters was based on a listing provided in the SWAT manual (Neitsch and Sims Citation2002). Further analysis was then performed for the four most influential hydrological parameter – CN (curve number), SOL_AWC (available soil water capacity), GWQMN (threshold depth of the water in the shallow aquifer required for return flow), and GW_DELAY (groundwater delay time) – by trial and error to establish a dimensionless number related to the land use, soil type and weather conditions. The response of the surface runoff was evaluated when the parameters were changed from -60% to +60% by a sequential increment of 20%. The two sediment parameters – USLE equation support practice (P) factor, and SPEXP (exponential parameter for calculating sediment restrained in channel sediment routing) – were used to evaluate the sediment yields. The parameters that had a high impact on the NO3-N and PO43– concentrations were RSDCO (residue decomposition coefficient), NPERCO (nitrogen percolation coefficient), SHALLST_N (initial concentration of NO3-N in the shallow aquifer), PPERCO (phosphorus percolation coefficient), and GWSOLP (concentration of soluble P in groundwater). Therefore, parameters from the sensitivity analysis of the model can help us understand the complex hydro-geological interactions of the watershed.
3.3 Calibration and validation of the SWAT model
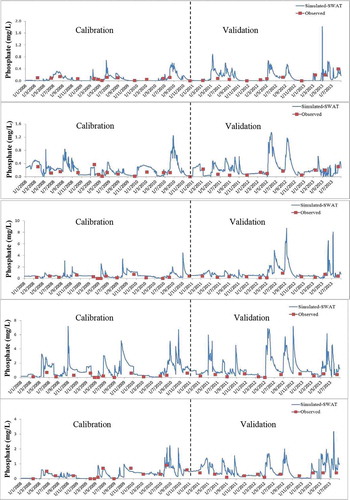
The simulated flow results were compared with the observed data from the Y.6, Y.4, Y.16, Y.17 and Y.5 hydrological stations (see for station locations). The model input parameters for the calibration and validation processes in the observed and simulated streamflow were adjusted by matching the guidelines according to the parameter sensitivity analysis (Section 3.2). The calibration period (2006–2009) and the validation periods (2000–2004 and 2010–2013) showed good relationships (see figure captions for R2 values) between the monthly data from the observed and simulated flow (), monthly sediment yield (), daily NO3-N concentrations (), and daily PO43– levels (). Thus, there was a strong correlation between the observed and simulated results.
Figure 6. Comparison of the observed and simulated results for the monthly water flow (m3 s−1; CMS) at, from top to bottom, hydrological stations Y.6 (R2 = 0.85), Y.4 (R2 = 0.77), Y.16 (R2 = 0.74), Y.17 (R2 = 0.71), and Y.5 (R2 = 0.71).
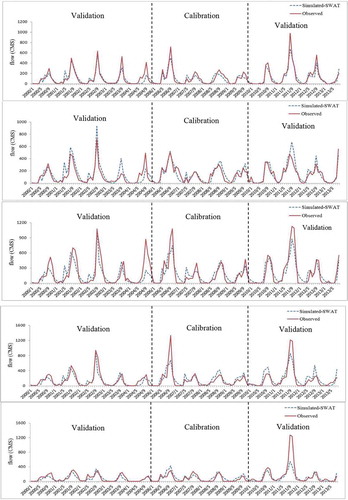
Figure 7. Comparison of the observed and simulated results for monthly sediment yield at, from top to bottom, hydrological stations Y.6 (R2 = 0.69), Y.4 (R2 = 0.64), Y.16 (R2 = 0.71), Y.17 (R2 = 0.63), and Y.5 (R2 = 0.68).
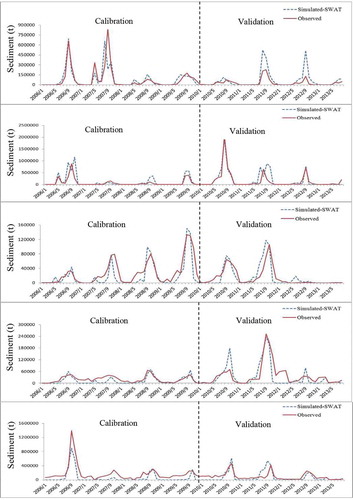
Figure 8. Comparison of the observed and simulated results for the river water NO3-N concentrations at, from top to bottom, hydrological stations Y.6 (R2 = 0.66), Y.4 (R2 = 0.73), Y.16 (R2 = 0.86), Y.17 (R2 = 0.64), and Y.5 (R2 = 0.70).
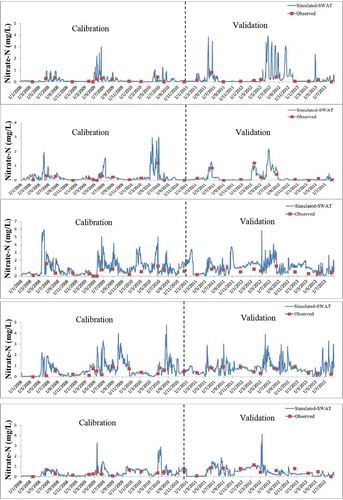
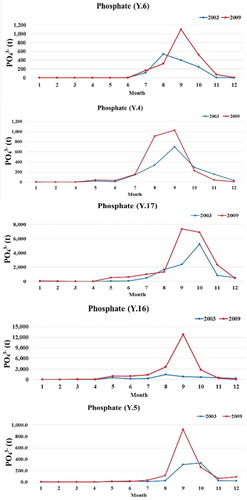
Figure 9. Comparison of the observed and simulated results for the river water PO43− concentrations at, from top to bottom, hydrological stations Y.6 (R2 = 0.70), Y.4 (R2 = 0.61), Y.16 (R2 = 0.87), Y.17 (R2 = 0.91), and Y.5 (R2 = 0.65).
3.4 Impact of land-use changes in the Lower Yom River Basin
Most of the land use in the Lower Yom River Basin was represented by forest area followed by agricultural, urban and stream areas. The 2003 land-use map was overlaid with the land-use map for 2009 to identify the changes in land use between 2003 and 2009 ( and ). According to the change detection results presented in and , much of the forest land has been transformed into agricultural land (paddy fields, field crops, and perennial crops), with an area of 603.35 km2 or 4.29%; this was followed by water bodies (area: 48.07 km2, 0.34%), and urban and built-up land (area: 23.46 km2, 0.17%). In contrast, most of the urban and built-up land areas increased, to cover 251.69 km2 (1.79%). Most of the urban and built-up land was transformed from field crops (area: 140.66 km2, 1.00%), followed by paddy fields (area: 84.34 km2, 0.60%) and some perennial crops (area: 3.23 km2, 0.02%).
Table 4. Description and optimal values used in the SWAT model calibration/validation.
Table 5. Change detection for the Lower Yom River, 2003–2009.
Figure 10. Land-use changes in the Lower Yom River from 2003 to 2009.
As mentioned above, the largest changes in area were into paddy fields and urban areas due to commercial and industrial growth. In order to investigate the land-use changes in an intensive agricultural catchment, the impact of land-use changes on the runoff, sediment, NO3-N and PO43– levels was simulated by rerunning the SWAT model using the 2003 and 2009 land-use data with the same 2009 meteorological input from the simulation periods from the stations of the RID and the water quality monitoring stations of the Regional Environment Office in Thailand. The sub-basin area simulated by the SWAT model covered five stations (Y.6, Y.4, Y.16, Y.17 and Y.5) on the lower reaches of the Yom River ().
3.4.1 Runoff
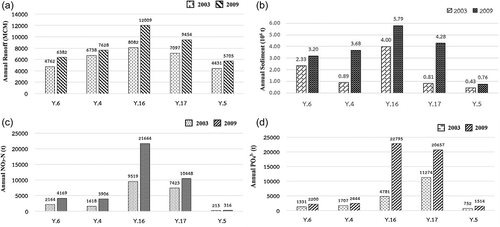
The effect of the change in land use between 2003 and 2009 on the amount of runoff is shown in . The simulations revealed that the annual runoff had increased by 34.0% (1620 × 106 m3, MCM (million cubic meters)), 13.2% (889 × 106 m3), 48.6% (3926 × 106 m3), 33.2% (2357 × 106 m3) and 28.8% (1274 × 106 m3) at stations Y.6, Y.4, Y.16, Y.17 and Y.5, respectively. Furthermore, the monthly peak flow at station Y.6 in August 2009 was 680 m3 s−1 (CMS), which was 35% higher than in September 2003. For the other stations (Y.4, Y.16, Y.17 and Y.5), the monthly peak flow in September 2009 was 675, 1126, 856 and 856 m3 s−1, respectively, which was 15, 91, 25 and 25% higher, respectively, than in August 2003.
Figure 11. Effects of land-use change between 2003 and 2009 on the runoff (m3 s−1; CMS).
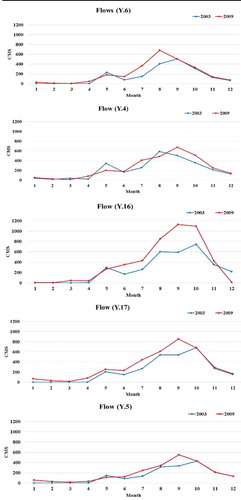
Thus, the change in land use between 2003 and 2009 led to a 13–49% increase in runoff in the Lower River Yom Basin, ranging from 900 × 106 m3 (station Y.4) to 3920 × 106 m3 (station Y.16) ()). Moreover, the maximum flow velocity increased by 15–90%, ranging from about 15 m3 s−1 (Y.4) to 380 m3 s−1 (Y.16). This is likely to be because most of the forest area above station Y.16 was converted to agricultural areas (rice fields, field crops and perennial crops), with an area of 526.2 km2. In addition, the runoff chart at each station revealed that the maximum runoff in 2009 occurred one month sooner than in 2003. At the upstream station Y.16, the highest monthly runoff was in September 2003 and in August 2009, while for the middle and lower reaches of the Yom River, the highest monthly runoff occurred in October 2003 and September 2009, respectively. Thus, changes in land use are closely associated with the quantity of runoff, the ratio of highest runoff, and flow characteristics.
Figure 12. Effect of land-use change between 2003 and 2009 on (a) annual runoff, (b) sediment yield, (c) NO3−, and (d) PO43− levels in the Lower River Yom Basin.
Several other studies have modelled the impact of land-cover and land-use changes on hydrological responses. For example, Githui et al. (Citation2009) used the SWAT model in the Nzoia River watershed in Kenya to examine the impacts on baseflow and streamflow under the current land-use changes. They found that flood risk was exacerbated as the current land-use gradually changed to more smallholder agricultural areas, and the change in surface runoff increased by 55–68%.
3.4.2 Sediment yield
The effect of the change in land use between 2003 and 2009 on the sediment yield is shown in . The simulations revealed that the annual sediment yield increased by 37.0% (8.64 × 10⁵ t), 315% (2.79 × 10⁶ t), 44.2% (1.79 × 10⁶ t), 427% (3.47 × 10⁶ t) and 76.9% (3.30 × 10⁵ t) at stations Y.6, Y.4, Y.16, Y.17 and Y.5, respectively. Furthermore, the highest sediment yields in 2009 and 2003 for stations Y.6, Y.4, Y.16, Y.17, and Y.5, respectively, were 1.73 and 1.30 × 10⁶ t, 1.69 and 6.94 × 10⁵ t, 2.25 and 1.48 × 10⁶ t, 1.80 × 10⁶ t and 3.27 × 10⁵ t, and 2.37 and 1.80 × 10⁵ t.
Figure 13. Effects of land-use change (2003–2009) on sediment yield.
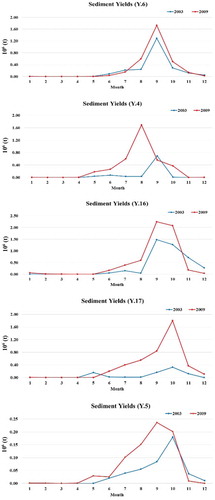
Thus, the change in land use from 2003 to 2009 resulted in a 37–427% increase in the annual sediment yield or an increase of approx. 8.6 × 10⁵ t at station Y.6 and an approx. 3.47 × 10⁶ t at station Y.17 ()). Moreover, the maximum sediment yield was generally higher in September and October. For the upstream region, the highest sediment yield was in October in both 2003 and 2009, which corresponded to the time of maximum monthly runoff. The major change of land use in the upper and middle part of the Lower Yom River Basin was from forest to agricultural land (~5.67%) and from agriculture to urban areas (~2.26%). As a result, a reduction in sediment, erosion and sediment deposition occurred at the lower elevations, especially downstream (station Y.16).
Similarly, rapid changes in the upland areas (Mau Forest) of the River Njoro watershed, Kenya, caused an increase in the streamflow and flashier flows, which are associated with higher erosion and sediment delivery. The Kenya Wildlife Service identified sediment transport as a significant issue in Lake Nakuru National Park (Baker and Miller Citation2013).
3.4.3 Nitrate-N levels
The effect of the change in land use between 2003 and 2009 on the river NO3-N concentration is shown in . The simulations reveal that the annual NO3-N load at stations Y.6, Y.4, Y.16, Y.17 and Y.5 had increased by 93% (2004 t year−1), 141% (2288 t year−1), 127% (12 126 t year−1), 41% (3025 t year−1), and 47% (101 t year−1), respectively. Furthermore, the monthly peak of NO3-N load was increased by 156%, 1265%, 112%, 57% and 84% to 2581, 209, 3474, 1487 and 99 t, respectively.
Figure 14. Effects of land-use change (2003–2009) on NO3-N load in the Lower Yom River Basin.
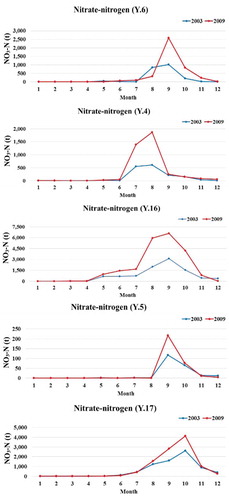
Thus, the change in the land use from 2003 to 2009 increased the NO3-N load by about 40–140%, or up to 21 644 t year−1 or 1880 kg km−2 year−1 (station Y.16). The amount of NO3-N load doubled in the upper and middle reaches of the Lower Yom (stations Y.6, Y.4 and Y.16), as shown in ); this is because most of the forest area above station Y.16 was transformed into agricultural land (area: 526.2 km2) and urban areas (area: 251.7 km2) (see and ), especially along the main river. This increase in nitrate load corresponds to the 315% increase in annual sediment yield (from 0.89 to 3.69 × 10⁶ t year−1) at station Y.16.
Nitrates on the soil surface may leach into rivers and groundwater, together with the NO3-N that is discharged into rivers from wastewater, and the resultant high NO3-N concentrations can be harmful to human health through water consumption. As mentioned above, since the southern parts of the Yom River are in agricultural areas, people grow rice and other crops, and because of the number of houses and communities, there is a growing tendency for increased NO3-N concentrations in the river, which may lead to eutrophication in the foreseeable future (Ratkrow Citation2004).
Martínková et al. (Citation2011), similarly, found that future trends in nitrate loads are not likely to be driven only by environmental change, but mainly by nitrogen sources such as fertilizer addition in cultivated areas. As can be seen from , there is a corresponding relation between the proportion of anthropogenic areas and the nitrate yield in various countries throughout the world. In Europe, studies in both Spain and Germany (Languisch and Matzner Citation2002, Merchan et al. Citation2013) reported that the nitrate yield from pristine watersheds was in the range 336–561 kg N km−2 year−1. However, in areas under anthropogenic change, with > 48% agricultural land, Müller et al. (Citation2018), Rode et al. (Citation2009), and Merchan et al. (Citation2013) found a remarkable concentration of nitrate yield in the range of 1850–4120 kg N km−2 year−1. As for the USA, pristine areas yielded 58 kg N km−2 year−1, while nitrate contribution in intensively agricultural areas yielded as much as ~4000 kg N km−2 year−1 (David et al. Citation1997, Kalita et al. Citation2007). In Taiwan, as a representative subtropical area, Kao et al. (Citation2004) and Huang et al. (Citation2012) found that the nitrate yield was approximately 620 kg N km−2 year−1 from less than -1% “anthropogenic” land, yet moderately anthropogenic land resulted in a nitrate yield as high as 2550 kg N km−2 year−1. According to a study by Takamatsu et al. (Citation2014) in the tropical area of the Sesan, Srepok and Sekong (3S) rivers, the largest tributaries of the Mekong River, major future land-use changes in the 3S basins will be driven by deforestation of native rainforest, expansion of agricultural and urban areas, and expansion of commercial plantations such as rubber trees, and this will cause the greatest change in future nitrate loads. Comparing the 3S basins of Cambodia, Vietnam and Lao PDR, where high levels of fertilizer application are not widespread among farmers, some pristine basins have a nitrate load of 135 kg N km−2 year−1, while the sub-basins with intensively agricultural areas have a nitrate load as high as 1619 kg N km−2 year−1.
Table 6. Nitrate load observed in this study compared to previous studies around the world (modified from Huang et al. Citation2012, Oeurng et al. Citation2016).
The results of this study thus clearly illustrate that the large nitrate yield of 2770 kg N km−2 year–1 in the Lower Yom River area in 2009 () was caused by uncontrolled nitrate usage serving the quantity-based agricultural production, as well as wastewater and household sewage water. In this area, corn and rice are the major agricultural crops, covering areas of > 8000 km2. Following the recommendations of the government agency guidebook (see Table S1 in the Supplementary material), the fertilizer application level for these crops is approx. 150–160 kg N ha−1 batch−1 or 300–320 kg N ha−1 year−1 (generally, farmers plant two rounds of crops during the year). However, farmers might apply fertilizer at levels higher than the recommended level in order to achieve greater agricultural yields. Consequently, some residual fertilizer-N in the soil after harvesting is released into the surface water and, finally, into the subsurface environment.
3.4.4 Phosphate levels
The effects of the changes in land use between 2003 and 2009 on the river PO43− concentration are shown in Figure 15. The simulations revealed that the annual PO43− load at stations Y.6, Y.4, Y.16, Y.17 and Y.5 increased by 65% (868 t year−1), 43% (737 t year−1), 377% (18 015 t year−1), 83% (9383 t year−1) and 101% (763 t year−1), respectively. Furthermore, the monthly peak PO43− load in 2009 increased by 104, 47, 793, 41 and 177% to 1098, 1028, 12 793, 7359 and 1098 t, respectively.
Thus, the change in land use from 2003 to 2009 led to a 37–377% increase in PO43− levels, increasing to 22 795 t year−1 (station Y.16), and 20 657 t year−1 at station Y.17 ()). This reflects both the change from the forest area above station Y.16 to agricultural land (526.2 km2) and the increased urban and built-up land along the main river in the lower part of the study area (251.7 km2) (see Supplementary material, Fig. S1). The highest monthly PO43− level increased by 41–793%, which followed the increased maximum PO43− level at station Y.16 (an 11 000-t increase) that was associated with the increased runoff and sediment yield (see ). This can be explained by the fact that most of the area between stations Y.16 and Y.5 had been changed to urban and built-up areas, which mainly release wastewater and household sewage effluent containing detergents and other cleaning products ( and Fig. S1).
Figure 15. Effects of land-use change (2003–2009) on PO43− load in the Lower River Yom Basin.
As revealed by Dabrowski (Citation2014), who applied the SWAT model to predict ortho-phosphate loads, four reservoirs in the Upper Olifants River in South Africa experienced eutrophication and the presence of algae blooms due to high phosphate loading. The sources of these phosphate loadings were mainly the poorly maintained sewage treatment plants, contributing approximately 7% of the mean annual runoff volume to this basin. Moreover, according to the study of Baldyga et al. (Citation2007), the presence of algal blooms appearing in Lake Nakuru in more recent years is considered to be a result of higher nutrient inputs (for example, phosphate, nitrate and potassium) from agricultural runoff from the middle and uplands portions into the downstream River Njoro watershed. Pisinaras et al. (Citation2009) studied the amount of NO3-N and PO43− in the approx. 52-km-long Kosynthos River in northern Greece, with a catchment area of about 440 km2, and found that eutrophication tended to occur due to agricultural activity, housing and wastewater industries that released NO3-N and PO43– into the water sources. The overwhelming plant and algal growth from eutrophication may impede infrastructure systems, such as municipal water, and transportation on the water surface. It may also overexploit dissolved oxygen and adversely affect the aquatic ecosystem. For better long-term water quality there must be effective regulations for wastewater management in both the agricultural and household sectors.
4 Summary and conclusions
The SWAT model was proposed to evaluate the streamflow, sediment yield and chemical pollutants (NO3-N and PO43−) at the watershed outlet from a large watershed situated in a tropical zone under a sub-humid climate in Thailand. The average monthly flow calibration and validation processes used measured data for the period 2000–2013 and yielded a good correlation (R2 = 0.68–0.86) between the measured and simulated flow volumes. Model calibration and validation was performed for the average monthly sediment for the period 2006–2013, giving R2 values of 0.54–0.82. The measured and simulated average daily NO3-N and PO43− levels for the period 2008–2013 were 0.55–0.90 and 0.52–0.55, respectively. Furthermore, the simulated results from two land-use change scenarios exceeded the water quality standards. After both calibration and validation processes, statistical assessment of the model output was accepted following the criteria suggested by Moriasi et al. (Citation2007).
The results reveal that the SWAT model can be used effectively in describing the streamflow, sediment yield, and NO3-N and PO43− levels of the surface water, and so it could be used as an administration instrument of choice in solving many water resources and water pollution issues. The outcomes of the study could be used as a decision-making tool by policy makers in creating a suitable strategy for the management of the runoff and sediment yields from the watershed, and for fertilizer management in the agricultural area to mitigate the point and non-point sources of pollution, with improved efficiency of nutrient use for rainfed crops.
Supplemental Material
Download MS Word (190.5 KB)Acknowledgements
The authors gratefully acknowledge the Center of Excellence on Hazardous Substance Management (HSM) and the International Postgraduate Programs in Environmental Management, Graduate School, Chulalongkorn University, Bangkok, for their invaluable support in terms of facilities and scientific equipment.
Disclosure statement
No potential conflict of interest was reported by the authors.
Supplementary material
Supplementary material can be accessed on this article here.
Additional information
Funding
Related Research Data
References
- Andriamananjara, A., et al., 2016. Farmyard manure application has little effect on yield or phosphorus supply to irrigated rice growing on highly weathered soils. Field Crops Research, 198 (61–69), (61–69). doi:10.1016/j.fcr.2016.08.029
- APHA, AWWA, WEF, 2005. Standard Methods for the Examination of Water and Wastewater, 21th. American Public Health Association: Washington.
- Arnold, J.G., et al., 1998. Large area hydrologic modeling and assessment, part I: model development. Journal of the American Water Resources Association, 34 (1), 73–89. doi:10.1111/jawr.1998.34.issue-1
- Arnold, J.G., et al., 1999. Continental scale simulation of the hydrologic balance. Journal of the American Water Resources Association, 35, 1037–1051. doi:10.1111/jawr.1999.35.issue-5
- Arnold, J.G.D.N., et al. 2012. Swat: model use, calibration, and validation. Journal of American Society of Agricultural and Biological Engineers, 55, 1491–1508.
- Baker, T.J. and Miller, S.N., 2013. Using the Soil and Water Assessment Tool (SWAT) to assess land use impact on water resources in an East African watershed. Journal of Hydrology, 486, 100–111. doi:10.1016/j.jhydrol.2013.01.041
- Baldyga, T.J., et al., 2007. Assessing land cover change in Kenya’s Mau forest region using remotely sensed data. African Journal of Ecology, 46 (1), 46–54. doi:10.1111/aje.2008.46.issue-1
- Bhavya, P.S., et al. 2016. Nitrogen uptake dynamics in a tropical eutrophic estuary (Cochin, India) and adjacent coastal waters. Estuarine, Coastal and Shelf Science Journal, 39, 54–67.
- Boeykens, S.P., et al., 2017. Eutrophication decrease: phosphate adsorption processes in presence of nitrates. Journal of Environmental Management, 203, 888–895. doi:10.1016/j.jenvman.2017.05.026
- Boithias, L., et al., 2014. Daily nitrate losses: implication on long-term river quality in an intensive agricultural catchment of southwestern France. Journal of Environmental Quality, 43 (1), 46–54. doi:10.2134/jeq2011.0367
- Borah, K. and Bera, M., 2004. Watershed-scale hydrologic and nonpoint-source pollution models: review of application. Journal of the American Society of Agricultural and Biological Engineers, 47, 789–803. doi:10.13031/2013.16110
- Buda, A.R. and DeWalle, D.R., 2009. Dynamics of stream nitrate sources and flow pathways during stormflows on urban forest and agricultural watersheds incentral Pennsylvania, USA. Hydrological Processes, 23 (23), 3292–3305. doi:10.1002/hyp.v23:23
- Caldy, P., 2004. Determination of permitted limit of nutrients in the Latian reservoir dam to prevent its eutrophication. MSc thesis. Sharif University of Technology, Iran.
- Chotpantarat, S., et al., 2003. The effect of land use changes on floods in Phetchaburi River Basin. Proceedings of 41th Kasetsart University Annual Conference: Engineering and Architecture, Thai National AGRIS Centre, 367–376. 141 10.1038/sj.bjp.0705615
- Chotpantarat, S., Limpakanwech, C., and Sutthirat, C., 2011. Effect of soil water characteristic curves on simulation of nitrate vertical transport in a Thai agricultural soil. Sustainable Environmental Research, 21, 187–193.
- Cui, C., Liu, S., and Qu, L.M., 2015. Estimates and spatio-temporal characteristics of nitrogen and phosphorus discharges from agricultural sources in Xiangxi River Basin, Xingshan County. Journal of Agro-Environment Science, 35 (5), 937–946.
- Dabrowski, J.M., 2014. Applying SWAT to predict ortho-phosphate loads and trophic status in four reservoirs in the upper Olifants catchment, South Africa. Hydrology and Earth System Sciences, 18, 2629–2643. doi:10.5194/hess-18-2629-2014
- David, M.B., et al., 1997. Nitrogen balance in and export from an agricultural watershed. Journal of Environmental Quality, 26, 1038–1048. doi:10.2134/jeq1997.00472425002600040015x
- El-Khoury, A., et al., 2015. Combined impacts of future climate and land use changes on discharge, nitrogen and phosphorus loads for a Canadian river basin. Journal Environmental Management, 151, 76–86. doi:10.1016/j.jenvman.2014.12.012
- Eugenio, M.N., et al., 2014. Hydrological and water quality impact assessment of a Mediterranean limno-reservoir under climate change and land use management scenarios. Journal of Hydrology, 509, 354–366. doi:10.1016/j.jhydrol.2013.11.053
- Fitzpatrick, F.A., 2005. Effects of urbanization on the geomorphology, habitat, hydrology, and fish index of biotic integrity of streams in the Chicago area, Illinois and Wisconsin. American Fisheries Society Symposium, 47, 87–115.
- Gikas, G.D., Yiannakopoulou, T., and Tsihrintzis, V.A., 2006. Modeling of non-point source pollution in a Mediterranean drainage basin. Environmental Modeling and Assessment, 11, 219–234. doi:10.1007/s10666-005-9017-3
- Githui, F., et al., 2009. Climate change impact on SWAT simulated streamflow in Western Kenya. International Journal of Climatology, 29 (12), 1823–1834. doi:10.1002/joc.v29:12
- Hao, F., Zhang, X., and Yang, Z., 2004. A distributed non point source pollution model: calibration and validation in the Yellow River Basin. Journal of Environmental Science, 16 (4), 646–650.
- Havrylenko, S.B., et al., 2016. Assessment of the soil water content in the Pampas region using SWAT. Catena, 137, 298–309. doi:10.1016/j.catena.2015.10.001
- Heuvelmans, G., Muys, B., and Feyen, J., 2004. Evaluation of hydrological model parameter transferability for simulating the impact of land use on catchment hydrology. Physics and Chemistry of the Earth, 29, 739–747. doi:10.1016/j.pce.2004.05.002
- Huang, J.-C., et al., 2012. Land use effect and hydrological control on nitrate yield in subtropical mountainous watersheds. Hydrology and Earth System Sciences, 16 (3), 699–714. doi:10.5194/hess-16-699-2012
- Hydro and Agro Informatics Institute, 2012. Development of data 25 river flooding and drought models. Bangkok, Thailand: Ministry of Science and Technology, Final Report.
- Jamshidi, M. and Tajrishy, M., 2010. Modeling of point and non-point source pollution of nitrate with SWAT in the Jajrood river watershed Iran. International Agricultural Engineering Journal, 19 (2), 23–31.
- Jha, M.K. and Gassman, P.W., 2014. Changes in hydrology and stream flow as predicted by a modeling experiment forced with climate models. Hydrological Processes, 28 (5), 2772–2781. doi:10.1002/hyp.9836
- Kalita, P.K., et al., 2007. Subsurface drainage and water quality: the Illinois experience. Transactions of the ASABE, 50, 1651–1656. doi:10.13031/2013.23963
- Kao, S.J., Shiah, F.-K., and Owen, J.S., 2004. Export of dissolved inorganic nitrogen in a partially cultivated subtropical mountainous watershed in Taiwan. Water, Air and Soil Pollution Journal, 156 (1), 211–228. doi:10.1023/B:WATE.0000036799.05833.e3
- Kaur, R., et al., 2004. Integration of linear programming and a watershed scale hydrologic model for proposing an optimized land-use plan and assessing its impact on soil conservation—a case study of the Nagwan watershed in the Hazaribagh district of Jharkhand, India. International Journal of Geographical Information Science, 18 (1), 73–98. doi:10.1080/13658810310001620915
- Kitichuchairit, S., 2013. Impact of land use changes on river runoff in Yom Basin during 1988-2009 using SWAT hydrologic model, International conference on environmental and hazardous substance management towards a green economy (EHSM). Bangkok, Thailand: Chulalongkorn University Printing House.
- Klongvessa, P., Lu, M., and Chotpantarat, S., 2017. Variations of characteristics of consecutive rainfall days over northern Thailand. Theorerical and Applied Climatology. doi:10.1007/s00704-017-2208-4
- Konkul, J., Rojborwornwittaya, W., and Chotpantarat, S., 2014. Hydrologic characteristics and groundwater potentiality mapping using potential surface analysis in the Huay Sai area, Phetchaburi province, Thailand. Geosciences Journal, 18 (1), 89–103. doi:10.1007/s12303-013-0047-6
- Krysanova, V., Hattermann, F., and Wechsung, F., 2005. Development of the ecohydrological model SWIM for regional impact studies and vulnerability assessment. Hydrological Processes, 19 (3), 763–783. doi:10.1002/(ISSN)1099-1085
- Krysanova, V. and White, M., 2015. Advances in water resources assessment with SWAT—an overview. Hydrological Sciences Journal, 60 (5), 771–783.
- Langusch, -J.-J. and Matzner, E., 2002. N fluxes in two nitrogen saturated forested catchments in Germany: dynamics and modelling with INCA. Hydrology and Earth System Sciences, 6 (3), 383–394. doi:10.5194/hess-6-383-2002
- Li, S. and Bush, R.T., 2015. Rising flux of nutrients (C, N, P and Si) in the lower Mekong river. Journal of Hydrology, 530, 447–461. doi:10.1016/j.jhydrol.2015.10.005
- Liljeström, I., Kummu, M., and Varis, O., 2012. Nutrient balance assessment in the Mekong basin: nitrogen and phosphorus dynamics in a catchment scale. International Journal of Water Resources Development, 28, 373–391. doi:10.1080/07900627.2012.668649
- Liu, R., et al., 2017. Impacts of manure application on SWAT model outputs in the Xiangxi River watershed. Journal of Hydrology, 555, 479–488. doi:10.1016/j.jhydrol.2017.10.044
- Maier, G., et al., 2009. Estuarine eutrophication in the UK: current incidence and future trends. Aquatic Conservation Marine and Freshwater Ecosystem, 19, 43–56. doi:10.1002/aqc.v19:1
- Martínková, M., et al., 2011. Potential impact of climate change on nitrate load from the Jizera catchment (Czech Republic). Physics and Chemistry of the Earth, 36 (13), 673–683. doi:10.1016/j.pce.2011.08.013
- Mayer, B., et al., 2002. Sources of nitrate in rivers draining sixteen watersheds in the northeastern US: isotopic constraints. Biogeochemistry, 57, 171–197. doi:10.1023/A:1015744002496
- Mbonimpa, E.G., et al., 2012. SWAT model application to assess the impact of intensive corn farming on runoff, sediments and phosphorous loss from an agricultural watershed in Wisconsin. Journal of Water Resource and Protection, 4, 423–431. doi:10.4236/jwarp.2012.47049
- Merchan, D., Causepé, J., and Abrahão, R., 2013. Impact of irrigation implementation on hydrology and water quality in a small agricultural basin in Spain. Hydrological Sciences Journal, 58 (7), 1400–1413. doi:10.1080/02626667.2013.829576
- Moriasi, D.N., et al., 2007. Model evaluation guildlines for systematic quantification of accuracy in watershed simulations. Transaction of the ASABE, 50 (3), 885–900. doi:10.13031/2013.23153
- MRC (Mekong River Commission), 2010. Stage 2 Development of MRC Toolbox: final Report (WP016). Phnom Penh, Cambodia: Information and Knowledge Management Programme, Mekong River Commission (MRC).
- Müller, C., et al., 2018. Tomography of anthropogenic nitrate contribution along a mesoscale river. Science of the Total Environmental, 615, 773–783. doi:10.1016/j.scitotenv.2017.09.297
- Neitsch, S., et al. 2005a. Soil and Water Assessment tool theoretical documentation version 2005. Temple, TX: USDA Agricultural Research Service and Texas A&M Blackland Research Center.
- Neitsch, S., et al. 2005b. Temple, TX. USDA agricultural research service, grassland, soil and water research laboratory and Texas agricultural experiment station. Temple, TX: Blackland Research Center.
- Neitsch, S. and Sims, D., 2002. Soil and water assessment tool theoretical documentation version 2000, Blackland research and extension center, Texas agricultural experiment station Texas, Texas. Water resources Institute publishers, TWRI Report TR-191, College station, Texas, USA. 11 doi: 10.1044/1059-0889(2002/er01)
- Oeurng, C., et al., 2016. Assessment of changes in riverine nitrate in the Sesan, Srepok and Sekong tributaries of the Lower Mekong River Basin. Journal of Hydrology: Regional Studies, 8 (2016), 95–111.
- Oeurng, C., Sauvage, S., and Sánchez-Pérez, J.-M., 2010. Temporal variability of nitrate transport through hydrological response during flood events within a large agricultural catchment in south-west France. Science of the Total Environment, 1409 (1), 140–149. doi:10.1016/j.scitotenv.2010.09.006
- Ouyang, W., et al., 2017. Effects of soil moisture content on upland nitrogen loss. Journal of Hydrology, 546, 71–80. doi:10.1016/j.jhydrol.2016.12.053
- Pisinaras, V., et al., 2009. Hydrological and water quality modeling in a medium-sized basin using the Soil and Water Assessment Tool (SWAT). Desalination, 250 (1), 274–286. doi:10.1016/j.desal.2009.09.044
- Pollution Control Department, 2000. Water Quality Standards & Criteria in Thailand. 4th ed. Bangkok, Thailand: Ministry of Science, Technology and Environment.
- Ratkrow, A., 2004. Study on carrying capacity of organic matters in the Yom River. Master of Science (Forestry), faculty of forestry. Bangkok: Kasetsart University.
- RID (The Royal Irrigation Department), 2008. Hydrological research and development, Analyzing the probability of flood conditions. Bangkok, Thailand: Ministry of Agricultural and Coopertives.
- Rode, M., et al., 2009. Impact of selected agricultural management options on the reduction of nitrogen loads in three representative meso scale catchments in Central Germany. Science of the Total Environment, 407 (11), 3459–3472. doi:10.1016/j.scitotenv.2009.01.053
- Schuol, J. and Abbaspour, K.C., 2006. Calibration and uncertainty issues of a hydrological model (SWAT) applied to West Africa. Advances in Geosciences, 9, 137–143. doi:10.5194/adgeo-9-137-2006
- Sharpley, A.N., et al., 1987. Emvironmental impact of agricultural nitrogen and phosphorus use. Journal of Agricultural and Food Chemistry, 35, 812–817. doi:10.1021/jf00077a043
- Shrestha, B., et al., 2016. Uncertainty in flow and sediment projections due to future climate scenarios for the 3S Rivers in the Mekong Basin. Journal of Hydrology, 540, 1088–1104. doi:10.1016/j.jhydrol.2016.07.019
- Sobota, D.J., Harrison, J.A., and Dahlgren, R.A., 2009. Influence of climate, hydrology, and land use on input and export of nitrogen in California watersheds. Biogeochemistry, 94, 43–62. doi:10.1007/s10533-009-9307-y
- Sun, H. and Cornish, P.S., 2006. A catchment based approach to recharge estimation in the Liverpool Plains, NSW, Australia. Journal of Agricultural Research, 57 (3), 309–320.
- Takamatsu, M., et al., 2014. Development of a land-use forecast tool for future water resources assessment: case study for the Mekong River 3S Sub-basins. Sustainability Science Journal, 9 (2), 157–172. doi:10.1007/s11625-013-0225-5
- Takeda, I., 2012. Impact of suspended sediment and nutrient loading from land uses against water quality in the Hii River basin Japan. Journal of Hydrology, 450, 25–35.
- Waiyasusri, K., Yumuang, S., and Chotpantarat, S., 2016. Monitoring and predicting land use changes in the Huai Thap Salao Watershed area, Uthaithani province, Thailand, using the CLUE-s model. Environmental Earth Science, 75, 533. doi:10.1007/s12665-016-5322-1
- Wangpimool, W., et al., 2010. The effect of reforestation on stream flow in Upper Nan River basin using Soil and Water Assessment Tool (SWAT) model. International Soil and Water Conservation Research, 1, 53–63. doi:10.1016/S2095-6339(15)30039-3
- Williams, J.R. and Berndt, H.D., 1977. Sediment yield prediction based on watershed hydrology. Transactions of the American Society of Agricultural and Biological Engineers, 20 (6), 1100–1104. doi:10.13031/2013.35710
- Yang, X.E., et al., 2008. Mechanisms and assessment of water eutrophication. Journal of Zhejiang University Science, 9, 197–209. doi:10.1631/jzus.B0710626