
ABSTRACT
We discuss the claim that the Amazon River has been subjected to a noticeable increase in suspended sediment transport (SST) in response to both climate and land-use changes. To study this, both satellite imagery and in situ data were compiled to produce a 32-year time series (1984–2016) of suspended sediment concentration. Both parametric and nonparametric statistics were applied to examine the SST time trend. The results indicate that there has been no statistically significant increase in SST in the last 32 years, independent of the statistical approach. The results indicate that, over the last 32 years at the Óbidos station, in Brazil, a recurring pattern of increase and decrease in SST has occurred, rather than a unidirectional systematic trend. This further explains the increasing trend reported in the literature and indicates that short time series are not recommended for time trend analyses due to the large inter-annual variability.
Editor A. CastellarinAssociate editor P. Srivastava
1 Introduction
Suspended sediment is an important controlling variable of biotic and abiotic processes in fluvial systems. The increase of suspended sediment loads affects the biological processes of aquatic ecosystems (Kerr Citation1995, Anderson et al. Citation1996, Berry et al. Citation2003, Kjelland et al. Citation2015) and floodplain evolution (Nanson and Croke Citation1992, Dunne et al. Citation1998, Walling et al. Citation1998, Pierce and King Citation2008, Park and Latrubesse Citation2014).
Several factors control the sediment loads discharged into rivers, such as relief, channel slope, basin size, seasonality of rains and tectonic activities (Chakrapani Citation2005). Another factor that has the potential for changing the natural sediment flux is that of human intervention (Walling and Fang Citation2003). Over the years there has been an increase in river transport of sediment through soil erosion processes at basin scale and a decrease in this flux to the oceans through sediment retention in reservoirs (Chakrapani Citation2005, Syvitski et al. Citation2005).
Since the 1960s, attempts have been made to quantify the suspended sediment transport of the Amazon Basin rivers and to understand its underlying processes (Gibbs Citation1967a, Citation1967b, Holeman Citation1968, Oltman Citation1968, Meade et al. Citation1979, Citation1985, Richey et al. Citation1986, Martinelli et al. Citation1989, Meade Citation1994, Nittrouer et al. Citation1995, Dunne et al. Citation1998, Guyot et al. Citation2005, Aalto et al. Citation2006, Filizola and Guyot Citation2009, Citation2011, Martinez et al. Citation2009, Filizola Citation2011, Guyot et al. Citation2011, Wittmann et al. Citation2011, Armijos et al. Citation2013, Citation2017, Constantine et al. Citation2014).
In the Amazon Basin, sediment production is high, but it is very concentrated, with 90–95% of the suspended sediment transported from the Andes, an area that accounts for only 12% of the basin area (Meade et al. Citation1985, Filizola and Guyot Citation2009). In portions of the Andes, a combination of steep slopes and frail rocks favours erosion. Aalto et al. (Citation2006) reported that lithology and the average catchment slope accounted for 90% of the variance in sediment yield of the Bolivian Andes. In contrast, the Guiana and Brazilian shields contribute approximately 7% of the SST (Filizola and Guyot Citation2011). Generally, half of the suspended load in the Amazon River is transported from the Solimões River, with the remaining half from the Madeira River. The Solimões and Madeira rivers drain the northern and southern regions of the Andes, respectively (Meade Citation1994).
The bedload of the lower Amazon River is low in relation to the suspended load, not exceeding 1% (Dunne et al. Citation1998, Strasser et al. Citation2004), which is below the error of SST estimates; thus, SST can be used to estimate total sediment transport. However, the recently published study of Armijos et al. (Citation2017) presented a dataset that demonstrates an important contribution of the coarse fraction to the total suspended sediment flux of the main Solimões/Amazon stream. This demonstrates that the Amazon River bedload could be more significant than that which was stated previously.
The Amazon River has a fluvial belt formed by a complex system of Quaternary sedimentary units of different ages and development environments (Latrubesse and Franzinelli Citation2002). The main stream of the Amazon River valley starts downstream of Iquitos (Peru) towards the mouth, at the Atlantic Ocean. The fluvial plain is divided into two units: the impeded floodplain and the channel-dominated floodplain. The channel-dominated floodplain is a complex mosaic of fluvial forms, including younger fluvial forms resulting from more active processes (Latrubesse and Franzinelli Citation2002). This setting favours complex exchanges of sediment between the floodplain and the Amazon River channel (Dunne et al. Citation1998, Rudorff et al. Citation2018). The annual sediment exchanges between the channel and the floodplain are greater than the total annual sediment transported by the channel into the main stream (Dunne et al. Citation1998). Additionally, the river–floodplain suspended sediment exchange has increased in the last two decades (Rudorff et al. Citation2018).
The suspended load discharged to the Atlantic Ocean by the Amazon River has an important impact on the coastal geomorphology and on the sediment accumulation on the continental shelf (Nittrouer et al. Citation1995, Gensac et al. Citation2016). Reaching the open sea, the fine-grained sediment is transported mainly from the mouth to the northwest (Amapá and French Guiana). Within this area, large mud banks formed are being subjected to marked dynamics, with migration rates from 2 to 5 km year−1 (Gensac et al. Citation2016).
1.1 Remote sensing for suspended sediment concentration retrieval in Amazonian rivers
The physical support for the remote sensing estimation of suspended sediment concentration (SSC) relies on its strong relationship with visible and near-infrared water-leaving radiance (Curran and Novo Citation1988, Lodhi et al. Citation1997, Ritchie and Shiebe Citation2000). Based on that, both empirical and semi-analytical models have been successfully developed and applied for estimating SSC time series over different time spans and within different aquatic environments, such as in Lake Athabasca, Canada (Long and Pavelsky Citation2013), Lake Tana, Ethiopia (Kaba et al. Citation2014), and in the Yangtze River estuary, China (Feng et al. Citation2014).
Remote sensing data have been applied to estimate SSC from Amazonian rivers since the 1990s (Mertes et al. Citation1993, Mertes Citation1994). The authors used a few Landsat images from the 1980s to calculate rates of sediment exchange between the Solimões River and its floodplain, and rates of deposition over the floodplain.
Over the past decade, with the availability of MODIS data, a series of studies based on the remote sensing of the Amazon Basin SSC have been conducted (Martinez et al. Citation2009, Kilham and Roberts Citation2011, Villar et al. Citation2012, Citation2013, Mangiarotti et al. Citation2013, Park and Latrubesse Citation2014, Citation2015, Latrubesse et al. Citation2017). At the same time, Landsat image time series were applied for retrieving SSC for several rivers of the Amazon Basin (Lobo et al. Citation2014, Montanher et al. Citation2014). Based on the extensive historical dataset, Lobo et al. (Citation2014) retrieved a SSC time series for the Tapajós River and main tributaries to assess the impact of gold mining on the sediment yield.
1.2 Suspended sediment transport trend analysis of the Amazonian rivers
Historically, most of the estimates of Amazon River SST focused on the total annual SST flux (), which displays a pronounced amplitude of variation (452.63–1300 Mt). This wide range of estimates results from different approaches, time-series size, and assumptions adopted in their computations (Syvitski et al. Citation2005). The assessment of SST time trends has received less attention mainly due to the paucity of SSC time series, which is usually related to scarce in situ sampling (Walling and Fang Citation2003, Cohen et al. Citation2014).
Table 1. Review of the estimated annual suspended sediment transport of the Amazon River (Brazil). SD: standard deviation.
However, thanks to the observation programme of ORE HYBAM,Footnote1 there has been a tremendous increase in data availability since the 1990s, when the programme started building time series of SSC at higher temporal frequency for the larger Amazonian rivers, including the Amazon River itself (Martinez et al. Citation2009).
The inter-annual variability in the Amazon River SST has been assessed using ORE HYBAM time series (Guyot et al. Citation2005, Citation2007, Martinez et al. Citation2009). Based on those analyses, the authors claimed that the Amazon River is undergoing an increase in SST. Using an 8-year time series (1995–2003) Guyot et al. (Citation2005) reported an increase in SST between 2000 and 2003. Using a longer time series (1995–2006), which included the previous data, Guyot et al. (Citation2007) confirmed that trend. Finally, Martinez et al. (Citation2009), having extended the time series (1996–2007), were also able to corroborate that trend. According to Martinez et al. (Citation2009), this increase in Amazon River SST could be a response to both climate and land-cover changes. Previously, Martinelli et al. (Citation1989) had already hypothesized that the intense deforestation around the Amazon Basin could increase the sediment yield in the near future.
In this study, we use a longer time series, including data prior to the 1990s, to challenge that claim. To this end, we (a) produced a longer time series (1984–2016) integrating satellite images and in situ measurements of SSC (estimated SSC) and (b) carried out statistical analyses to assess whether there is a significant increasing trend in SST over time.
2 Study site
The Óbidos station is located in the state of Pará (Brazil) around 800 km from the mouth of the Amazon River (). This station was chosen because it has negligible tidal influence (Kosuth et al. Citation2009), integrating almost 80% of the Amazon Basin discharge, and has over 50 years of discharge records (Filizola and Guyot Citation2009).
Figure 1. (a) The Amazon River basin in South America; the Óbidos station is indicated by the black dot. (b) Greyscale Landsat/TM Band 4 (near-infrared) of the three scenes used in this study (229/062, 228/61, 227/062). The white dot indicates the Óbidos gauging station.
The hydrological regime is characterized by minimum discharges between September and December and maximum between April and July. The station has a long time series of SSC data based on in situ samplings by several researchers, official agencies and research programmes and thus has produced several estimates of annual SST (). Systematic high-frequency data sampling (every 10 days) only began in 1995 as part of the ORE HYBAM research programme, which has also developed remote sensing methods for estimating SSC using MODIS images since 2000.
3 Data and methods
3.1 SSC and discharge databases
3.1.1 ANA and ORE HYBAM databases
The ANA (Brazilian National Water Agency; http://www2.ana.gov.br/Paginas/EN/) provides data from its sedimentometric network, which includes the Óbidos station (a total of 34 SSC measurements were available from 27 June 1984 to 4 May 2001).
The ORE HYBAM programme has provided daily flow data for the Óbidos station since 1968. The acquisition of in situ SSC data measurements started in 1995, every 10 days in the main Amazon Basin rivers (www.ore-hybam.org). The SSC measurements were conducted using water collected at the surface (approximately 20 cm depth) in 500 mL samples at a fixed point on the river (Martinez et al. Citation2009). Those measurements are hereafter referred to as SSCs (surface suspended sediment concentration). The procedure for determining SSC is based on the gravimetric method (Gray et al. Citation2000).
The programme also provides SSCs estimations using 8-day composite images from the MODIS sensor (for more information on the procedures, see Martinez et al. Citation2009). There is a total of 1209 SSCs observations in the ORE HYBAM database, covering the period between June 1994 and July 2016, 555 of them coming from field samplings and 654 from MODIS estimates. Both sets (ANA and HYBAM) represent surface concentration data (Filizola and Guyot Citation2009) and are consistent (Filizola Citation2011) because their differences do not exceed 5% at the Óbidos station (Guyot et al. Citation2005).
3.1.2 SSC estimates from Landsat data
The original feature of this study is the use of Thematic Mapper (TM) images to generate SSCs estimates for the period between 1984 and 1994, extending the time series by over a decade. Although the temporal frequency of TM (16 days) is very low when compared to MODIS (almost every day at the equator), the EOS programme, which includes MODIS/Terra and MODIS/Aqua satellites, started operation in 2000. Therefore, from 1984 to 2000 the only continuous data source is provided by Landsat images, making their use justified as the only viable means to increase the SSC time series. Another option to improve the image acquisition frequency would be to use microwave data, as they are available in all weather conditions. However, information on water column components can only be provided by visible and near-infrared sensors, as pointed out by numerous papers on OceanColor remote sensing since the early 1980s.
A total of 308 Landsat 5 TM images, covering the period from 9 April 1984 to 26 December 1994 were obtained from the INPE catalogue (www.dgi.inpe.br/). Those images were then distributed among the three scenes used in the study: scenes 229/062 (96), 228/061 (98) and 227/062 (114) (). The location of both the Óbidos gauge station and the Landsat 5 scenes may be also verified with the KML file (Supplementary material available online).
The SSCs estimates were based on an empirical model previously calibrated by Montanher et al. (Citation2014) using in situ data from HYBAM and ANA sampled concurrently or on dates close to those of Landsat overpasses. The Montanher et al. (Citation2014) model for the Amazon River is described by:
where ρ1, ρ2, ρ3, ρ4 and ρ5 are the TOA reflectance at the following spectral bands: blue, green, red, near-infrared and short-wave infrared at 1.676 μm, respectively. Atmospheric correction is traditionally applied when dealing with multi-date analyses using satellite remote sensing images. However, we carried out an experiment aiming to develop empirical models suitable for the entire Amazon Basin. The experiment consisted of using different image datasets subjected to different types of correction algorithms, including atmospheric correction and Sun glint correction. However, the results indicated that the TOA reflectance provided estimates that were statistically similar and even more accurate than those provided by the various types of corrected reflectance. It is not the first time that authors have arrived at a similar conclusion to that described by Montanher et al. (Citation2014). Matthews et al. (Citation2010) and Tebbs et al. (Citation2013) also demonstrated that TOA reflectance can be used to retrieve water quality parameters.
The reason for this is that an accurate atmospheric correction relies on high-quality input data. For instance, only recently, aerosol product needed for atmospheric correction has been validated for South America (Martins et al. Citation2017). Therefore, the authors decided to use the TOA reflectance. As explained in Montanher et al. (Citation2014), there are physical factors explaining why those empirical models provide accurate estimates. The model takes advantage of all sensor spectral bands, and band ratios, using them to overcome atmospheric and Sun glint effects.
The use of TM images is limited in relation to the Landsat temporal resolution (every 16 days). Also, many images are not usable due to cloud cover and radiometric noise. Therefore, the use of a unique scene covering only the gauging station (orbit 228, point 061) would not meet the required data frequency. To overcome that, scenes from adjacent orbits (227 and 229) were used in this study, as shown in .
The use of three different orbits is acceptable in this case, since there is very low longitudinal variation in SSC, as reported by Martinelli et al. (Citation1989). They observed SSC variations of only 17 mg L−1 at every 100 km in a study conducted over a 2000-km river stretch between Vargem Grande and Óbidos. In addition, the only major tributary in this reach is the Tapajós River (), and the estimates were performed upstream from its mouth. Thus, as there was no input from major tributaries, we assumed that no significant change occurred in the suspended load among the three satellite orbits used for estimating SSCs.
Despite that, the reliability of estimates from three different scenes was tested by processing 102 images between 15 June 1999 and 14 October 2003, using 40 images from scene 229/062, 30 from scene 228/061 and 32 from scene 227/062. The SSCs values estimated from those 102 images were plotted against in situ SSCs (ORE HYBAM), indicating that the estimation errors are negligible ().
Figure 2. Time series of the SSCs of the Amazon River. The field data series is represented in red. The dots represent the estimates obtained from the Landsat 5 TM images, and the colours indicate the scene that was used. [Colours may be seen in the online version.]
![Figure 2. Time series of the SSCs of the Amazon River. The field data series is represented in red. The dots represent the estimates obtained from the Landsat 5 TM images, and the colours indicate the scene that was used. [Colours may be seen in the online version.]](/cms/asset/e2dc0f05-f4e9-4377-9b3a-63a1d9a44d84/thsj_a_1546387_f0002_oc.jpg)
Landsat estimates are consistent with the seasonal pattern of the rising and falling of in situ SSCs measurements. Likewise, no great differences in SSCs estimates were observed between the three scenes. These results indicate that the estimates based on TM images are robust, and the use of scenes from the three orbits is also feasible.
3.2 Suspended sediment transport calculation
The use of three orbits provided an average sampling frequency of one sample every 12.7 days (308 images in 3913 days), whereas the ORE HYBAM series has an average of one sample every 6.6 days. The entire SSC database includes 1551 values (average of one sample every 7.6 days).
The analysis of the time trend raises the issue regarding the suitability of SSC availability at every 7 to 12 days for SST studies. Armijos et al. (Citation2013), using daily samplings and ORE HYBAM data, concluded that a 10-day sampling frequency was not suitable for highland rivers such as from the Andes. However, according to them, such a data frequency (10 days) was adequate for lowland rivers. Considering that the Amazon River is a lowland river at Óbidos station, one can assume that the sampling frequency of these databases does not jeopardize the quality of the sediment transport estimates.
As the Amazon River does not show rapid changes in concentration (it is a typical lowland river), daily SSCs values were calculated by a simple linear interpolation:
where d is the Julian day, SSCsn is SSCs for any day dn, SSCsi is SSCs for an initial day di before dn and SSCsf is SSCs for a final day df after dn.
As stated earlier, SSCs values do not represent sediment concentration in the water column (SSC). However, the SSC of many Amazonian rivers has been estimated based on the linear relationship between both variables (Laraque et al. Citation2005, Kilham and Roberts Citation2011). In Óbidos, the surface concentration can be used to estimate the total concentration (Filizola Citation2003, Guyot et al. Citation2005, Laraque et al. Citation2005, Martinez et al. Citation2009):
where the constant 43.5 has the unit of mg L−1. Despite the simplicity of Equation (3), is was assumed that the impact of seasonality was minimal due to the lack of data to tune the model to fit seasonal changes in the relationship between SSCs and SSC. It is important, however, to state that this methodological weakness may have an unknown impact if the data are applied for computing total sediment budget. Information about the uncertainty in the estimated SST, induced by different vertical distributions of the SSC throughout the year, was recently published by Armijos et al. (Citation2017). However, the temporal scale of this study (about 30 years) is not consistent with the dataset collected by Armijos et al. (Citation2017) in a single hydrological year, thus preventing its use.
The SST was calculated by multiplying the SSC values by the daily discharge. Daily SST values were summed to get monthly and annual values. In the case of the annual values, the hydrological year was defined as being from October to September. Moreover, the full SST series starts in April 1984 and ends in July 2016 (387 months), and covers 31 full hydrological years starting in October 1984 and ending in September 2015.
3.3 Statistical analysis
Two distinct sets of statistical analysis were carried out, the first being a comparison between the observed and reconstructed SST series. As this investigation involved reconstructing a time series, it was necessary to check the reliability of the estimated series. The reconstructed series begins in April 1984 and ends in December 1994, composed of the ANA database and mainly by Landsat estimates. The observed series is composed of the HYBAM database, which is a collection of in situ sampling and MODIS estimates, covering the period between January 1995 and July 2016.
Monthly SST values were submitted to means and variances tests considering two sets: reconstructed (1984–1994: N = 129) and observed (1995–2016: N = 258). Additionally, the same tests were carried out for both annual minimum and maximum monthly values of each year (1985–1994: N = 10; and 1995–2015: N = 21). Levene’s test of homogeneity was applied for assessing the differences between the variances of monthly SST and a T-test for independent samples was applied for assessing the difference between the averages.
The second set of statistical tests refers to time trend analysis. The time series was analysed using both parametric and nonparametric approaches. The parametric approach uses linear regression (Helsel and Hirsch Citation2002), using the yearly total SST as input in order to reproduce the Martinez et al. (Citation2009) study. The nonparametric approach applied the seasonal Kendall test (“rkt” package, Marchettto Citation2015), which accounts for seasonality (Helsel and Hirsch Citation2002) using total monthly values as input. For the normality assessment, the following tests were applied:
(i) Shapiro-Wilk test for N<50;
(ii) Kolmogorov-Smirnov test for N>50.
The significance level adopted for all statistical tests was 0.05 (α = 5%).
4 Results and discussion
4.1 Suspended sediment transport time series
The resulting dataset from both in situ measurements and satellite image estimates is a continuous time series of SST, composed of 387 months (April 1984–July 2016) at Óbidos (). The historical series shows a lag between the peaks of total discharge and sediment, displaying a delay of 2–3 months between the maximum total discharge and SST. The lag time between these two variables can easily be seen from the monthly averages ().
Figure 3. Total discharge and suspended sediment transport (SST) monthly series of the Amazon River for the Óbidos station from April 1984 to July 2016.
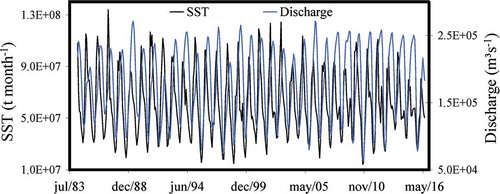
Figure 4. Monthly averages of (a) suspended sediment transport and (b) total discharge of the Amazon River for the Óbidos station. Average and standard deviation were computed for the period April 1984–July 2016.
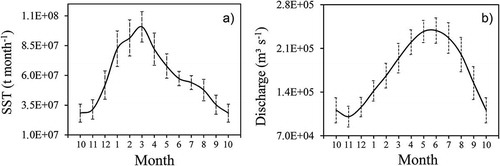
Total discharge and SST show inter-annual fluctuations, with the sediment series having a more uneven pattern than that of the total discharge. Overall, the inter-annual variability of total discharge is small and almost constant throughout the year (), with a little larger standard deviation observed at the falling water period (July–October). However, the SST displays a much larger inter-annual variability, with the maximum variability occurring in the rising water season, the period of the maximum transport rate from December to April.
The SST time series is presented in a unique graphic and it is divided into observed and reconstructed series (). Descriptive statistics from these two series include all the monthly series and minimum and maximum annual values (). We applied the Kolmogorov-Smirnov test to both (reconstructed and observed) SST monthly time series to test the normality and Shapiro-Wilk to test the normality of the minimum and maximum monthly SST values. The results () indicate that both distributions can be assumed as normal; therefore, parametric statistics was applied to test the differences between means and variances of both distributions. As shown in , there is no statistical evidence that the mean, variance and extreme values (minimum and maximum) differ between the two series ( shows a plot of the mean and standard deviation of the time series). This result provides the statistical support for using the reconstructed time series in the time trend analyses.
Table 2. Descriptive statistics of observed and reconstructed monthly suspended sediment transport series.
Table 3. Results of statistical tests for normality. K-S: Kolmogorov-Smirnov test; S-W: Shapiro-Wilk test.
Table 4. Results of statistical tests for homogeneity of variances and equality of means.
Figure 5. Temporal series of observed (April 1984–December 1994) and reconstructed (January 1995–July 2016) monthly values of SST of the Amazon River for the Óbidos station. Continuous lines are the monthly SST averages (green: reconstructed, red: observed) and dashed lines are their standard deviations. [Colours may be seen in the online version.]
![Figure 5. Temporal series of observed (April 1984–December 1994) and reconstructed (January 1995–July 2016) monthly values of SST of the Amazon River for the Óbidos station. Continuous lines are the monthly SST averages (green: reconstructed, red: observed) and dashed lines are their standard deviations. [Colours may be seen in the online version.]](/cms/asset/f8663545-78ff-479f-9aae-a377f575bb22/thsj_a_1546387_f0005_oc.jpg)
With respect to the annual sediment budget, the annual average value is 734.57 Mt ± 6.5%, which is close to that of Martinez et al. (Citation2009) (considering the 31-year series of the full hydrological year; ). This value corresponds roughly to the median of the previous estimates, between the extremes of 1300 and 452 Mt ().
Figure 6. Comparison between the two suspended sediment transport (SST) time spans of the Amazon River. Red: evaluated by Martinez et al. (Citation2009) and black: evaluated in this research. [Colours may be seen in the online version.].
![Figure 6. Comparison between the two suspended sediment transport (SST) time spans of the Amazon River. Red: evaluated by Martinez et al. (Citation2009) and black: evaluated in this research. [Colours may be seen in the online version.].](/cms/asset/cc9e78c9-dcf4-449a-8d84-172e1c1768eb/thsj_a_1546387_f0006_oc.jpg)
4.2 Temporal trend assessment
While the temporal dynamics of the Amazon River discharge has been assessed using large time series (Callède et al. Citation2004, García and Mechoso Citation2005, Marengo Citation2009, Villar et al. Citation2009), the sediment flux trend has been assessed less. We have examined the hypothesis that the Amazon River SST has increased with time. This increase trend, identified by Martinez et al. (Citation2009) and based on a 12-year dataset (1996–2007), represents a decadal trend within the 31-year trend, displayed by our data (). The trend computed by Martinez et al. (Citation2009) is noticeable () between 1996 and 2007. There are other short spans of increase in SST, such as that between 1989 and 1991, but the main point presented by the longer time series is that the overall trend is of a slight decrease in SST with time. The statistical significance of both trends, however, is null for α = 5% (residuals are normally distributed for α = 5%).
We applied the seasonal Kendall test using the monthly SST from April 1984 to July 2016. The results also corroborated that Amazon River SST at Óbidos does not display a systematic trend of increase within the 32.25-year span. Actually, instead of an increase, this test showed a weak but significant decreasing trend (τ = −0.078; p value: 0.02). The increasing trends of the Amazon River SST might be explained by the inter-annual variability in the SST, which increases the probability of mistaking short time trends within long-term trends, as in Martinez et al. (Citation2009).
The use of longer records of SST (32 years) in this research, therefore, does not support the claim that suspended sediment transport in the Amazon River is increasing due to climate change or deforestation. As shown in , the trend reported by Martinez et al. (Citation2009) is no longer observed beyond 2009. The absence of that increasing trend has essential implications for discussions made by Gensac et al. (Citation2016), which assumed the increase in SST in their analyses of the temporal dynamics of suspended sediment at the Amazon River mouth and related estuarine areas occurs mainly northward of the mouth.
Human activities may have the potential for significantly changing the SST in the Amazonian rivers at local scale, such as the gold mining in the Tapajós Basin (Lobo et al. Citation2014), but our results indicate that these activities have not caused any significant increase in the SST at the lower Amazon River at Óbidos in the past three decades.
However, the decreasing trend identified by the seasonal Kendall test might be an early signal due to the recent building of large dams in the Madeira River (Latrubesse et al. Citation2017). In 2012 the Jirau and Santo Antônio dams were inaugurated. However, as the construction period started in 2008 and Martinez et al. (Citation2009) series ended in 2007, the series could not grasp the extent of the dam impact. As the Madeira River is responsible for approximately half of the Amazon River suspended load (Meade Citation1994), changes in its transport rate would have the potential for modifying the Amazon sediment transport (Latrubesse et al. Citation2017). Reservoir construction is mentioned as probably the most important cause of human-induced change on land–ocean sediment fluxes (Walling and Fang Citation2003). These authors show many examples of SST decreasing trends in dammed rivers around the world: Nile (Africa), Colorado and Mississippi (USA) and Danube (Romania), but it must be noted that those basins have a much smaller area and water volume and have been subject to land-use and land-cover changes for larger time spans.
This context of suspended sediment decreasing trend from 2008 to the present is only speculative, however. By analysing the annual time series (), we may observe that the period from 1996 to 2000 (pre-damming) presents values as low as those for the years 2011 and 2015 (post-damming), indicating that those inter-annual changes in SST may be induced by climate forcings (Marengo Citation2009).
The lack of an increase trend in SST shown in our results does not support the hypothesis that within the past three decades changes in total precipitation, induced by the global climate changes and/or land-cover changes induced by the deforestation, are causing a noticeable growth in the SST of the Amazon River. Moreover, as pointed out in the literature (e.g. Hayhoe et al. Citation2011), the contribution of storm flow to streamflow did not differ significantly between areas of agriculture and forest cover based on studies carried out in the Amazon. Therefore, the energy available for soil erosion and transport to rivers might well be similar.
Regarding the hydrological cycle intensification indicated by the increase in precipitation rates from 1990 to 2009, mainly in the northern Amazon Basin (Gloor et al. Citation2013), it is important to point out that this is a region characterized by flat lowland with minimum sediment yield (Filizola and Guyot Citation2009). Actually, the southern portion of the basin, the Bolivian Andes, is the region responsible for the largest sediment yield in the Amazon Basin (Latrubesse and Restrepo Citation2014). Therefore, the recent hydrological intensification reported by Gloor et al. (Citation2013) in the northern Amazon would not be able to explain the increase in SST reported by Martinez et al. (Citation2009).
In the context of long-term evaluation of hydro-meteorological variables, Marengo (Citation2009) stated that there have been no systematic unidirectional trends towards drier or wetter conditions since the 1920s. Rather than a unidirectional trend, Marengo (Citation2009) mentioned the existence of rainfall cycles in the basin (of decadal and multidecadal scales). Therefore, sediment transport fluctuations observed in the lower Amazon river are probably related to these hydrological cycles.
However, a direct comparison between the precipitation in the Andes and the sediment transport of the Amazon River may not result in clear relationships. A lag time in the sediment flux response to the rainfall could make analysis difficult. Additionally, the Amazonian fluvial plain has complex feedback mechanisms of sediment deposition and erosion (Dunne et al. Citation1998, Rudorff et al. Citation2018). Therefore, a deeper understanding of the importance of the role of each variable on the inter-annual sediment transport oscillation at the lower Amazon River is still needed.
5 Conclusions
Based on an empirical model, we built a 32-year time series of SST (1984–2016) using Landsat TOA reflectance as input variable. A series of statistical analyses indicated that the time series was sufficiently robust to be used as input to time trend analyses of the SST, both parametric and nonparametric. The results do not support previous claims reported in the literature of a systematic trend of increase in the Amazon River SST. The results of this research also indicated that the major limitation for assessing time trends of environmental variables, such as SST, is the size of the time series. The previous studies reporting the increase in SST were based on short time series, which were not able to grasp the large inter-annual variability in suspended sediment concentration. The availability of the Landsat images database spanning from the early 1970s to the present represents a unique opportunity to build lengthier time series of SST in sub-basins within the Amazon Basin, to investigate at which spatial scales land-use changes might affect the SST time trends. Our results indicated that the method adopted herein is simple and feasible.
Obidos Station Scenes.KMZ
Download (913 B)Acknowledgements
We would like to thank both reviewers for their comments on the paper.
Disclosure statement
No potential conflict of interest was reported by the authors.
Supplementary Material
Supplementary data for this article can be accessed here
Additional information
Funding
Notes
1 The Observation Service SO HYBAM (formerly Environmental Research Observatory, ORE) “Geodynamical, hydrological and biogeochemical control of erosion/alteration and material transport in the Amazon, Orinoco and Congo basins”.
Related Research Data
References
- Aalto, R., Dunne, T., and Guyot, J.L., 2006. Geomorphic controls on Andean denudation rates. Journal of Geology, 114 (1), 85–99. doi:10.1086/498101
- Anderson, P.G., Taylor, B.R., and Balch, G.C. 1996. Quantifying the effects of sediment release on fish and their habitats. Canadian Manuscript Report of Fisheries and Aquatic Sciences, (2346), 110.
- Armijos, E., et al., 2013. Suspended sediment dynamics in the Amazon River of Peru. Journal of South American Earth Sciences, 44, 75–84. doi:10.1016/j.jsames.2012.09.002
- Armijos, E., et al., 2017. Measuring and modeling vertical gradients in suspended sediments in the Solimões/Amazon River. Hydrological Processes, 31, 654–667. doi:10.1002/hyp.11059
- Berry, W., Rubinstein, N., and Melzian, B., 2003. The biological effects of suspended and bedded sediment (SABS) in aquatic systems: a review. Duluth: United States Environmental Protection Agency, Internal Report.
- Callède, J., et al., 2004. Evolution du débit de l’Amazone à Óbidos de 1903 à 1999. Hydrological Sciences Journal, 49 (1), 85–97. doi:10.1623/hysj.49.1.85.53992
- Chakrapani, G.J., 2005. Factors controlling variations in river sediment loads. Current Science, 88 (4), 569–575.
- Cohen, S., Kettner, A.J., and Syvitski, J.P., 2014. Global suspended sediment and water discharge dynamics between 1960 and 2010: continental trends and intra-basin sensitivity. Global and Planetary Change, 115, 44–58. doi:10.1016/j.gloplacha.2014.01.011
- Constantine, J.A., et al., 2014. Sediment supply as a driver of river meandering and floodplain evolution in the Amazon basin. Nature Geoscience, 7 (12), 899–903. doi:10.1038/ngeo2282
- Curran, P.J. and Novo, E.M.L.M., 1988. The relationship between suspended sediment concentration and remotely sensed spectral radiance: a review. Journal of Coastal Research, 4, 351–368.
- Dunne, T., et al., 1998. Exchanges of sediment between the floodplain and channel of the Amazon River in Brazil. Geological Society of America Bulletin, 110, 450–467. doi:10.1130/0016-7606(1998)110<0450:EOSBTF>2.3.CO;2
- Feng, L., et al., 2014. Influence of the Three Gorges Dam on total suspended matters in the Yangtze Estuary and its adjacent coastal waters: observations from MODIS. Remote Sensing of Environment, 140, 779–788. doi:10.1016/j.rse.2013.10.002
- Filizola, N., 2003. Transfert sédimentaire actuel par les fleuves amazoniens. Thesis (PhD). Paul Sabatier University, Tolouse,. 292.
- Filizola, N., et al., 2011. The significance of suspended sediment transport determination on the Amazonian hydrological scenario. In: A.J. Manning, et al., eds., Sediment transport in aquatic environments. Rijeka, Croatia: INTECH Open Access Publisher, 45–64. doi:10.5772/19948
- Filizola, N. and Guyot, J.L., 2009. Suspended sediment yield in the Amazon Basin: an assessment using Brazilian National data set. Hydrological Processes, 23 (22), 3207–3215. doi:10.1002/hyp.7394
- Filizola, N. and Guyot, J.L., 2011. Fluxo de sedimentos em suspensão nos rios da Amazônia. Revista Brasileira de Geociências, 41 (4), 566–576. doi:10.25249/0375-7536.2011414566576
- García., N.O. and Mechoso, C.R., 2005. Variability in the discharge of South American rivers and in climate. Hydrological Sciences Journal, 50 (3), 459–478. doi:10.1623/hysj.50.3.459.65030
- Gensac, E., et al., 2016. Seasonal and inter-annual dynamics of suspended sediment at the mouth of the Amazon river: the role of continental and oceanic forcing, and implications for coastal geomorphology and mud bank formation. Continental Shelf Research, 118, 49–62. doi:10.1016/j.csr.2016.02.009
- Gibbs, R.J., 1967a. The geochemistry of the Amazon River system: part I. The factors that control the salinity and the composition and concentration of the suspended solids. Geological Society of America Bulletin, 78 (10), 1203–1232. doi:10.1130/0016-7606(1967)78[1203:TGOTAR]2.0.CO;2
- Gibbs, R.J., 1967b. Amazon river: environmental factors that control its dissolved and suspended load. Science, 156 (3783), 1734–1737. doi:10.1126/science.156.3783.1734
- Gloor, M., et al., 2013. Intensification of the Amazon hydrological cycle over the last two decades. Geophysical Research Letters, 40, 1729–1733. doi:10.1002/grl.50377
- Gray, J.R., 2000. Comparability of suspended-sediment concentration and total suspended solids data. U. S. Geological Survey Water-Resources Investigations Report 00-4191. 14.
- Guyot, J.L., et al., 2007. Suspended sediment yield of the Amazon river: an increasing budget from 1995 to 2006, using river sampling and MODIS data. In: IUGG XXIV General Assembly, 2–13 July, Perugia. Italy.
- Guyot, J.L., et al., 2011. Hydrology and sediment transport in the Amazon Basin, from the Andes to the ocean. In: Proceedings of the International Conference on Status and future of the world's large rivers, 11–14 April, Vienna, Austria.
- Guyot, J.L., Filizola, N., and Laraque, A., 2005. Régime et bilan duflux sédimentaire de l’Amazone à Óbidos (Pará, Brésil) de 1995 à 2003. In: Proceedings of Sediment Budget symposium held during the Seventh IAHS Scientific Assembly, 291. Foz do Iguaçu, Brazil: IAHS Publication, 347–354.
- Hayhoe, S.J., et al., 2011. Conversion to soy on the Amazonian agricultural frontier increases streamflow without affecting stormflow dynamics. Global Change Biology, 17, 1821–1833. doi:10.1111/j.1365-2486.2011.02392.x
- Helsel, D.R. and Hirsch, R.M., 2002. Trend Analysis. In: D.R. Helsel and R.M. Hirsch, eds. Statistical methods in water resources [online]. United States Geological Survey, 323–355. Available from: https://pubs.usgs.gov/twri/twri4a3/pdf/twri4a3-new.pdf [Accessed 11 Apr 2013].
- Holeman, J.N., 1968. The sediment yield of major rivers of the world. Water Resources Research, 4 (4), 737–747. doi:10.1029/WR004i004p00737
- Kaba, E., Philpot, W., and Steenhuis, T., 2014. Evaluating suitability of MODIS-Terra images for reproducing historic sediment concentrations in water bodies: lake Tana, Ethiopia. International Journal of Applied Earth Observation and Geoinformation, 26, 286–297. doi:10.1016/j.jag.2013.08.001
- Kerr, S.J. 1995. Silt, turbidity and suspended sediments in the aquatic environment: an annotated bibliography and literature review. Ontario Ministry of Natural Resources, Southern Region Science & Technology Transfer Unit, Technical Report TR-008.
- Kilham, N.E. and Roberts, D., 2011. Amazon river time series of surface sediment concentration from MODIS. International Journal of Remote Sensing, 32 (10), 2659–2679. doi:10.1080/01431161003713044
- Kjelland, M.E., et al., 2015. A review of the potential effects of suspended sediment on fishes: potential dredging-related physiological, behavioral, and transgenerational implications. Environment Systems and Decisions, 35 (3), 334–350. doi:10.1007/s10669-015-9557-2
- Kosuth, P., et al., 2009. Sea‐tide effects on flows in the lower reaches of the Amazon River. Hydrological Processes, 23 (22), 3141–3150. doi:10.1002/hyp.7387
- Laraque, A., Filizola, N., and Guyot, J.L., 2005. Variations spatiotemporelles du bilan sédimentaire dans le bassin amazonien brésilien, à partir d’un échantillonnage décadaire. In: D.E. Walling and A.J. Horowitz, eds. Proceedings of symposium S1 held during the Seventh IAHS Scientific Assembly, April. Foz do Iguaçu, Brazil: IAHS, 250–258.
- Latrubesse, E., et al., 2017. Damming the rivers of the Amazon basin. Nature, 546, 363–369. doi:10.1038/nature22333
- Latrubesse, E. and Franzinelli, E., 2002. The Holocene alluvial plain of the middle Amazon River, Brazil. Geomorphology, 44, 241–257. doi:10.1016/S0169-555X(01)00177-5
- Latrubesse, E. and Restrepo, J.D., 2014. Sediment yield along the Andes: continental budget, regional variations, and comparisons with other basins from orogenic mountain belts. Geomorphology, 216 (1), 225–233. doi:10.1016/j.geomorph.2014.04.007
- Lobo, F.L., Costa, M.P.F., and Novo, E.M.L.M., 2014. Time-series analysis of Landsat-MSS/TM/OLI images over Amazonian waters impacted by gold mining activities. Remote Sensing of Environment, 157, 170–184. doi:10.1016/j.rse.2014.04.030
- Lodhi, M.A., et al., 1997. The potential for remote sensing of loess soils suspended in surface waters. Journal of the American Water Resources Association, 33, 111–117. doi:10.1111/j.1752-1688.1997.tb04087.x
- Long, C.M. and Pavelsky, T.M., 2013. Remote sensing of suspended sediment concentrations and hydrologic connectivity in a complex wetland environment. Remote Sensing of Environment, 129, 197–209. doi:10.1016/j.rse.2012.10.019
- Mangiarotti, S., et al., 2013. Discharge and suspended sediment flux estimated along the mainstream of the Amazon and the Madeira Rivers (from in situ and MODIS satellite data). International Journal of Applied Earth Observation and Geoinformation, 21, 341–355. doi:10.1016/j.jag.2012.07.015
- Marchetto, A. 2015. Package “rkt” - Mann-Kendall test, seasonal and regional Kendall tests. Technical report.
- Marengo, J.A., 2009. Long-term trends and cycles in the hydrometeorology of the Amazon basin since the late 1920s. Hydrological Processes, 23 (22), 3236–3244. doi:10.1002/hyp.7396
- Martinelli, L., et al., 1989. Suspended sediment load in the Amazon basin: an overview. GeoJournal, 19 (4), 381–389. doi:10.1007/BF00176907
- Martinez, J.M., et al., 2009. Increase in suspended sediment discharge of the Amazon River assessed by monitoring network and satellite data. Catena, 79 (3), 257–264. doi:10.1016/j.catena.2009.05.011
- Martins, V.S., et al., 2017. Validation of high-resolution MAIAC aerosol product over South America. Journal of Geophysical Research: Atmospheres, 7, 7537–7558. doi:10.1002/2016JD026301
- Matthews, M.W., Bernard, S., and Winter, K., 2010. Remote sensing of cyanobacteria-dominant algal blooms and water quality parameters in Zeekoevlei, a small hypertrophic lake, using MERIS. Remote Sensing of Environment, 114 (9), 2070–2087. doi:10.1016/j.rse.2010.04.013
- Meade, R.H., et al., 1979. Sediment loads in the Amazon River. Nature, 278 (5700), 161–163. doi:10.1038/278161a0
- Meade, R.H., et al., 1985. Storage and remobilization of suspended sediment in the lower Amazon River of Brazil. Science, 228 (4698), 488–490. doi:10.1126/science.228.4698.488
- Meade, R.H., 1994. Suspended sediments of the modern Amazon and Orinoco Rivers. Quaternary International, 21, 29–39. doi:10.1016/1040-6182(94)90019-1
- Mertes, L.A.K., 1994. Rates of flood-plain sedimentation on the central Amazon River. Geology, 22 (2), 171–174. doi:10.1130/0091-7613(1994)022<0171:ROFPSO>2.3.CO;2
- Mertes, L.A.K., Smith, M.O., and Adams, J.B., 1993. Estimating suspended sediment concentrations in surface waters of the Amazon River Wetlands from landsat images. Remote Sensing of Environment, 43, 281–301. doi:10.1016/0034-4257(93)90071-5
- Montanher, O.C., et al., 2014. Empirical models for estimating the suspended sediment concentration in Amazonian white water rivers using Landsat 5/TM. International Journal of Applied Earth Observation and Geoinformation, 29, 67–77. doi:10.1016/j.jag.2014.01.001
- Nanson, G.C. and Croke, J.C., 1992. A genetic classification of floodplains. Geomorphology, 4, 459–486. doi:10.1016/0169-555X(92)90039-Q
- Nittrouer, C.A., et al., 1995. An introduction to the geological significance of sediment transport and accumulation on the Amazon continental shelf. Marine Geology, 125 (3–4), 177–192. doi:10.1016/0025-3227(95)00075-A
- Oltman, R.E., 1968. Reconnaissance investigations of the discharge and water quality of the Amazon River. United States Geologial Survey (USGS) circular, 552. Washington, DC: US Government Printing Office.
- Park, E. and Latrubesse, E.M., 2014. Modeling suspended sediment patterns of the Amazon river using MODIS data. Remote Sensing of Environment, 147, 232–242. doi:10.1016/j.rse.2014.03.013
- Park, E. and Latrubesse, E.M., 2015. Surface water types and sediment distribution patterns at the confluence of mega rivers: the Solimões-Amazon and Negro Rivers junction. Water Resources Research, 51, 6197–6213. doi:10.1002/2014WR016757
- Pierce, A.R. and King, S.L., 2008. Spatial dynamics of overbank sedimentation in flood-plain systems. Geomorphology, 100, 256–268. doi:10.1016/j.geomorph.2007.12.008
- Richey, J.E., et al., 1986. Water discharge and suspended sediment concentrations in the Amazon River: 1982-1984. Water Resources Research, 22 (5), 756–764. doi:10.1029/WR022i005p00756
- Ritchie, J.C. and Shiebe, F.R., 2000. Water quality. In: G.A. Shultz and E.T. Engman, eds. Remote sensing in hydrology and water management. Berlin, Germany: Springer, 287–303.
- Rudorff, C.M., Dunne, T., and Melack, J.M., 2018. Recent increase of river–floodplain suspended sediment exchange in a reach of the lower Amazon River. Earth Surface Processes and Landforms, 43, 322–332. doi:10.1002/esp.4247
- Strasser, M.A., Vinzon, S.B., and Mascarenhas, F.C.B. 2004. Transporte de sedimentos de arraste no rio Amazonas. In: Third International LBA Scientific Conference, 27–29 July, Brasilia, Brazil.
- Syvitski, J.P., et al., 2005. Impact of humans on the flux of terrestrial sediment to the global coastal ocean. Science, 308 (5720), 376–380. doi:10.1126/science.1109454
- Tebbs, E.J., Remedios, J.J., and Harper, D.M., 2013. Remote sensing of chlorophyll-a as a measure of cyanobacterial biomass in Lake Bogoria, a hypertrophic, saline-alkaline, flamingo lake, using Landsat ETM+. Remote Sensing of Environment, 135, 92–106. doi:10.1016/j.rse.2013.03.024
- Villar, J.C.E., et al. 2009. Evolución regional de los caudales en el conjunto de la cuenca del Amazonas para el período 1974-2004 y su relación con factores climáticos. Revista Peruana Geo-atmosférica, 1, 1–11.
- Villar, R.E., et al., 2012. The integration of field measurements and satellite observations to determine river solid loads in poorly monitored basins. Journal of Hydrology, 444, 221–228. doi:10.1016/j.hydrol.2012.04.024
- Villar, R.E., et al., 2013. A study of sediment transport in the Madeira River, Brazil, using MODIS remote-sensing images. Journal of South American Earth Sciences, 44, 45–54. doi:10.1016/j.jsames.2012.11.006
- Walling, D.E. and Fang, D., 2003. Recent trends in the suspended sediment loads of the world’s rivers. Global and Planetary Change, 39 (1), 111–126. doi:10.1016/S0921-8181(03)00020-1
- Walling, D.E., Owens, P.N., and Leeks, G.J., 1998. The role of channel and floodplain storage in the suspended sediment budget of the River Ouse, Yorkshire, UK. Geomorphology, 22 (3–4), 225–242. doi:10.1016/S0169-555X(97)00086-X
- Wittmann, H., et al., 2011. Sediment production and delivery in the Amazon River basin quantified by in situ-produced cosmogenic nuclides and recent river loads. Geological Society of America Bulletin, 123 (5–6), 934–950. doi:10.1130/B30317.1