
 ?Mathematical formulae have been encoded as MathML and are displayed in this HTML version using MathJax in order to improve their display. Uncheck the box to turn MathJax off. This feature requires Javascript. Click on a formula to zoom.
ABSTRACT
In this present era of the Anthropocene, human activities affect hydrology and droughts. Quantifying this human influence improves our understanding and builds fundamental knowledge for water resource management. Analysis of observation data is useful in progressing this knowledge as these human activities and feedbacks are intrinsically included. Therefore, here we present an observation-based approach, the upstream–downstream comparison, to quantify changes in hydrological drought downstream of a human activity. We demonstrate this approach in a basin in northern Chile, where a reservoir was introduced. A sensitivity analysis is performed to assess how different choices of drought analysis threshold can affect the results and interpretation. We find that many commonly used choices do not exclude human activities from the threshold and therefore could be underestimating the change detected due to the human influence. The upstream–downstream comparison avoids this through the application of the upstream station threshold rather than the human-influenced downstream station.
Editor A. Castellarin Associate editor I. Overton
1 Introduction
Drought is an important natural hazard which can lead to severe environmental and socio-economic impacts in many regions of the world, with losses in agriculture, damage to natural ecosystems and social disruption (Prudhomme et al. Citation2014, Vicente-Serrano et al. Citation2014). Drought is regarded as a deficit in available water compared to the normal conditions. “Normal” is based on an average established over a certain period (e.g. 30 years) or a defined level. Drought identification can be established for a range of variables, such as precipitation (meteorological drought), soil moisture (agricultural drought) and streamflow or groundwater (hydrological drought). This study focuses on hydrological drought, identified by streamflow deficit.
Classically, most drought definitions consider it to be a natural phenomenon, with climate variability as the only driver of drought. However, recently there has been a call to acknowledge and include the anthropogenic influence on drought, drought processes and propagation (AghaKouchak et al. Citation2015, Wanders and Wada Citation2015, Van Loon et al. Citation2016). Anthropogenic activities can cause, exacerbate or alleviate drought situations (Vogel and Drummond Citation1993, Van Oel et al. Citation2017) through directly and indirectly affecting natural drought propagation and processes (e.g. in Van Loon et al. Citation2016). For example, human activities can affect the amount of surface runoff and infiltration (e.g. through land use practices, urbanization, deforestation), water availability (e.g. through water abstraction, irrigation, reservoirs) and water storage (e.g. through reservoirs). In recent years research has started to investigate the anthropogenic impact on drought (e.g. Van Loon and Van Lanen Citation2013, Wada et al. Citation2013, Mehran et al. Citation2015, Wanders and Wada Citation2015). There is a need to quantify the relative importance of human activities as a driver, contributor or alleviator of hydrological drought. This would improve our knowledge on how human activities are impacting on drought to enable better drought preparation and mitigation, as well as improve hydrological modelling. However, this quantification is difficult as current research is done with a variety of approaches and tools designed for operating in an undisturbed situation.
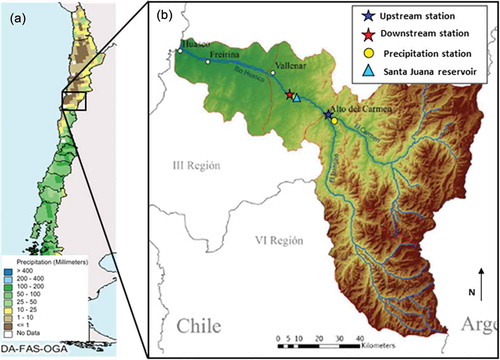
Figure 1. Huasco basin: (a) identified on a map of annual precipitation of Chile (DA-FAS-OGA) and (b) topographical map of the basin (adapted from Wagnitz et al. Citation2014; Fig.1)
To quantify the difference in hydrological droughts due to anthropogenic activities, a common approach is through a comparison of the natural condition with the human-influenced situation. Typically, observed discharge data can be used to represent the human-influenced situation if known human activities are present. However, we also need to know the conditions that would have occurred naturally for the same location during the observation period. Existing research mainly uses hydrological modelling to simulate this natural situation (e.g. Van Loon and Van Lanen Citation2013, Wada et al. Citation2013). Modelling allows a direct comparison between two simulated datasets, natural and human-influenced (e.g. Van Loon Citation2015; Wanders and Wada Citation2015), or the comparison between observation data as the human-influenced dataset and its modelled naturalized situation (e.g. observation–modelling framework, Van Loon and Van Lanen Citation2013, Citation2015). However the modelling data might not always be available, be of high enough quality that they can be trusted, or adequately represent and include human activities (e.g. Srinivasan et al. Citation2017).
Observation data are extremely valuable as they include the real natural condition and the human activities and responses that we aim to quantify. There are only a limited number of publications that have quantified the human impact on hydrological droughts in case studies using observation data (e.g. López-Moreno et al. Citation2009, Van Dijk et al. Citation2013, Van Loon and Van Lanen Citation2013, Wang et al. Citation2015, Liu et al. Citation2016a). Often this may be because it can be difficult to find an exact observed “natural” proxy to allow for a quantitative comparison. To address this, three different approaches can be taken: (a) different time periods can be used with an undisturbed period to represent natural conditions (e.g. pre- and post-disturbance); (b) different catchments can be compared with an undisturbed catchment for the comparison (e.g. paired catchments); or (c) different stations within the same catchment can be used where an upstream station represents natural conditions (e.g. upstream–downstream). In some studies, the pre- and post-disturbance comparison uses the period before a disturbance as natural conditions to compare directly with the human-influenced situation after the disturbance (e.g. Liu et al. Citation2016a, Citation2016b), but is then limited by the meteorological forcing of the two periods not being similar, and therefore different drought events are compared (Peñas et al. Citation2016). Paired catchments trade space for time and allow a comparison of the same time period; however, it can be extremely difficult to find a similar enough natural catchment for the pairing (Rangecroft et al. Citation2018). To avoid both of these limitations, here we explore the use of upstream–downstream observation data within a catchment.
The upstream–downstream comparison method assesses the hydrological impact of change between two discharge stations spatially distributed along a river, upstream and downstream of a human activity. The upstream data are used as a proxy for natural conditions and the downstream data represent the human-influenced situation. Observation data downstream contain the same influences as upstream, plus the human activity. The approach has been used elsewhere in hydrology, for example to study changes in water quality and quantity downstream (e.g. Ren et al. Citation2002, Azrina et al. Citation2006), but has rarely been used to look at hydrological droughts specifically (limited examples, e.g. López-Moreno et al. Citation2009, Wu et al. Citation2009). The biggest advantage of this method is that it uses the same time period for analysis, in contrast to methods that compare pre- and post-disturbance periods, which suffer from confounding factors, such as different meteorological droughts in the pre- and post-disturbance periods.
It is known that the exploration of streamflow discharges and the severity and frequency of hydrological droughts in upstream and downstream stations helps in understanding the influence of human activities on low flows (López-Moreno et al. Citation2009, Wu et al. Citation2009). To identify drought events using observation data, drought thresholds based on individual stations can be calculated and applied (e.g. López-Moreno et al. Citation2009); however, human activities are then already incorporated into the threshold of the human-influenced station, affecting drought identification. Instead, the threshold can be calculated from the natural situation, such as the pre-disturbed time period (e.g. Van Loon and Van Lanen Citation2013, p. 2015) or modelled natural streamflow (e.g. Wanders and Wada Citation2015), or from an upstream station. This natural threshold can then be applied to both the natural and human-influenced data to identify drought events compared to natural conditions. The effect of these choices in drought analysis on quantification of human influence on drought has not been explored in the literature.
The aim of this paper is to demonstrate this observation-data-driven upstream–downstream approach to quantify the human influence on hydrological droughts downstream of a human activity. Through a sensitivity analysis of three variations of threshold used to identify drought events, we assess the impact of different drought analysis choices on results and interpretation: (a) the variable threshold and the fixed threshold; (b) the use of a reference period or the use of the whole time period for calculating the threshold; and (c) the use of individual stations for the threshold, or the use of the upstream station only for calculating the threshold. This enables us to assess the effects that our choices have when working in the Anthropocene to quantify the human influence.
To address the aims of the paper, we demonstrate the approach through a place-based example from Chile. The upstream–downstream comparison can be used to quantify a range of different human activities, but here we use the introduction of a reservoir.
2 Methods and data
Drought analyses were conducted on observed discharge time series data (Section 2.1) to identify drought events and characteristics (Section 2.2) upstream and downstream of a human activity (e.g. a reservoir). A direct comparison between drought events upstream and downstream quantified the change downstream associated to the human activity (Section 2.3). We additionally performed a sensitivity analysis, in which we compared results obtained with different drought analysis methods, to assess the effect that drought analysis choices have (Section 2.4).
Here we use the term hydrological drought to represent droughts in streamflow. The methodology presented here concerns hydrological drought analysis unless otherwise specified. Precipitation observations were also analysed for both time periods to assess the similarities in meteorological droughts in the pre- and post-dam data.
2.1 Case study observation data
We analysed observation data (1965–2013) from the Huasco basin in arid northern Chile (28–29°S) () to quantify the influence of the Santa Juana dam (operating by 1998) on downstream droughts. Downstream agricultural users rely heavily on the water resources from the upper catchments, with glacier meltwater and snowmelt being important contributors to streamflow (Viviroli et al. Citation2007, Favier et al. Citation2009). The region experiences wet and dry seasons with ~80% of annual precipitation occurring during the wet season, the Chilean winter (May–August), with year-to-year precipitation variation partially related to the El Niño Southern Oscillation (ENSO) (Montecinos et al. Citation2000, Gascoin et al. Citation2011).
The observation data for this study comprised daily precipitation and discharge covering the time period 1965–2013, obtained from the Chilean government’s General Water Direction (Dirección General de Aguas, DGA). One precipitation station was analysed for meteorological droughts in the basin and two discharge stations for hydrological droughts, one upstream (Qup) of the Santa Juana dam representing the “natural” condition (without a reservoir) and one downstream (Qdown) of the dam representing the “human-influenced” condition. The two stations are located 18 km apart along the same river stretch (). The catchment areas of the upstream and downstream stations are 1030 and 1520 km2, respectively.
Daily hydrological data were converted into monthly summed data and converted into specific discharge (in mm/month) to allow a direct comparison between stations with different catchment areas. The Santa Juana dam construction started in 1996 and was in operation by 1998, therefore the pre-dam observation period was classified as 1965–1996. An upstream–downstream approach was used on the discharge data to directly compare droughts upstream and downstream during the post-dam period (1998–2013). Similarities in the upstream and downstream discharge data can be seen throughout the pre-dam period, giving confidence in the use of these stations ().
Figure 2. Monthly discharge data for upstream (blue) and downstream (red) stations before and after the construction of the dam. Data are missing for the period May 1986 to January 1988 at the downstream station
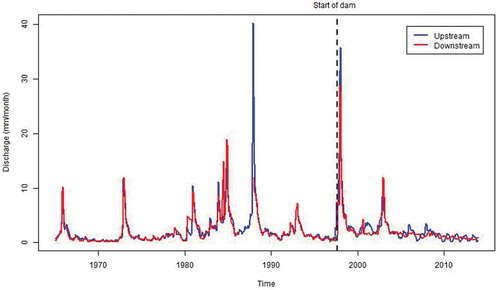
Available station data for analysis were limited by their data quality and time periods. The stations used had missing data of less than 5%. Missing data for hydrological records were replaced by linear interpolation, a common method for filling when gaps are not of significant length (Hisdal et al. Citation2004). Missing data for the precipitation record were replaced with zeros, an approach that can be taken for precipitation data specifically (Jolly and Running Citation2004).
2.2 Drought analysis
The threshold level method was used to identify drought events and characteristics. The threshold level method is a commonly used method, frequently applied for quantitative drought definition (Tallaksen and Van Lanen Citation2004, Vicente-Serrano et al. Citation2004, Van Loon Citation2015). Drought events can be identified as periods during which the data (river flow, precipitation, etc.) are below a certain threshold (Yevjevich Citation1967). Thresholds based on percentiles of the flow duration curve are commonly employed, with a recommended threshold of between the 70th and 90th percentile for a daily or monthly time series (Van Loon Citation2015). Therefore the 80th percentile (Q80) is frequently used as the threshold for determining a drought (Hisdal and Tallaksen Citation2000, Fleig et al. Citation2006, Heudorfer and Stahl Citation2016) and is used here for identifying hydrological droughts; Q80 is the streamflow value that is equalled or exceeded for 80% of the time. To calculate the threshold, ideally at least 30 years of data are used to establish the “norm” from the flow duration curve (McKee et al. Citation1993).
To quantify the human influence we followed the proposed hydrological drought analysis methodology. To avoid the incorporation of human actions in the threshold itself, we used the upstream station to act as a proxy for “natural conditions” and establish the threshold. We used the whole time period of observation data (1965–2013) for the upstream station to calculate the 80th percentile threshold. This threshold was then applied to both the upstream and downstream data for the post-dam time period. This allowed a direct comparison of the impact of the human activity on hydrological droughts (e.g. Van Loon and Van Lanen Citation2013).
Minor drought events, which are events of short duration and/or small deficit volume, can be removed from the analysis using a defined minimum duration. Monthly data were analysed, and therefore, to avoid identifying droughts with the same length as the resolution of analysis, minor droughts of only one month duration were excluded from the analysis. Drought event characteristics such as frequency, timing, duration and deficit volumes were extracted.
For the meteorological drought analysis, the 50th percentile threshold was used to avoid a threshold of zero, which is common practice for semi-arid/arid regions (Van Huijgevoort et al. Citation2012, Giannikopoulou et al. Citation2014).
2.3 Estimation of the human impact on hydrological drought characteristics
To estimate the percentage change of hydrological droughts downstream due to the human influence, drought characteristics of the upstream and downstream stations were compared during the disturbed period, i.e. the post-dam period (1998–2013). Drought characteristics of frequency, duration (average, maximum and total) and deficit volume (average, maximum and total) were analysed across the 17-year post-dam period. For each drought characteristic (DC), an estimation of the human impact was calculated using the following equation:
where ΔDC is the percentage change in DC due to human influence. Resulting negative values would indicate that the human activity alleviates drought characteristics downstream, whereas positive values show that the human activity aggravates downstream drought characteristics.
2.4 Sensitivity analysis
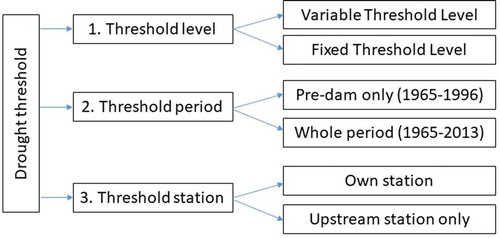
Various approaches to analysing drought events have been used in the international literature. However, decisions regarding specifics of the drought analysis threshold could affect the results and interpretations made when assessing the human influence on droughts. To assess the implication of these choices, a sensitivity analysis was conducted between three main variations of the drought analysis threshold within the upstream–downstream comparison: (a) threshold level method: variable or fixed threshold (Section 2.4.1); (b) threshold time period: whole time period or pre-dam time period threshold only (Section 2.4.2); and (c) threshold station: own thresholds or upstream-station threshold only (Section 2.4.3) (). A difference in threshold percentile (70th or 90th instead of 80th) was not studied here as the effect is assumed to be small. Previous studies have found that changing the percentile used for calculating the threshold level slightly changes the magnitude but not the direction of change (e.g. Van Loon and Van Lanen Citation2013, Heudorfer and Stahl Citation2016).
Figure 3. Diagram of the sensitivity analysis conducted: three different drought threshold variations (threshold level, threshold period, threshold station) with two options for each
2.4.1 Variation 1: threshold level
When using the threshold level method, a fixed or variable threshold level can be applied to identify drought events (Tallaksen et al. Citation1997, Hisdal and Tallaksen Citation2000, Fleig et al. Citation2006). Both are commonly used for drought analysis. The variable threshold level is useful when there is seasonality in the data as it allows to the identification of droughts in the high flow season as well as in the low flow season. Standardized indicators (e.g. standardized precipitation index, SPI, for precipitation and standardized streamflow index, SSI, or alternatively termed standardized runoff index, SRI, for discharge) are comparable to a variable threshold because they calculate the anomaly compared to the climatology of the same month. The fixed threshold, on the other hand, establishes a single value for the 80th percentile of the entire time series, regardless of the month. The fixed threshold level is generally more applicable in situations with limited seasonality in the discharge data. It has recently been found by Heudorfer and Stahl (Citation2016) that the choice of method affects the drought events identified and the interpretation of the results. Therefore, it is important to understand how this decision affects the results of interpreting the human influence on drought. In the sensitivity analysis we apply both the variable and the fixed threshold level () to assess how this might affect the results.
2.4.2 Variation 2: threshold time period
Secondly, the time period used to calculate the threshold can vary. Often only a pre-disturbance period (sometimes termed undisturbed, baseline or reference period) is used to determine the threshold for studies looking at a disturbance period (e.g. Wang et al. Citation2009, Van Loon and Van Lanen Citation2013, Liu et al. Citation2016a). Transferring the threshold from one time period (e.g. historical) to the analysis period is also commonly used in future drought studies to assess changes between periods (e.g. Van Tiel et al. Citation2018). However, this approach then does not include the climatic characteristics of the study period in the analysis (e.g. during the post-dam period), which could be relevant for the study.
Thus, in the sensitivity analysis, we explore two different options for the threshold time period (). Firstly, we use the pre-dam period only (1965–1996) to calculate the threshold for analysis in the post-dam period. We also use the whole period observation data (1965–2013) to establish the threshold. However, it is important to note that, when using the whole time period, combined with own station thresholds (Section 2.4.3), the downstream station data will contain effects of human activities, and therefore these will be incorporated into the threshold, affecting the quantification of the human influence.
2.4.3 Variation 3: threshold station
Finally, the threshold for drought analysis is often established based on the individual station data (e.g. López-Moreno et al. Citation2009, Wang et al. Citation2009, Liu et al. Citation2016a). This use of the own station data to establish the normal against which the droughts are identified is also similar to how the standardized indicators (e.g. SPI, SSI) are commonly applied. However, downstream station observation data contain the effect of human activities during the post-dam period. Therefore, this threshold will include the changes due to human activities, rather than representing the natural threshold needed to allow a comparison.
A threshold established based on “natural conditions” only can help to separate the human activities from the threshold for drought identification. Here, the upstream station acts as a proxy for the natural situation. The threshold from the upstream station can be applied to both the upstream and the downstream station for drought identification. This is similar to using the simulated natural threshold in drought modelling studies (e.g. Wanders and Wada Citation2015, He et al. Citation2017). In the sensitivity analysis we test the difference of using own station data for the threshold, or the application of just the upstream station for the threshold to represent the natural condition (). This is a variation that has not yet been explored in the literature, but could affect the results significantly.
3 Results
3.1 Results of human influence on drought characteristics
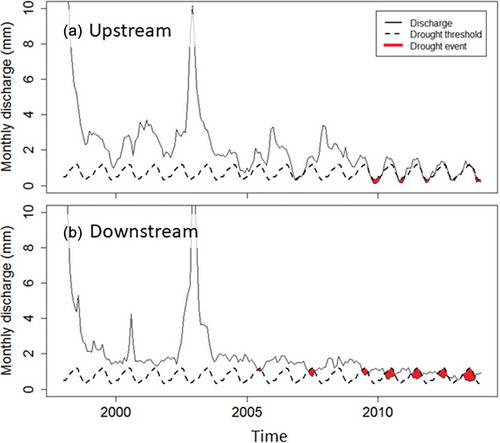
Meteorological drought analysis showed that meteorological droughts were similar during the pre-dam and the post-dam period (); no differences were observed in the maximum meteorological drought characteristics between the two time periods, and minimal differences were seen in the average drought characteristics (duration −4%, deficit +3%, ). Discharge records of the upstream and downstream stations were also similar during the pre-dam, but very different in the post-dam period (). Hydrological drought analysis results following the upstream–downstream approach revealed an aggravation of hydrological droughts downstream during the post-dam period due to the reservoir (), shown by increases in drought durations (+15% average, +17% total) and deficit volumes (+158% average, +201% total) ().
Table 1. Results for percentage change in meteorological drought characteristics between the two time periods
Figure 4. Hydrological drought analysis results during the post-dam period (1998–2013) for (a) upstream and (b) downstream discharge stations. Drought analysis conducted with the variable threshold level, using the whole time period of the upstream station only to calculate the threshold
3.2 Sensitivity analysis of drought analysis threshold variations
Results of the sensitivity analysis showed large differences in the direction and magnitude of change (). Interpretation of results thus depends on the method and choices used for the drought analysis (see Sections 2.4.1–2.4.3). Variations of the threshold level (variable or fixed) resulted in the largest differences within the sensitivity analysis, with a difference in the direction of change seen. The variable threshold level showed an aggravation of drought events due to the human activity (), whereas the fixed threshold level results indicated an alleviation of drought events (see Section 3.2.1). Changes in threshold time period and station gave varying differences in magnitude, depending on the combination (). Furthermore, the use of a threshold with human activities incorporated within the threshold itself (e.g. use of human-influenced downstream discharge station for threshold) seemed to underestimate the change in drought characteristics observed due to the human influence (see Section 3.2.3).
Table 2. Results for the upstream–downstream approach for the post-dam period (1998–2013): drought characteristics of the upstream and downstream stations and the percentage (%) change of drought characteristics downstream, calculated with EquationEquation (1)(1)
(1)
Table 3. Sensitivity analysis results for variable and fixed threshold level method calculating the percentage change (%) of drought characteristics downstream for the analysis period 1998–2013 using EquationEquation (1)(1)
(1)
3.2.1 Effect of variation 1: threshold level
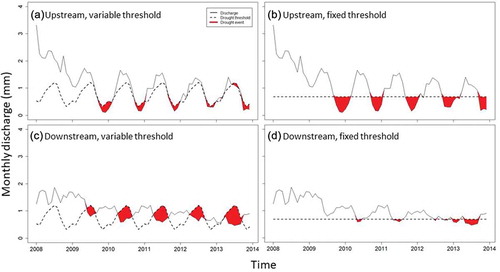
The variable threshold level method showed an aggravation of drought events due to the presence of the human activity, indicated by an increase in the percentage change downstream, especially in deficit volumes (). Conversely, using the fixed threshold, results implied that the introduction of the dam helped to alleviate droughts downstream through a decrease in all drought characteristics (). However, through visual assessment of the droughts identified in the post-dam period with both variations (), this alleviation with a fixed threshold is seen because the discharge downstream has been increased and low flows are mainly sustained by the dam ()), whereas the variable threshold level identified the shift in river regime in the downstream station due to the reservoir, resulting in droughts during the high-flow season ()).
Figure 5. Application of the variable and fixed threshold on the upstream and downstream stations during the post-dam period. Threshold calculated based upon upstream whole period (to represent “natural conditions”)
3.2.2 Effect of variation 2: threshold time period
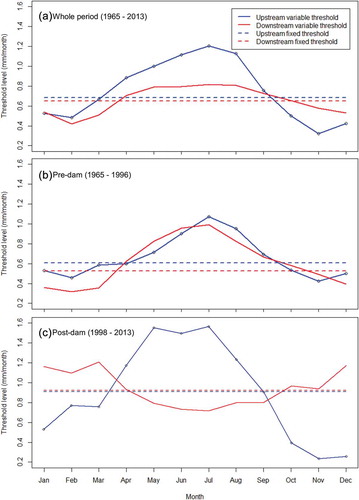
Using the whole period to establish the threshold rather than a pre-dam period resulted in larger changes in droughts downstream (). This is because the thresholds for the pre-dam period are different from the thresholds for the whole period ( and ()). The whole period downstream threshold included the human-influenced post-dam period. The variable post-dam period threshold ()) clearly showed a regime shift in the downstream station. This therefore contributed to the differences in upstream and downstream thresholds when the whole period was used. From this, we observed that using the whole period for the upstream station allowed only the inclusion of the post-dam analysis period (something that a pre–post disturbance analysis does not account for), but also excluded human activities from the threshold, which is desired for the quantification.
Figure 6. Upstream and downstream variable and fixed drought analysis thresholds for: (a) whole period thresholds (1965–2013); (b) pre-dam thresholds (1965–1996); (c) post-dam thresholds (1998–2013)
3.2.3 Effect of variation 3: threshold station
Using own stations to establish the thresholds for drought analysis resulted in much lower percentage changes downstream compared to when the upstream threshold was used as a proxy for “natural conditions” (). It is speculated that this is due to human activities being incorporated into the threshold calculated with the downstream station, affecting the threshold (). This was seen clearly in the variable thresholds for the post-dam period where the downstream threshold becomes the reverse of the upstream threshold ()). Although the seasonality is changed by the reservoir, and the hydrograph is smoothed with reduced variation, the fixed thresholds showed that total discharges of both stations were still very similar ()). Compared to the pre-dam fixed thresholds, this actually indicated an elevation of discharge levels overall ( and ).
4 Discussion
Most of this section is focused around our approach (Section 4.2) and what we have learnt from the sensitivity analysis (Section 4.3). However, we start by discussing specifically the impact of the Santa Juana Dam on downstream droughts, and compare our results to other reservoir studies (Section 4.1). These results are an important contribution to the increasing knowledge of case studies analysing the influence of human activities on drought.
4.1 Overall impact of the dam on hydrological droughts downstream
In this example, the introduction of a reservoir clearly impacted hydrological droughts downstream. This impact was mainly due to the change in river regime with the presence of the reservoir. The temporal difference observed between droughts upstream and downstream during the post-dam period () reflects the impact of human activities, with a consequential change in drought seasonality due to reservoir management ()). This is something that has been observed in other studies when studying the flow alterations rather than droughts specifically; it is known that reservoirs influence downstream river regime through changes in the volume, timing and seasonality of discharge (e.g. Petts and Gurnell Citation2005, Assani et al. Citation2013, Liu et al. Citation2016a), with impacts on ecology (e.g. Nilsson and Berggren Citation2000, Poff and Hart Citation2002, Rolls et al. Citation2012, Timpe and Kaplan Citation2017). Whilst smoothing of the hydrograph might be observed, through lower peak flows and higher low flows (Van Oel et al. Citation2017), and because flow regulation might artificially elevate flows eliminating natural periods of low flows (Rolls et al. Citation2012), overall annual discharge values may not be affected (Rolls et al. Citation2012).
The results show an aggravation of hydrological droughts identified using the variable threshold method, yet an alleviation of droughts using the fixed threshold method (). Both the aggravation and alleviation of droughts due to reservoirs has been seen in the literature. López-Moreno et al. (Citation2009) found an increase in drought severity downstream due to the introduction and management of a transboundary reservoir (Spain/Portugal) using the SSI. However, using hydrologically modelling and the variable threshold level to assess the impact of human activities, He et al. (Citation2017) showed that reservoirs helped alleviate drought conditions in California, USA, reducing drought deficit by 50% in southern California during the 2014 drought. One reason for these differences could be the drought analysis choices made. Yet another reason could be that the purpose of the reservoir affects the changes downstream. For example, the Chilean reservoir was managed to provide water security for agricultural users in the downstream area, therefore designed to sustain low flows by lowering peak flows. However, other reservoir management (e.g. hydropower, public water supply, upstream users) might result in a different impact downstream.
Even when reservoirs alleviate drought, this alleviation will be dependent on storage capacity and may not end up influencing multi-year droughts. This can be seen in our results during the post-dam period as drought events are alleviated at the start of the period, and the start of the multi-year drought (2007–2015) is delayed; however, the multi-year drought becomes visible downstream with time ()). This is likely due to the multi-year drought becoming too severe for the storage capacity of the Santa Juana reservoir to alleviate.
4.2 Upstream–downstream approach
This work has used observation data to quantify the change in drought characteristics downstream due to dam operation. One advantage of the upstream–downstream approach is that, through comparing the same time period, we can account for the same climatic drivers influencing droughts in the analysis period. There are of course uncertainties in comparing two stations; however, these can be limited if stations are located in close proximity, with the main difference between the two stations being the human activity seeking quantification.
Another advantage of this approach is the exploitation of observation data that inherently contain human activities, feedbacks and responses. Hydrological modelling is yet to fully incorporate human activities and feedbacks (Srinivasan et al. Citation2017), and therefore the use of observation data can help us to understand real changes due to human activities. In turn, this information can be used to help improve hydrological modelling. Whilst we used the example of a reservoir in this study, the upstream–downstream approach can also be applied to other human activities. However, it is likely to work best with more direct human influences, such as dams and water abstractions located at specific points, because point-based alteration of the hydrological system is easier to isolate.
4.3 Quantifying human influence on droughts: considerations for drought analysis and threshold choice
The drought threshold choices made during the drought analysis process were found to affect results and interpretations. It is important to know that the interpretation and synthesis of published work could be complicated by these different method choices. It seems that these variations should be understood and applied depending on the purpose of the analysis.
Heudorfer and Stahl (Citation2016) recently investigated the impact of a variable or fixed threshold on drought characteristics, finding that it changed the distribution of drought durations. Here we actually find a difference in the direction of change, not just in the magnitude. Applying a fixed threshold shows the overall reduction of low flows, especially during the summer. However, the shift in river regime reduces the flow during high flows, which is only identified using the variable threshold. From a water use and management point of view, the fixed threshold can represent a minimum level for human water use or environmental flows. Therefore the fixed threshold could be used to highlight changes in low flows (rather than droughts) due to human activity.
Our sensitivity analysis shows that if drought analysis tools are applied in the Anthropocene without thorough consideration, we could be underestimating the human influence on droughts. Isolating the threshold without impacts of human activities is needed to allow for full quantification of the human influence. A known advantage of using the whole period to calculate the threshold is that the climate conditions of the analysed period are included. Yet, if the own thresholds are used for the whole period, human activities are automatically incorporated into the threshold of the human-influenced station, which will not provide a natural comparison to identify the change due to the human influence.
Drought analysis using own thresholds represents how most standardized indices (e.g. SSI) are usually applied. Thus our results suggest that studies using SSI to quantify the human influence on droughts could be underestimating the human influence. Being able to compare the human influence with the “natural” situation is the desired approach for quantifying the human influence, and therefore the application of the natural threshold only is highly recommended for this purpose.
5 Conclusions
In our human-modified world it is important to understand how human activities are affecting hydrology. Investigating observation data is useful in progressing this knowledge in how human activities and feedbacks affect drought as these actions are intrinsically included in the observation data. However, for quantification of the human influence, finding a proxy observation dataset for the natural situation to allow the necessary comparison can be difficult. We explored the application of an upstream–downstream approach using observation data. We find that this approach is a good way to assess changes observed downstream for a human activity, particularly because the quantified comparison is within the same meteorological period. For the quantification we recommend the use of the threshold level method with a threshold that excludes human activities from the threshold, such as the upstream station rather than downstream station.
Whilst testing the application of this observation-based approach, we discovered the importance of assessing our current drought analysis methods for hydrology in the Anthropocene. This research has shown the need for consideration when initially choosing methods for drought analysis, as different choices of drought thresholds are seen to affect the results and interpretation of changes in hydrological droughts. If the purpose is to quantify the human influence, then the threshold for drought identification needs to be unaffected by human activities. We find that current methods frequently used do not achieve this, and therefore could be underestimating the change detected due to the human influence. Furthermore, this demonstrates that it could be difficult to compare existing studies if different variations of drought thresholds are used.
Increasing our knowledge on how human activities are affecting hydrological droughts is fundamental for water resource management and hydrological modelling. Whilst the application of this study was on the impacts of a selected reservoir on hydrological droughts, this methodology can be applied to other human activities, such as irrigation, groundwater abstraction and urbanization, to increase our understanding of the impacts of anthropogenic activities on hydrological droughts.
Acknowledgements
This work was developed within the framework of the Panta Rhei Research Initiative of the International Association of Hydrological Sciences (IAHS) (see http://iahs.info/Commissions–W–Groups/Working–Groups/Panta–Rhei/About–Panta-Rhei.do). The authors would like to thank Pablo Rojas and Sergio Alejandro Gutiérrez Valdés at Junta de Vigilancia de Río Huasco y sus Afluentes, Chile, for their knowledge of operations in the Huasco basin. The authors would also like to thank the research group at the University of Birmingham for their discussions and Niko Wanders for his continued support of the ideas and analysis.
Disclosure statement
No potential conflict of interest was reported by the authors.
Additional information
Funding
References
- AghaKouchak, A., et al., 2015. Water and climate: recognize anthropogenic drought. Nature, 524, 409–411. doi:10.1038/nature14497
- Assani, A., et al., 2013. The impact of “Man-Made Hydrological Drought” on plant species abundance in the low-flow channel downstream from the Matawin Dam, Quebec. Water, 5 (3), 875–892. doi:10.3390/w5030875
- Azrina, M.Z., et al., 2006. Anthropogenic impacts on the distribution and biodiversity of benthic macroinvertebrates and water quality of the Langat River, Peninsular Malaysia. Ecotoxicology and Environmental Safety, 64 (3), 337–347. doi:10.1016/j.ecoenv.2005.04.003
- Favier, V., et al., 2009. Interpreting discrepancies between discharge and precipitation in high-altitude area of Chile’s Norte Chico region (26-32°S). Water Resources Research, 45, W02424. doi:10.1029/2008WR006802
- Fleig, A.K., et al., 2006. A global evaluation of streamflow drought characteristics. Hydrology and Earth System Sciences, 10, 535–552. doi:10.5194/hess-10-535-2006
- Gascoin, S., et al., 2011. Glacier contribution to streamflow in the two headwaters of the Huasco River, Dry Andes of Chile. The Cryosphere, 5, 1099–1113. doi:10.5194/tc-5-1099-2011
- Giannikopoulou, A.S., et al., 2014. Drought characterisation in Cyclades complex, Greece. European Water, 47, 31–43.
- He, X., et al., 2017. Intensification of hydrological drought in California by human water management. Geophysical Research Letters, 44, 1777–1785.
- Heudorfer, B. and Stahl, K., 2016. Comparison of different threshold level methods for drought propagation analysis in Germany. Hydrology Research, 47 (4). doi:10.2166/nh.2016.258
- Hisdal, H., et al., 2004. Hydrological Drought Characteristics. In: Tallaksen and Van Lanen, eds.. Hydrological drought: processes and estimation methods for streamflow and groundwater. Amsterdam, the Netherlands: Elsevier Science, 139–198.
- Hisdal, H. and Tallaksen, L.M., 2000. Drought event definition. Technical report no. 6: assessment of the regional impact of droughts in Europe. Norway: Department of Geophysics, University of Oslo.
- Jolly, W.M. and Running, S.W., 2004. Effects of precipitation and soil water potential on drought deciduous phenology in the Kalahari. Global Change Biology, 10, 303–308. doi:10.1046/j.1365-2486.2003.00701.x
- Liu, Y., et al., 2016a. Evolution of hydrological drought in human disturbed areas: a case study in the laohahe catchment, Northern China. Advances in Meteorology. doi:10.1155/2016/5102568
- Liu, Y., et al., 2016b. Changing landscapes by damming: the Three Gorges Dam causes downstream lake shrinkage and severe droughts. Landscape Ecology, 31, 1883–1890. doi:10.1007/s10980-016-0391-9
- López-Moreno, J.I., et al., 2009. Dam effects on droughts magnitude and duration in a transboundary basin: the Lower River Tagus, Spain and Portugal. Water Resources Research, 45, W02405. doi:10.1029/2008WR007198
- McKee, T.B., Doesken, N.J., and Kleist, J., 1993. The relationship of drought frequency and duration to time scales. In:Proceedings of the Eighth Conference on Applied Climatology. Boston: American Meteorological Society, 179–184.
- Mehran, A., Mazdiyasni, O., and AghaKouchak, A., 2015. A hybrid framework for assessing socioeconomic drought: linking climate variability, local resilience, and demand. Journal of Geophysical Research, 120 (15), 7520–7533.
- Montecinos, A., Díaz, A., and Aceituno, P., 2000. Seasonal diagnostic and predictability of rainfall in subtropical South America based on tropical Pacific SST. Journal of Climate, 13, 746–758. doi:10.1175/1520-0442(2000)013<0746:SDAPOR>2.0.CO;2
- Nilsson, C. and Berggren, K., 2000. Alterations of riparian ecosystems caused by river regulation. BioScience, 50 (9), 783–792. doi:10.1641/0006-3568(2000)050[0783:AORECB]2.0.CO;2
- Peñas, F.J., Barquín, J., and Álvarez, C., 2016. Assessing hydrological alteration: evaluation of difference alternatives according to data availability. Ecological Indicators, 60, 470–482. doi:10.1016/j.ecolind.2015.07.021
- Petts, G.E. and Gurnell, A.M., 2005. Dams and geomorphology: research progress and future directions. Geomorphology, 71, 22–47. doi:10.1016/j.geomorph.2004.02.015
- Poff, L.N. and Hart, D.D., 2002. How dams vary and why it matters for the emerging science of dam removal. BioOne, 52 (8), 659–668.
- Prudhomme, C., et al., 2014. Hydrological droughts in the 21st century: hotspots and uncertainties from a global multi-model ensemble experiment. Proceedings of the National Academy of Sciences (PNAS), 111 (9), 3262–3267. doi:10.1073/pnas.1222473110
- Rangecroft, S., et al. 2018. Using paired catchments to quantify the human influence on hydrological droughts. Hydrology and Earth System Science Discuss. doi:10.5194/hess-2018-215 in review.
- Ren, L., et al., 2002. Impacts of human activity on river runoff in the northern area of China. Journal of Hydrology, 261 (1–4), 204–217. doi:10.1016/S0022-1694(02)00008-2
- Rolls, R.J., Leigh, C., and Sheldon, F., 2012. Mechanistic effects of low-flow hydrology on riverine ecosystems: ecological principles and consequences of alteration. BioOne, 31 (4), 1163–1186.
- Srinivasan, V., et al., 2017. Prediction in a socio-hydrological world. Hydrological Sciences Journal, 62 (3), 338–345.
- Tallaksen, L.M., Madsen, H., and Clausen, B., 1997. On the definition and modelling of streamflow drought duration and deficit volume. Hydrological Sciences Journal, 42, 15–33. doi:10.1080/02626669709492003
- Tallaksen, L.M. and Van Lanen, H.A.J., 2004. Hydrological drought: processes and estimation methods for streamflow and groundwater. Amsterdam, the Netherlands: Elsevier Science.
- Timpe, K. and Kaplan, D., 2017. The changing hydrology of a dammed Amazon. Science Advances, 3 (11), e1700611. doi:10.1126/sciadv.1700611
- Van Dijk, A.I.J.M., et al., 2013. The Millennium Drought in southeast Australia (2001-2009): natural and human causes and implications for water resources, ecosystems, economy, and society. Water Resources Research, 49 (2), 1040–1057. doi:10.1002/wrcr.20123
- Van Huijgevoort, M.H., et al., 2012. A generic method for hydrological drought identification across different climate regions. Hydrology and Earth System Sciences, 16, 2437–2451. doi:10.5194/hess-16-2437-2012
- Van Loon, A. F., and Van Lanen, H. A. J., 2015. Testing the observation-modelling framework to distinguish between hydrological drought and water scarcity in case studies around europe. European Water, 49 (65–75).
- Van Loon, A.F., 2015. Hydrological drought explained. WIREs Water, 2 (4), 359–392. doi:10.1002/wat2.1085
- Van Loon, A.F., et al., 2016. Drought in the Anthropocene. Nature Geoscience, 9, 89–91. doi:10.1038/ngeo2646
- Van Loon, A.F. and Van Lanen, H.A.J., 2013. Making the distinction between water scarcity and drought using an observation-modeling framework. Water Resources Research, 49, 1483–1502. doi:10.1002/wrcr.20147
- Van Oel, P.R., Martins, E.S.P.R., and Costa, A.C., 2017. The effect of reservoir networks on drought propagation. European Water, 60, 287–292.
- Van Tiel, M., et al., 2018. The role of glacier changes and threshold definitions in the characterization of future streamflow droughts in glacierised catchments. Hydrology and Earth System Sciences, 22 (1), 463–485. doi:10.5194/hess-22-463-2018
- Vicente-Serrano, S.M., et al., 2004. Drought patterns in the Mediterranean area: the Valencia region (eastern Spain). Climate Research, 26, 5–15. doi:10.3354/cr026005
- Vicente-Serrano, S.M., et al., 2014. Evidence of increasing drought severity caused by temperature rise in southern Europe. Environmental Research Letters, 9 (4). doi:10.1088/1748-9326/9/4/044001
- Viviroli, D., et al., 2007. Mountains of the world, water towers for humanity: typology, mapping and global significance. Water Resources Research, 43 (7). doi:10.1029/2006WR005653
- Vogel, C.H. and Drummond, J.H., 1993. Dimensions of drought: South African case studies. GeoJournal, 30 (1), 93–98.
- Wada, Y., et al., 2013. Human water consumption intensifies hydrological drought worldwide. Environmental Research Letters, 8 (3). doi:10.1088/1748-9326/8/3/034036
- Wagnitz, P., Núñez, J., and Ribbe, L., 2014. Cost of environmental flow during water scarcity in the arid Huasco River basin, northern Chile. Hydrological Sciences Journal, 59, 700–712. doi:10.1080/02626667.2014.892599
- Wanders, N. and Wada, Y., 2015. Human and climate impacts on the 21st century hydrological drought. Journal of Hydrology, 526, 208–220. doi:10.1016/j.jhydrol.2014.10.047
- Wang, G., Xia, J., and Chen, J., 2009. Quantification of effects of climate variations and human activities on runoff by a monthly water balance model: a case study of the Chaobai River basin in northern China. Water Resources Research, 45 (7). doi:10.1029/2007WR006768
- Wang, Y., et al., 2015. Effects of large-scale climate patterns and human activities on hydrological drought: a case study in the Luanhe River basin, China. Natural Hazards, 76 (3), 1687–1710. doi:10.1007/s11069-014-1564-y
- Wu, H., et al., 2009. Upstream-downstream relationships in terms of annual streamflow discharges and drought events in Nebraska. Journal of Water Resource and Protection, 1, 299–315. doi:10.4236/jwarp.2009.15037
- Yevjevich, V., 1967. An objective approach to definitions and investigations of continental hydrologic droughts. Colorado: Colorado state University Fort Collins.