
 ?Mathematical formulae have been encoded as MathML and are displayed in this HTML version using MathJax in order to improve their display. Uncheck the box to turn MathJax off. This feature requires Javascript. Click on a formula to zoom.
ABSTRACT
Application of the Soil and Water Assessment Tool (SWAT) model is limited in plain polders, where hydrological and nutrient processes are confined by water conservancy facilities such as dikes and pumping stations. Watershed delineation techniques are proposed to enable SWAT to simulate these processes in a plain polder in Jiangxiang Town (Nanchang County, Jiangxi Province, China). Drainage unit division and multiple-outlet modelling approaches are introduced, and the main river network and land features are incorporated into a digital elevation model (DEM), so that drainage unit delineation can agree well with real flow direction and concentration. The impoundments of pumping stations are regarded as functioning like reservoirs, which are set up in the SWAT model to simulate confined hydrological processes. The results show that confined hydrological and nutrient processes in plain polders are simulated well; the retention rates of total nitrogen and total phosphorus are estimated as, respectively, 39% and 29% in both streams and impoundments.
Editor A. Castellarin; Associate editor M. Piniewski
Introduction
Plain polders, or lowland areas, are characterized by flat terrain, low hydraulic slope and controlled hydrological processes (Krause et al. Citation2007, Schmalz et al. Citation2007, Haas et al. Citation2017, Lai et al. Citation2018). To obtain larger and safer areas for agricultural use and human habitation, different measures, such as construction of dikes, pumping stations and drainage ditches, have been utilized. Dikes may be constructed along rivers or lakes to protect agricultural lands and villages from floods. The hydrological connection between the inside polder area and the receiving water body (such as main river reaches and lakes) is confined by such water conservancy facilities. In the flooding season, the water level of the main river or lake outside the plain polder is usually higher than that inside the plain polder and the runoff generated in the polder cannot flow out freely due to the impeding dikes. This water is thus stored in the impoundments temporarily until the water level rises high enough to trigger pumping operations, through which the surplus water is pumped out of the polder at a constant flow rate.
Plain polders are generally highly regulated, and the regulation may increase the complexity of natural hydrological processes, for example, runoff generation and its concentration (Hesse et al. Citation2008). With the development of modelling technology, spatially distributed hydrological and eco-hydrological models are widely used to assess various hydrological components and nutrient dynamic processes (Ogden et al. Citation2001, Lam et al. Citation2010, Citation2012). In addition, some researchers (e.g. Yan et al. Citation2016, Citation2018, Huang et al. Citation2017, Citation2018) have developed their own modelling frameworks to simulate the hydrological processes of polders and to track nutrient export from lowland polders. The Soil and Water Assessment Tool (SWAT) is a physically-based, distributed model, which can simulate the rainfall–runoff process, and sediment and nutrient transport in a watershed that has complex land use, soil types and management practices (Neitsch et al. Citation2005). Schmalz et al. (Citation2008) applied SWAT to a lowland river basin and discussed its capability and challenges in modelling hydrological processes. Grizzetti et al. (Citation2003) used SWAT to model nitrogen and phosphorus removal in natural streams and estimated their retention rates. Bosch (Citation2008) analysed the influence of impoundments on nutrient transport using SWAT. The SWAT model turned out to be an efficient tool to understand hydrological processes and the movement and transformation of nutrients. However, in most of these studies, the hydrological processes are modelled as free discharge processes in hilly or lowland areas (Xue et al. Citation2008; Hesse et al. Citation2008, Schmalz et al. Citation2008, Lam et al. Citation2010, Citation2012, Song et al. Citation2015, Haas et al. Citation2017, Lai et al. Citation2018); these study areas usually have definite dendritic stream networks delineated depending on a DEM dataset using the Spatial Analyst Tool-Hydrology module of ArcGIS Software®, and lowland polders, if included, are only a small part of the simulation area (Haas et al. Citation2017, Lai et al. Citation2018). Because these SWAT applications or improved techniques have not described in detail how to deal with DEM data, and delineate unique dendritic stream networks as required by SWAT modelling, they cannot be used to guide the model’s application in a small plain polder (lowland area) with multiple artificial pumping stations. In addition, watershed delineation in SWAT modelling cannot be simply accomplished without considering local land features (i.e. dikes and main roads), which will affect runoff routing processes (Luo et al. Citation2013). Furthermore, the retention of nutrients in both streams and impoundments of pumping stations due to the confined hydrological process should be evaluated.
The aims of this study are: (1) to identify the unique hydrological and nutrient retention processes in a lowland area, the Jiangxiang plain polder, in a downstream area of the Ganjiang River Basin, China; (2) to calibrate and validate the SWAT model and discuss its applicability in lowland polders; and (3) to analyse the characteristics of nutrient retention under controlled hydrological conditions.
Materials and methods
Study area
This study was conducted in the Jiangxiang plain polder, which is located in the downstream area of the Ganjiang River Basin, Jiangxi Province, China. The Jiangxiang Polder is a typical lowland polder surrounded by the middle and southern branches of the Ganjiang River, with dikes constructed all around to protect the agricultural and residential areas within from floods (Fig. 1). Pumping stations are located along the surrounding dikes, which provide the only way to drain surplus water out of the polder into the Ganjiang River. In , the sizes of dots indicating the pumping stations are relative to the sizes of the pumps and their drainage capacity. There are many minor dikes constructed inside the polder, dividing it into three major segments (). According to the field survey, water in the three sub-polders is well controlled by sluices, and water exchange between the sub-polders is limited.
Figure 1. Location of Jiangxiang plain polder, between the middle and southern branches of the Ganjiang River, showing pumping stations and drainage units. Sizes of dots indicate pumping capacity.
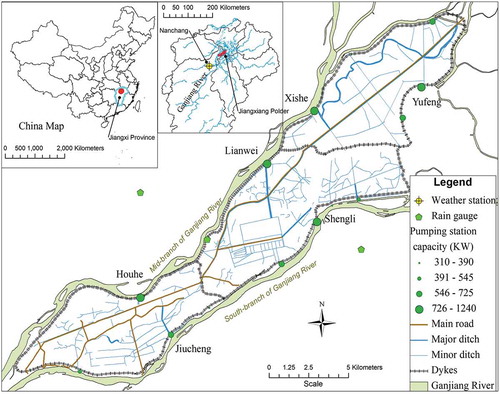
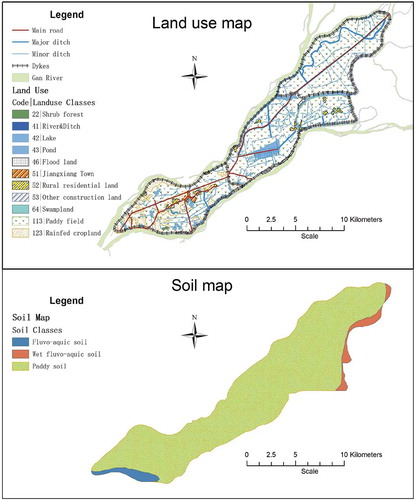
The area of the Jiangxiang Polder is 151.8 km2; it is 39 km long, with a width of between 4 and 6 km, and the total length of the dikes is about 95.1 km. Agricultural land is the dominant land-use type (about 90%), of which paddy field occupies 91.4% and rainfed cropland 8.6%; and paddy soil is the main soil type (about 97%) in this study area (Fig. 2). In this polder area, rice is double-cropped from late March/beginning of April to the middle of October each year. The whole study area belongs to Jiangxiang Town, in Nanchang County, Jiangxi Province, which is in the subtropical monsoon climate zone, with fertile land and abundant natural resources. This area has an average air temperature of 17.8°C, annual average precipitation of 1660 mm and annual sunshine duration of 1603 hours. There are 17 administrative villages and about 68 000 agricultural residents in Jiangxiang.
Data sources
Basic data
The data used to establish the SWAT model include a digital elevation model (DEM), stream channel networks, dikes and ponds, land-use and soil maps, climate data/rainfall data, agricultural practices, and monitored water quality data. Sources and a description of the data are shown in .
Table 1. Data sources and specification for the SWAT model set-up.
Datasets required to calibrate and validate the model were obtained by field survey and sampling. The capacity and monthly electricity usage data (2006–2008) for each pumping station were collected to calculate the volume of discharged water. Monthly water quality samples were taken at the pumping station outlets in the period from October 2010 to October 2011. These samples were analysed for total phosphorus (TP) and total nitrogen (TN) in the laboratory.
Agricultural activities and nutrient inputs
The agricultural farming activity in the study area is typically double-cropping rice production, with the early season from late March/early April to the first week of July, followed by the late season from about 10 July to the middle of October. Fertilizer is usually applied three times: as base fertilizer, a tilling-stage dressing and a combined fertilization, using a compound fertilizer and urea ().
Table 2. Summary of fertilizer application for paddy production – double-cropping rice.
Besides input from chemical fertilizer application on the agricultural land, there is also input into the polder system from livestock grazing inside the study area, as well as that from the rural population. Based on the Pollutants Discharge Coefficient Handbooks of the First National Census of Pollution Sources, Livestock and Poultry Breeding Industry and Rural Living pollution (2008) and statistical data on breeding animals and rural residents in Jiangxiang Town, the discharge pollutant loadings are estimated and converted to manure input as base fertilizer of paddy and rainfed crops in the SWAT model set-up.
Estimation of pumped water volume
There are no measured flow data for the pumping stations; however, we used field survey to obtain pump performance parameters of all the pumping stations, such as installed power, pump capacity and monthly electricity usage. From this, we estimated the pumped water capacity and used this as observed drainage water flow of the pumping operation in the model. Based on the assumption of identical pump head and similar pump efficiency, the pumped water volume can be estimated as:
where Qi is the total pumped water volume of a pumping station in month i (m3), which includes both irrigated and drained water flow; Ei is the monthly electricity usage of this pumping station in month i (KWh); P is the total pump power of the pumping station (KW); and Qe is the rated pumping water capacity of the pumping station (m3/h).
Drainage and irrigation partition
The pumping stations are primarily responsible for polder drainage; however, they are also responsible for polder irrigation during drought. So the estimated pumped water volume based on electricity usage includes outflow for drainage and water amount for polder irrigation. Therefore, the actual irrigation water amount should be subtracted from the estimated pumped water volume. Based on the local irrigation quota for rice (JBQTS, Citation2011) and the irrigation area (catchment area) of each pumping station, the actual drained water volume from the polder can be estimated as:
where Di is the drained water volume in month i (m3); Ti is the total pumped water volume depending on electricity usage; Iej is the irrigation quota (m3/ha) corresponding to rainfall frequency of 50%, 75% or 95% (JBQTS, Citation2011) depending on the actual rainfall amount of the SWAT simulated year; γi is the ratio of irrigation amount in month i and total irrigation amount; and F is the irrigation area of each pumping station (ha).
Improvement of watershed delineation
The natural runoff process is changed by dikes and sluices, which divide the plain polder into several relatively independent catchment units (i.e. sub-polders). As shown in , the study area is divided by dikes into three independent drainage units. The surface runoff connection between them may be ignored, according to the field survey. Thus, it was proposed to model the hydrological processes separately for each catchment unit, to make the modelled processes agree with the real processes of runoff generation and concentration.
With the dikes and sluices preventing long-distance movement of water, runoff is usually routed through ditches to a nearby pumping station and pumped out of the polder area. Each station acts as an outlet of the catchment. Therefore, it was proposed to model the hydrological processes with multiple outlets. Since there is more than one pumping station in each drainage unit, in the established model, only major pumping stations were selected, in consideration of three selection criteria: (a) large pumps, which indicates large potential pumping capacity; (b) large mean annual drainage, which indicates actual pumping performance; and (c) with representative and spatially distributed locations, indicating a better control of the nearby flood drainage. Based on these three criteria, six pumping stations on both sides of each drainage unit were selected as the main watershed outlets (see ). The outflows of small pumping stations on the same side as a selected pumping station were summed up to the nearest selected outlet.
Figure 2. Land-use and soil maps of the study area.
Watershed delineation based on a DEM is a key step, and a priority for setting up a distributed model to make the modelling of runoff and water quality possible (Martz and Garbrecht Citation2011). Because of the flat topography in plain polders, the streams extracted from original DEM do not agree with the real ones. In this study, the real river networks were incorporated into a DEM to improve the stream delineation.
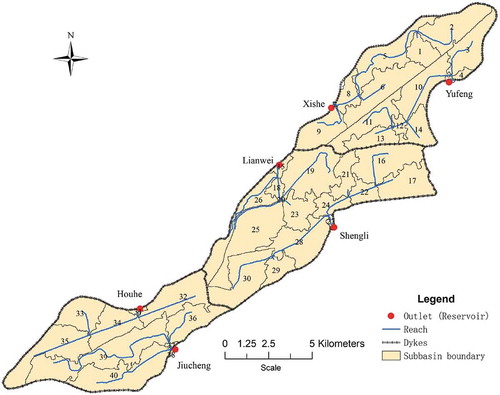
The dikes and roads are usually constructed at a higher elevation than the ground surface, so they can form an overland flow barrier and thereby re-route flow (Duke et al., Citation2003). However, the DEM turned out to be inefficient for presenting such terrain factors due to its low resolution. In this study, roads and dikes were incorporated into the original DEM to identify these terrain factors before sub-basin delineation. The elevation values where roads and dikes are located were raised by 2 m and 5 m, respectively, to arbitrarily force runoff flow from these grid cells. The sub-basin delineation results are shown in .
Figure 3. Watershed delineation of Jiangxiang Polder in the SWAT model showing the sub-basins.
Set-up of virtual reservoirs to control drainage
Unlike in watersheds with free discharge, the water flow routing in plain polders is confined by water conservancy facilities, such as dikes and pumping stations. The runoff generated inside the polders is transported to the pumping stations and temporarily stored in nearby impoundments until the water levels exceed a target value that triggers the pumps, and then the surplus water is pumped out. In the SWAT model, the reservoir is a hydraulic facility and water storage management component, which controls water diversion to downstream, city, industry and main irrigation areas inside/outside a catchment. In this study, a reservoir was regarded as the water-storage impoundment of the pumping station (so-called virtual reservoir), thereby controlling outflow as required in the modelled process. More importantly, this virtual reservoir can be placed on the main channel network and receive water from all upstream sub-basins. In contrast, the other impoundments in SWAT, such as ponds, wetland and depressions, are located within a sub-basin off the main channel. There are three alternatives for reservoir modelling: the first option requires one to input measured outflow; the second requires one to specify a water release rate, and is designed for small and uncontrolled reservoirs; and the third needs the user to specify monthly target volumes of the reservoir, and is designed for large and controlled reservoirs. The drainage management in plain polders is most like the second option: surplus water is pumped out of the polders at a certain flow rate when the stored water exceeds a targeted water level. By adding a virtual reservoir, one can make the modelled process represent the confined hydrological process. The volume of the reservoir was calculated by summing up the volumes of nearby ponds directly connected to the pumping station; the outflow rate of the reservoir was calculated by summing up the rated flow of the pumps.
Calibration and validation
It was required to calibrate both the load transported into streams and that observed at the outlet. A field experiment was carried out to calibrate the load transported from paddy rice fields into streams. When precipitation occurred, both the amount and water quality of the runoff generated from the experimental paddy fields was monitored. These data were collected to calculate event mean concentration (EMC) of each rainfall process using:
where c(t) is the runoff concentration (mg/L) at time t of a specific rainfall event, and q(t) is the runoff flow rate (m3/h) at time t of the specific rainfall event.
After EMC was calculated, the rainfall event-based nutrient export coefficient E (kg/ha) of the paddy field could be obtained as:
where R is the runoff depth (mm) of a specific rainfall event.
Based on literature review (Schmalz et al. Citation2008, Lam et al. Citation2010, Panagopoulos et al. Citation2011, Zadeh et al. Citation2017, Wang et al. Citation2018) and tests on the sensitivity of parameters in the SWAT model, the parameters that affect hydrological and nutrient dynamic processes with high sensitivity in this study were derived; these are presented in . When modelling the hydrological process, the CN2 turned out to be a very sensitive parameter, which controlled the proportion of runoff against infiltration. Parameters in the groundwater group, such as GW_REVAP, also showed a high sensitivity when modelling the groundwater process, which is similar to the results of Lam et al. (Citation2010) in a rural lowland catchment. For nutrient process calibration, several important parameters relevant to percolation, plant uptake, transformation, as well as the in-stream process, were adjusted at the catchment level. Moreover, CDN and SDNCO parameters, which govern denitrification from soil, were adjusted to control the denitrification rate, with a reasonable rate of 50% of nitrogen fertilizer loss due to denitrification in a rice-cropping system (Neitsch et al. Citation2005).
Table 3. The main SWAT parameters calibrated in the study.
The performance of the model was evaluated by comparing the simulated values to the observed ones, using the coefficient of determination (R2) and Nash-Sutcliffe efficiency (ENS) as given below:
The modelled hydrological process was first calibrated (2006–2007) and validated (2008) using three years of drainage data at the monthly scale. The nutrient processes were evaluated on the whole simulation period as long-term water quality data were lacking. The evaluation results of the modelled hydrological and nutrient processes are shown in .
Table 4. Evaluation of the modelled hydrological and nutrient processes. ENS: Nash-Sutcliffe efficiency coefficient; R2: coefficient of determination. TN: total nitrogen; TP: total phosphorus.
Results and discussion
Hydrological modelling
Taking the largest outlet, Shengli (ID: 27), as an example, the simulation result is shown in . The modelled runoff showed a good agreement with the observed pumping discharge; both the variable trends and peaks matched well in the simulation period. Precipitation mainly occurred from April to August and peaked in June, and both the observed and modelled outflow had the same tendency as the precipitation. From September to March the following year, precipitation was correspondingly scarce. In the dry season, although there was still a small amount of precipitation, both the observed and modelled drainages were mostly zero, which means that almost no runoff was generated and therefore there was no discharge.
Figure 4. Simulated reservoir outflow and observed drainage at the Shengli outlet.
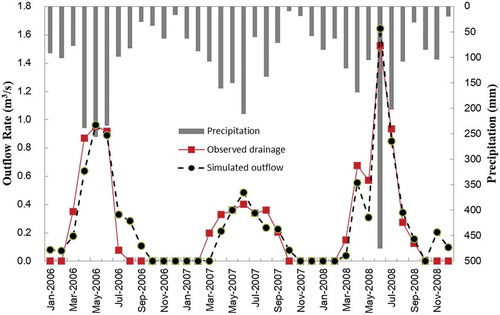
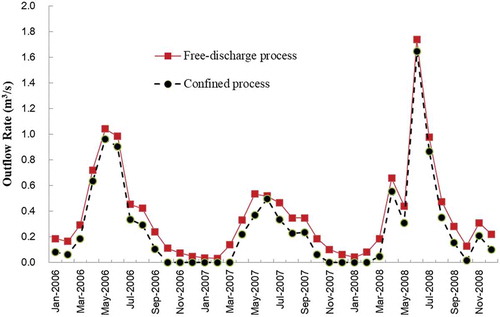
To illustrate the function of the pumping station in controlling the drainage process, a scenario analysis was carried out by modelling the hydrological processes with or without reservoirs. As shown in , the outflow of the confined process was slightly lower than that of the free-discharge process under the same rainfall conditions, which indicates a retention effect of runoff in the impoundment of the pumping stations. In addition, there is little or no outflow in the confined process during the dry season, which is constant with the observed drainage process.
Figure 5. Results of the free-discharge process and confined process modelling.
Nutrient modelling
We conducted two types of field observation: (1) monthly water quality sampling at the main pumping stations from October 2010 to October 2011, analysing for the water quality items TN and TP in the laboratory; and (2) paddy field experiment (8 May to 15 September 2011) consisting of observing the rainfall–runoff process to quantify the runoff process and runoff water quality and obtain event-based export coefficients from the experimental paddy field. Because water quality measurements were conducted in a short period of one year, the calibrations of monthly nutrient loss processes could only be conducted for the year 2011.
Field-scale modelling
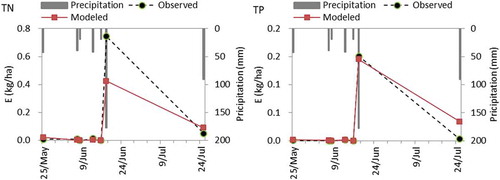
With paddy field experiment data, event-based nutrient export coefficients of seven rainfall events in the experimental paddy field were obtained. Comparison of monitored export coefficients to the SWAT modelled ones is shown in Figure 6.
reveals that the SWAT model performance was acceptable in simulating the nutrient loss process at the field scale, and the observed and modelled event-based export coefficient could match the variation well, with ENS of 0.77 and R2 of 0.93. Because there were only seven event-based observed rainfall export coefficients, these field-scale modelling results could only be evaluated as reasonable, and more detailed rainfall event-based observation data are required to improve the SWAT evaluation at the hydrological response unit (HRU) level.
Figure 6. Observed and modelled event-based, field-scale nutrient export coefficients (E, kg/ha) for total nitrogen (TN) and total phosphorus (TP).
Watershed-scale modelling
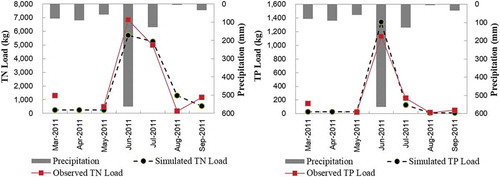
The model was calibrated and validated at the six outlets. As an example, shows the modelled TN and TP levels at the watershed outlet of the largest outlet, Shengli (ID: 27), compared with the observed levels. The results are satisfactory, with both the simulated peak and trends matching the observed data well. The TN and TP loads were at a maximum in June, which coincided with the precipitation peak.
Figure 7. Simulated and observed nutrient loads at Shengli outlet, at a monthly time step. TN: total nitrogen; TP: total phosphorus.
Retention calculation
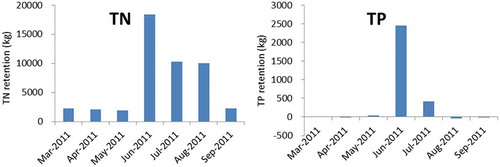
The modelling results of total nutrient inputs from the sub-basins and output at the watershed outlets are shown in . Nutrient retention is defined as the difference between total stream nutrient input from the sub-basins and the nutrient load obtained at the watershed outlet (namely reservoir). The total retention effect of the whole polder is shown in , and a clear retention effect for nutrients is shown, with an average retention rate of 39% for TN and 29% for TP.
Figure 8. Total nutrient input from sub-basins and output at the watershed outlet. TN: total nitrogen; TP: total phosphorus.
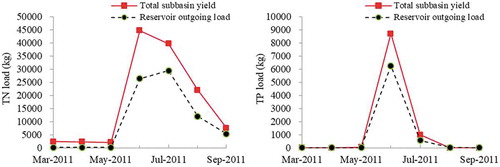
Figure 9. Retention effect of TN and TP in Jiangxiang Polder.
Discussion
Hydrological characteristics
In lowland polders, the runoff and nutrients generated in each drainage unit are transported first to a nearby pumping station via drainage ditches and then stored in the impoundment of the pumping station. In the study area, precipitation occurs mainly from April to August and is scarce from October to February the following year. In the dry season, the small amount of precipitation is not enough to fill the drainage ditches and impoundments to trigger the pumping operation, so the generated runoff is stored in the water bodies (including ditches and impoundments) within the polder. Therefore, there is usually little water discharge out of the polder during the dry season, as seen by both observation and simulation ().
When the SWAT model application was set up, the impoundment together with the associated pumping station was simulated as an artificially regulated reservoir, because both have a similar drainage manner. Adding a virtual reservoir at the drainage unit outlet can simulate the controlled drainage process by the pumping station. In the modelled process, runoff is routed from upstream to the reservoir and stored or discharged under control of the pumping operation. The simulation showed that the outflow rate under the confined process was a little lower than the freely discharged process under identical conditions (), which indicates the runoff retention effect of the pumping station and its connecting water bodies. The impoundment of the pumping station can store generated runoff until the water volume exceeds the target impoundment volume. Compared with the free discharge process, the hydrological residue time (HRT) is increased in the confined process, and this will increase the duration of water infiltration and evaporation. By setting up a virtual reservoir in the SWAT model to confine the hydrological process, the outflow from each drainage unit can be reasonably simulated, and there is almost no discharge water in the confined process during the dry season, which agrees well with the observed drainage process.
Nutrient retention
Generally, nutrient retention depends largely on the hydrological processes, which control the amount and spatial and temporal distributions of nutrient inputs (Engelhardt et al. Citation1999). There are two main retention processes in plain polders: the retention in the stream and the retention in the water body connecting pumping stations, which are modelled as reservoirs. Both the retentions include all the processes that keep nutrients from the water.
Streams or agricultural drainage ditches can mitigate nitrogen and phosphorus loads before they enter receiving waters (Kröger et al. Citation2008, Chu et al. Citation2010, Yan et al. Citation2016, Huang et al. Citation2017, Citation2018). Compared to watersheds with obvious slopes, the flow velocity in plain polders is very low, due to the flat topography. The travel time of water and nutrients is extended when the water flows slowly or remains still in ditches, and this will increase the time for nutrient consumption processes, such as settling, denitrification (for nitrogen) and plant uptake. With a longer travel time, more nutrients can be retained in streams and ditches (Chang et al. Citation2012). In this study, a higher retention rate was observed in summer (May–July). This may be attributed to a larger settling rate of nutrients and greater respiration rate due to higher temperatures in summer (Neitsch et al. Citation2005). A larger retention of TN than of TP was obtained, which is in accordance with the results of paddy field experiments (He et al. Citation2010).
In the SWAT model, nitrogen and phosphorus can be removed from the stream by settling and algae uptake. This is a simplification of the real in-stream nutrient dynamic process, and the in-stream denitrification process is not modelled by SWAT, which may lead to an overestimation of nitrogen loads.
Unlike watersheds with free discharge, in plain polders the generated runoff is usually controlled by dikes and pumping stations. Under this confined drainage condition, the nutrient dynamic process in the water bodies connecting pumping stations cannot be ignored, as it is in a freely discharged watershed. The pond is an effective water- and chemical-retention device for surface water quantity/quality control (Torgersen et al. Citation2004). Processes such as absorption, settling, bio-accumulation and volatilization can all contribute to the retention of nutrients in ponds.
As the water is confined by dikes and pumping stations, the HRT in plain polders is longer than in free-discharge watersheds. While the water is stored in the impoundments at the pumping stations, more nutrients will settle as a result of longer HRT with a certain settling rate. In the SWAT model, the nitrogen and phosphorous in the reservoir can be removed by settling alone. Furthermore, the denitrification process is not modelled, which may lead to an overestimate of nitrogen load.
SWAT applicability in polder areas
The SWAT model is generally applied in ranged land or mountainous areas (i.e. natural watersheds) with a dendritic stream network, so that the flow and nutrient routing can be conducted from upstream to downstream in a hydrological manner. Therefore, the SWAT application in a lowland polder area is quite difficult, mostly because there is no detailed flow–concentration relationship as in a natural watershed and usually the polder is ungauged without any observed flow data. This study focused on a pure polder with very flat topography and we cannot delineate the dendritic stream network by depending on DEM data alone. Some GIS techniques are required to help identify and simplify the rational dendritic stream; for instance, the real river network and the anthropogenic land-cover features such as dikes, sluices and roads were considered in the watershed delineation to match the real flow direction and accumulation process.
Some SWAT applications (e.g. Krause et al. Citation2007, Schmalz et al. Citation2007, Haas et al. Citation2017, Lai et al. Citation2018) were conducted in relatively natural watersheds with some lowland areas in downstream parts; however, in the SWAT model set-up on a lowland polder, there is no detail on how to delineate a dendritic stream from the flat topography, and how to deal with the drainage operations of numerous pumping stations, etc. Some other researchers (e.g. Yan et al. Citation2016, Yan et al. Citation2018, Huang et al. Citation2017, Citation2018) focused on developing their own modelling framework to simulate hydrological processes of polders and to track nutrient export from lowland polders with much more complicated processes. However, because there are more complicated hydrological and nutrient exporting processes and sparse observed data compared with a natural watershed, SWAT application in such a pure polder area is still a challenge for SWAT modellers. This study was therefore also trying to find some solutions, and more detailed field observations and topographical data are necessary to promote the accuracy of the SWAT application.
Conclusions
Based on the sufficient field survey of hydrological processes in the polder, drainage area division and multiple outlets approaches were introduced to make the hydrological simulation by the SWAT model meet the characteristics of nearby drainage and multiple outlets; the river network and land features (i.e. dikes and main roads) were incorporated into the DEM using ArcGIS software® to make the drainage unit delineation agree more with the real flow direction and concentration process; a virtual reservoir was set up as a water management facility to act as the impoundment of the pumping station to simulate the confined drainage process. With these drainage delineation techniques, the SWAT model may be applicable to simulate the unique hydrological and nutrient processes in lowland polders.
Retention of nutrients was observed in both the stream and water bodies connecting pumping stations in the plain polder. As the water is confined by dikes and pumping stations, the HRT of the water and nutrients in plain polders is longer than that in free-discharge watersheds, and more nutrients will be removed. The processes modelled by SWAT are simplifications of real situations, and not all processes are taken into account. This may lead to an overestimation of nutrient loads. In addition, further investigation, such as daily or weekly pumping flows and water quality monitoring, should be done to determine the influence of seasonal hydrological changes on nutrient retention rate.
Disclosure statement
No potential conflict of interest was reported by the authors.
Additional information
Funding
References
- Bosch, N.S., 2008. The influence of impoundments on riverine nutrient transport: an evaluation using the soil and water assessment tool. Journal of Hydrology, 355 (1–4), 131–147. doi:10.1016/j.jhydrol.2008.03.012
- Chang, N., Xuan, Z., and Wanielista, M.P., 2012. A tracer study for assessing the interactions between hydraulic retention time and transport processes in a wetland system for nutrient removal. Bioprocess and Biosystems Engineering, 35 (3), 399–406. doi:10.1007/s00449-011-0578-z
- Chu, Y., et al., 2010. Nutrient export from a typical polder area around Chao Lake during rice growing period in the summer. Jounal of Soil and Water Conservation, 24 (5), 135–140.
- Duke, G.D., et al., 2003. Improving overland flow routing by incorporating ancillary road data into digital elevation models. Journal of Spatial Hydrology, 3 (2), 1–27.
- Engelhardt, C., et al., 1999. Input-output balances of nutrients and plankton in a flooded area of the lower Odra. Acta Hydrochimica et Hydrobiologica, 27 (5), 325–330. doi:10.1002/(SICI)1521-401X(199911)27:5<325::AID-AHEH325>3.0.CO;2-A
- Grizzetti, B., et al., 2003. Modelling diffuse emission and retention of nutrients in the Vantaanjoki watershed (Finland) using the SWAT model. Ecological Modelling, 169 (1), 25–38. doi:10.1016/S0304-3800(03)00198-4
- Haas, M.B., Guse, B., and Fohrer, N., 2017. Assessing the impacts of Best Management Practices on nitrate pollution in an agricultural dominated lowland catchment considering environmental protection versus economic development. Journal of Environmental Management, 196, 347–364. doi:10.1016/j.jenvman.2017.02.060
- He, J., et al., 2010. Experiments on nitrogen and phosphorus losses from paddy fields under different scales. Transactions of the CSAE, 26 (10), 56–62.
- Hesse, C., et al., 2008. Eco-hydrological modelling in a highly regulated lowland catchment to find measures for improving water quality. Ecological Modelling, 218 (1–2), 135–148. doi:10.1016/j.ecolmodel.2008.06.035
- Huang, J., et al., 2018. Towards the development of a modeling framework to track nitrogen export from lowland artificial watersheds (polders). Water Research, 133, 319–337. doi:10.1016/j.watres.2018.01.011
- Huang, J., Gao, J., and Yan, R., 2017. A phosphorus dynamic model for lowland polder systems (PDP). Ecological Engineering, 88, 242–255. doi:10.1016/j.ecoleng.2015.12.033
- JBQTS (Jiangxi Bureau of Quality and Technical Supervision), 2011. Agricultural irrigation water quota of Jiangxi Province, DB36/T619-2011.
- Krause, S., Jacobs, J., and Bronstert, A., 2007. Modelling the impacts of land-use and drainage density on the water balance of a lowland-floodplain landscape in northeast Germany, C-4351-2008. Ecological Modelling, 200 (3–4), 475–492. doi:10.1016/j.ecolmodel.2006.08.015
- Kröger, R., et al., 2008. Agricultural drainage ditches mitigate phosphorus loads as a function of hydrological variability. Journal of Environmental Quality, 37 (1), 107–113. doi:10.2134/jeq2006.0505
- Lai, Z., et al., 2018. Development of a polder module in the SWAT model: SWATpld for simulating polder areas in south-eastern China. Hydrological Processes, 32, 1050–1062. doi:10.1002/hyp.v32.8
- Lam, Q.D., Schmalz, B., and Fohrer, N., 2010. Modelling point and diffuse source pollution of nitrate in a rural lowland catchment using the SWAT model. Agricultural Water Management, 97 (2), 317–325. doi:10.1016/j.agwat.2009.10.004
- Lam, Q.D., Schmalz, B., and Fohrer, N., 2012. Assessing the spatial and temporal variations of water quality in lowland areas, Northern Germany. Journal of Hydrology, 438-439 (2012), 137–147. doi:10.1016/j.jhydrol.2012.03.011
- Luo, Y.X., et al., 2013. Identifying and modeling confined hydrological processes in plain polders. Resources Science, 35 (3), 594–600. [in Chinese with English abstract].
- Martz, L. and Garbrecht, J., 2011. Numerical definition of drainage network and subcatchment areas from digital elevation models. Computers and Geosciences, 18, 747–761. doi:10.1016/0098-3004(92)90007-E
- Neitsch, S.L., et al., 2005. Soil and water assessment tool theoretical documentation. Temple, TX: Blackland Research Center, Texas Agricultural Experiment Station.
- Ogden, F.L., et al., 2001. GIS and distributed watershed models. II: modules, interfaces and models. Journal of Hydrologic Engineering, 6 (6), 515–523. doi:10.1061/(ASCE)1084-0699(2001)6:6(515)
- Panagopoulos, Y., et al., 2011. SWAT parameterization for the identification of critical diffuse pollution source areas under data limitations. Ecological Modelling, 222 (19), 3500–3512. doi:10.1016/j.ecolmodel.2011.08.008
- Schmalz, B., Tavares, F., and Fohrer, N., 2007. Assessment of nutrient entry pathways and dominating hydrological processes in lowland catchments. Advances in Geosciences, 11, 107–112. doi:10.5194/adgeo-11-107-2007
- Schmalz, B., Tavares, F., and Fohrer, N., 2008. Modelling hydrological processes in mesoscale lowland river basins with SWAT—capabilities and challenges. Hydrological Sciences Journal, 53 (5), 989–1000. doi:10.1623/hysj.53.5.989
- Song, S., Schmalz, B., and Fohrer, N., 2015. Simulation, quantification and comparison of in-channel and floodplain sediment processes in a lowland area – A case study of the Upper Stör catchment in northern Germany. Ecological Indicators, 57, 118–127. doi:10.1016/j.ecolind.2015.03.030
- Torgersen, T., Branco, B., and Bean, J., 2004. Chemical retention processes in ponds. Environmental Engineering Science, 21 (2), 149–156. doi:10.1089/109287504773087327
- Wang, Q., et al., 2018. Effects of dynamic land use inputs on improvement of SWAT model performance and uncertainty analysis of outputs. Journal of Hydrology, 563, 874–886. doi:10.1016/j.jhydrol.2018.06.063
- Xue, L.J., Li, L.J., and Zhang, Q., 2008. Hydrological behaviour and water balance analysis for Xitiaoxi catchment of Taihu Basin. Water Science and Engineering, 1 (3), 44–53. doi:10.3882/j.issn.1674-2370.2008.03.005
- Yan, R., Gao, J., and Huang, J., 2016. WALRUS-paddy model for simulating the hydrological processes of lowland polders with paddy fields and pumping stations. Agricultural Water Management, 169, 148–161. doi:10.1016/j.agwat.2016.02.018
- Yan, R., Li, L., and Gao, J., 2018. Modelling the regulation effects of lowland polder with pumping station on hydrological processes and phosphorus loads. Science of the Total Environment, 637–638, 200–207. doi:10.1016/j.scitotenv.2018.04.389
- Zadeh, F.K., et al., 2017. Comparison of variance-based and moment-independent global sensitivity analysis approaches by application to the SWAT model. Environmental Modelling & Software, 91, 210–222. doi:10.1016/j.envsoft.2017.02.001