
ABSTRACT
Suspended sediment dynamics are complex processes resulting from the interactions between different factors. To better comprehend these dynamics at event scale, we investigated two large datasets produced in two instrumented Italian catchments: a Mediterranean (Carapelle) and an Alpine watershed (Rio Cordon). An extensive set of variables concerning climatic, hydrological and suspended transport characteristics was used to explore the predictability of sediment dynamics. The differences in climate and size (499.40 vs 5.07 km2) led to different rainfall-runoff responses, while the discharge peak resulted as being a good descriptor for the hydrological and sediment dynamics. The sediment supply conditions influenced the hysteresis patterns while the principal component analysis explained 69.9% and 69.4% of variance in the Carapelle and Rio Cordon events, respectively. Using data produced by two long-term monitoring programmes, this study permits a better understanding of the sediment dynamics in Mediterranean and Alpine environments, also stressing their high complexity.
Editor S. Archfield Associate editor J. Rodrigo-Comino
1 Introduction
In fluvial systems, the suspended sediment transport results from complex interactions between several aspects such as catchment size, geo-lithological structure, climatic conditions, precipitation characteristics, channel bed stability, and the impact of natural events and anthropogenic disturbances, which act at different spatial and temporal scales (DeBoer and Campbell Citation1989, Soler et al. Citation2008, Mills and Bathurst Citation2015, Picco et al. Citation2016, Arismendi et al. Citation2017, Mao and Carrillo Citation2017). Regarding this, precise knowledge about suspended sediment dynamics is fundamental to better understand the land degradation and soil denudation processes acting in the catchments (Nadal-Romero et al. Citation2013), as well as to analyse the ecological status of the riverine environment (Pavanelli and Cavazza Citation2010, Kerr and Cooke Citation2017). In watersheds, the investigation of suspended sediment transport can be useful for river management (Comiti et al. Citation2011), to implement correct reservoir management (Vericat and Batalla Citation2005), better comprehend the sediment delivery processes (López-Tarazón et al. Citation2012) and identify the sediment source areas (Asselman Citation1999, Lenzi and Marchi Citation2000, Jansson Citation2002).
In Alpine headwaters, suspended sediment is normally transported during flood events (Lenzi et al. Citation2003). However, the relationship between suspended sediment concentration (SSC) and water discharge (Q) is not constant and depends on various factors such as sediment particle size characteristics, watershed topography, erosional activity, stream hydrodynamic and channel and bed morphology (Barsch et al. Citation1994, Bogen Citation1995, Lenzi et al. Citation1999, Mouri et al. Citation2014, Sun et al. Citation2016, Mao and Carrillo Citation2017). In terms of sediment transport, an Alpine catchment can exhibit seasonal behaviour with periods of sediment supply limitation due to winter colluvial accumulation or inactive hillslope processes (Bača Citation2008, Recking Citation2012, Rainato et al. Citation2017). In Mediterranean catchments, climatic, lithological and geomorphological factors, as well as land use can cause a predominance of the suspended fraction in the sediment transport processes (Vericat and Batalla Citation2010, Chahor et al. Citation2014, Paroissien et al. Citation2015). In fact, these areas usually have highly erodible soil, with silt, clay, sandy or flyschoid particles (Taguas et al. Citation2012, Abuiziah et al. Citation2013, Rodrigo Comino et al. Citation2016). Although most of the total annual suspended load is mobilized between autumn and spring, intense floods can occur throughout the hydrological year leading to high values of suspended sediment concentration.
The material released from the sediment sources is one of the main controlling factors in suspended sediment transport processes (Zabaleta et al. Citation2007, Recking Citation2012). Its dynamics are affected by the antecedent hydrological regime which, in turn, determines the link between sediment availability and the way in which subsequent floods occur (Gentile et al. Citation2010a). Hillslopes and streambanks degraded by erosional processes are the main sediment source areas, but the channel bed can also become an active source area when the fine sediment deposited is re-suspended (Park and Hunt Citation2017). The channel stability can be disturbed by large flood events which can induce an increase in sediment availability over the long term (Lenzi and Marchi Citation2000, Picco et al. Citation2012). At catchment scale, the sediment supply can be strongly influenced by the land use (Zabaleta et al. Citation2007, Gentile et al. Citation2010b, Nadal-Romero et al. Citation2013), but it depends, in particular, on the characteristics of sediment source areas (i.e. quantity and location in the watershed), as well the degree of connectivity with the channel network (Cavalli et al. Citation2013, Aich et al. Citation2014). An effective coupling between sediment sources and fluvial systems can lead to relevant sediment fluxes along the stream network (Recking Citation2012), while a lack of connectivity can cause a discrepancy between erosion rates in the catchment and the amount of sediment exported from it (Cavalli et al. Citation2013, Mao and Carrillo Citation2017, Rainato et al. Citation2017).
Since water discharge and suspended sediment concentration show a high variability and no univocal relationship through hydrological events, they usually describe a hysteretic loop. A first description of the principal hysteresis types was made by Williams (Citation1989), who identified the single-valued line, clockwise loop, counter-clockwise loop, single line plus loop and figure eight loop. In recent decades, many studies have used this classification to describe hysteresis patterns, also demonstrating that the interpretation of the main controlling factors of suspended sediment dynamics, as well their relationships with the hysteresis loops, can be difficult due to their complex nature (Lenzi and Marchi Citation2000, Jansson Citation2002, Zabaleta et al. Citation2007, García-Rama et al. Citation2016). For this reason, many authors studied neighbouring or nested catchments. Brasington and Richards (Citation2000) analysed five small catchments (from 0.83 to 4.14 km2) in the Nepal Middle Hills (Himalaya), observing no clear relationship between hysteresis behaviour and storm magnitude. Zabaleta et al. (Citation2007) compared three catchments (3–48 km2) in the Basque Country (Spain), selected for their different characteristics in terms of size, lithology, vegetation, land use and annual rainfall. They studied discharge, precipitation and suspended sediment concentration, in event and pre-event conditions, and established that the major factors determining suspended sediment yield as well as the relationship between hysteresis types and runoff generation variables are linked to the catchment scale and land-use changes. Smith and Dragovich (Citation2009) investigated the hysteresis patterns to better understand the sediment delivery processes in two nested (1.64–53.50 km2) catchments located in southeastern Australia. The authors tested a dimensionless similarity function to compare the SSC–Q hysteretic relationships, stressing that the dis(similarity) observed between the nested watersheds was related to the rainfall–runoff scenarios and, in particular, to event magnitude.
According to many authors (Seeger et al. Citation2004, Zabaleta et al. Citation2007), analysing a large number of variables through a factorial analysis can help to highlight the main drivers that control sediment transport. Also, a comparison between catchments characterized by different features can give interesting insights into their hydrological and sediment transport behaviour (Iacobellis et al. Citation2011, Duvert et al. Citation2012, López-Tarazón and Estrany Citation2017).
The aim of this study is to investigate the suspended sediment dynamics at event scale for two instrumented catchments: a Mediterranean watershed (Carapelle) and an Alpine watershed (Rio Cordon). The sites have very different spatial scales, as well geo-climatic, hydrological, morphological and land-use characteristics. The Carapelle is a medium-size Mediterranean catchment (area: 499.40 km2), whereas the Rio Cordon can be defined as a small Alpine watershed (area: 5.07 km2). The climatic, hydrological and suspended transport characteristics exhibited by a total of 71 flood events were used to explore the main controlling factors and predictability of suspended sediment dynamics. Then, using long-term data series (≥5 years), the specific objectives of the study are to: (a) evaluate the factors that control the suspended sediment transport in the study sites at the event scale; (b) analyse the relationships between rainfall, hydrological and suspended load characteristics, verifying their predictability; and (c) establish a possible link between the main components of suspended sediment transport with the shape and direction of the hysteresis loops.
2 Material and methods
2.1 Study sites
2.1.1 Carapelle catchment
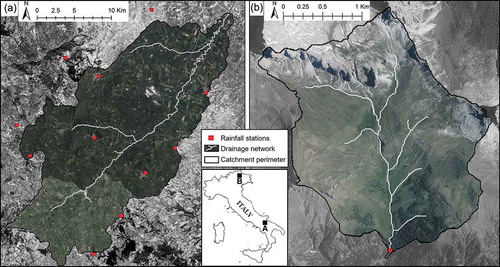
The Carapelle is a medium-sized catchment of 499.40 km2 ()) located in the south of Italy, in the Apulia Region. The catchment ranges between 112 and 1094 m a.s.l., with an average slope of 15.0%. The main channel exhibits a mean gradient of 12.1%, with an intermittent hydrological regime. The upper part of the watershed is characterized by degradable areas, mainly formed from the flyschoid formations of the Apennine chain (Aquilino et al. Citation2014), while the Tavoliere alluvial flat, formed from clayey-sandy sediments of the Pliocene–Pleistocene, is crossed by the Carapelle torrent before it flows into the Adriatic Sea. The largest part of the catchment is cultivated with wheat (78.9% of the total area) and, to a much lesser extent, with olive trees (2.0%), while forest (7.8%) and grasslands (3.1%) are located in the upper areas (Romano et al. Citation2018). Despite the farming activities, the catchment is not terraced and no significant anthropogenic pressures can be observed along the channel network. The climate is typically Mediterranean: rainfall varies significantly among the different weather stations located in the catchment, with annual precipitation ranging between 450 and 800 mm, as well as temperatures with average annual values ranging between 10 and 16°C. Due to the spatial and temporal variability of rainfall distribution, intense events can occur in all seasons of the year (Milella et al. Citation2012). Since 1985, the flow discharge of the Carapelle torrent has been monitored by the Functional Centre of the Apulia Region Civil Protection Department (ARCPD). Specifically, the Ordona–Castelluccio dei Sauri bridge section has been equipped with an Etg ULS-15 ultrasound stage meter, a Siap MECH-EL 5552 traditional electro-mechanical stage meter and a cableway. Monitored flow data are transmitted by telemetry. In 2007, the Department of Agricultural and Environmental Science of the University of Bari installed a Solitax HS-LINE SC optical infrared turbidity meter for the measurement of suspended sediment transport. This device has a measurement range of 0.001–150 g L−1 and is located in a perforated pipe, for protection purposes and to avoid errors due to the effect of solar radiation (Orwin and Smart Citation2005). The instrumentation was first calibrated in the laboratory and then on site (Gentile et al. Citation2010a). In the Carapelle catchment, rainfall is monitored by the ARCPD, which provided the 30-min data recorded by the 11 raingauge stations that influence the watershed based on the application of the Thiessen method. According to this method, the available 30-min raingauge observations were used to calculate the total rainfall, dividing the watershed into polygons around the measurement stations, and then computing the weighted average of the measurements based on the size of the single polygons. In the case of periods of missing data in a raingauge station the Thiessen polygons were redefined.
Figure 1. (a) The Carapelle catchment and (b) the Rio Cordon catchment, in Italy.
2.1.2 Rio Cordon catchment
The Rio Cordon catchment is located in the eastern Italian Alps, with a catchment area of 5.07 km2 ()). The watershed ranges between 1763 and 2763 m a.s.l. and has typical Alpine climatic conditions: mean annual temperature is 4°C, while average annual precipitation is 1150 mm, which occurs mainly as snowfall between November and April and as storms in summer. Consequently, the main stream exhibits a perennial hydrological regime, with a predominance of snowmelt contribution between May and June, while floods triggered by heavy rainfall prevail in summer and early autumn. Most of the catchment features Alpine grasslands and shrubs, while 14% of the watershed area is bare land (Rainato et al. Citation2018a). The lower part of the catchment (6%) is covered by forests. The lithology is dominated by dolomites, limestones and volcaniclastic conglomerates in the upper part of the catchment, while calcareous, calcareous–marly and arenaceous rocky outcrops characterize the lower part. The average catchment slope is 52%, while the Rio Cordon stream has a mean gradient of 13.6%. A 2016 inventory (Ferrato et al. Citation2017) showed that about 13% of the catchment was covered by sediment source areas, which are mainly talus slopes, landslides and erosional areas (surficial erosion). Due to the presence of a low-gradient belt, the upper part of the catchment appears disconnected from the outlet, providing a minor contribution to the total sediment yield (TSS) (Dalla Fontana and Marchi Citation2003). Consequently, the channel network exhibits low to moderate sediment supply conditions in its lower reach (Mao et al. Citation2009). In 1985, a permanent monitoring station was installed in the outlet section of the Rio Cordon catchment. This was set up by a collaboration between ARPA Veneto and TeSAF Department (University of Padova) and consists of an inlet flume, an inclined grid that separates coarse sediment from water and fine material, a storage area for the bedload material, a settling basin for the suspended load material and an outlet flume. Several previous papers have described in detail the features and accuracies of the numerous devices installed in the station for monitoring climatic conditions, water discharge, bedload and suspended sediment transport (e.g. Fattorelli et al. Citation1988, D’Agostino and Lenzi Citation1999, Rainato et al. Citation2017). Specifically, a water gauge coupled with a turbidimeter was installed in both the inlet and outlet channels, measuring hourly water discharge and turbidity. As in the Carapelle catchment, the data produced by the Rio Cordon monitoring station permitted the hydrological features and sediment dynamics of the catchment to be investigated over the years (Lenzi et al. Citation1999, Citation2003, Citation2004, Lenzi and Marchi Citation2000, Mao et al. Citation2008, Picco et al. Citation2012, Rainato et al. Citation2018b). The monitoring station is the only anthropogenic influence present in the Rio Cordon catchment.
2.2 Dataset preparation and analysis
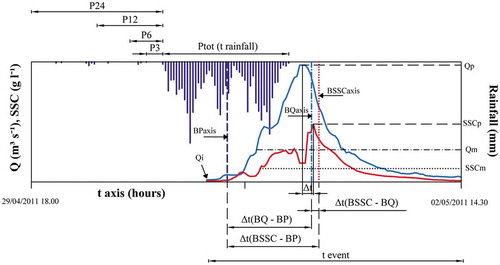
To investigate the sediment dynamics at the event scale, 41 and 30 flood events were isolated and analysed in the Carapelle (period: 2007–2011) and Rio Cordon (period: 1987–2014) catchments, respectively. The variables studied for every event, grouped in flow-event conditions and antecedent flow-event conditions, are reported in . A graphical description of the event variables is shown in .
Table 1. Variables and units associated to the single hydrological events.
Figure 2. Graphical explanation of the studied variables. The acronyms of the variables are explained in .
In order to make a sound comparison between the two catchments, snowmelt events from the Rio Cordon were not analysed, because this process does not occur in the Carapelle catchment. The main characteristics of the studied events are indicated in the Supplementary material, in which 18 events (nine each for the Carapelle and the Rio Cordon) are also reported, in terms of pluviograph, hydrograph, sedigraph and associated hysteresis cycle.
To isolate the flood events, the beginning of an event was identified by the time showing a significant increase in water discharge (Q) or suspended sediment concentration (SSC), while the end was identified by the time at which the descending limbs of both variables register constant values. When a multi-peak flood event caused by persistent rainfall was observed, it was divided into single events when the rising and exhaustion limbs for both Q and SSC were clearly identifiable. Otherwise, it was considered as multiple. The hysteresis relationship between Q and SSC at the event scale was described by analysing the SSC/Q ratios of the rising and descending limbs of the hydrograph and sedigraph (García-Rama et al. Citation2016). All the events were then classified according to their loop direction (clockwise or counter-clockwise) and shape (circular, linear or eight-shaped). A loop is considered clockwise if the water discharge peak Qp occurs after the sediment peak SSCp or if the ratios SSC/Q on the rising limb of the hydrograph show higher values than those on the falling limb (Williams Citation1989). The loop is considered counter-clockwise for the contrary conditions. In their simplest form, clockwise and counter-clockwise loops are circular. Their width depends substantially on the time lag between SSC and Q peaks, and the amplitude of the hydrograph in relation to the sedigraph. Multiple peaks in the hydrograph or sedigraph usually generate a combination of clockwise and counter-clockwise loops, called an eight-shaped loop. Linear loops occur when there is a unique relationship between water discharge and sediment concentration. The main characteristics of all the observed hysteresis loops, as well their direction and shape, are reported in the Supplementary material.
Some complex loops due to multi-peak events were associated with the eight-shaped form and were classified as predominantly clockwise or counter-clockwise according to the arrival order of the water discharge and sediment concentration peaks (e.g. event 3 for the Carapelle and event 5 for the Cordon). The barycentres of the pluviograph (BP), sedigraph (BSSC) and hydrograph (BQ) were also calculated to add information about the lag times during the events, as the barycentres are rarely contemporaneous to the peak of their respective graphs. Varignon’s theorem of moments was used for the barycentre calculation, assuming as origin the start of the rainfall, for the pluviograph, and the start of the event for the hydrograph and sedigraph. In both study sites, the variables collected by the flood event analysis () allowed their descriptive statistics to be defined (), as well as their correlation matrices. To analyse the main drivers controlling the suspended sediment transport in each catchment, and to evaluate the relationships between these main features and the direction and shape of the loops, principal component analysis (PCA) was used, considering only the controlling variables common to both catchments. The PCA allows one to convert and project a large dataset into a new coordinate system, so that few components retain the maximum of the total variance (Abdi Citation2003). Thus, the PCA is a dimension-reduction tool that can be used to reduce a large set of variables to a small set that still contains most of the information. The PCA was performed using the XLSTAT software package (Addinsoft, https://www.xlstat.com/en/).
Table 2. Descriptive statistics resulting from the analyses of the single hydrological events and associated variables (see ). A total of 41 and 30 single floods were recorded, respectively, in the Carapelle and Rio Cordon watersheds. Min: minimum; Max: maximum; SD: standard deviation.
3 Results
3.1 Analysis of the correlation matrices
3.1.1 Antecedent conditions
In the case of the Carapelle catchment, the correlation matrix shows that antecedent rainfall affects only the initial water discharge Qi, i.e. the initial water discharge of the flow event (). In particular, there is a good correlation between Qi and the precipitation at 12 and 24 h before the flow event (R = 0.538 and R = 0.620, respectively). Mean water discharge during the 24 h before the flow event (Qa1d) also shows a good correlation with the antecedent rainfall variables P12, P24 and P48 (R = 0.503, 0.602 and 0.654, respectively). It can be observed that the Qa1d shows better correlation with P48, while the initial values Qi are better correlated with P24. In this sense, Qa1d and Qi appear strongly correlated (R = 0.886); both show inverse correlations with the time lag between the barycentre of the sedigraph and that of the pluviograph ∆t(BSSC–BP) (R = −0.413 and R = −0.369, respectively).
Table 3. Correlation matrix for the parameters analyzed in the forty-one Carapelle events (see ). The coefficients in bold are significant p-value < 0.01.
From the correlation matrix of the Rio Cordon variables it can be deduced that the precipitation in the 3, 6 and 12 h antecedent to the event are inversely related to the time lag ∆t(BSSC–BQ) (R = −0.511, R = −0.557 and R = −0.519, respectively). Also, the antecedent precipitations (P6, P12, P24 and P48) appear significantly correlated with the total rainfall that caused the flood ().
3.1.2 Hydrological conditions and suspended sediment dynamics
In the Carapelle catchment, Qp is a good descriptor for several hydrological and suspended load variables. In particular, the peak of discharge is strongly related to Ru (R = 0.826), QSSC (R = 0.979) and TSS (R = 0.852). Although to a lesser extent, mean discharge, Qm, also appears to be a relevant descriptor for many investigated variables. Notably, Qm shows significant correlation with QSSC (R = 0.922), Ru (R = 0.784) and TSS (R = 0.762). In this regard, the total runoff of the event (Ru) exhibits a good correlation with the suspended load features, particularly with TSS (R = 0.916) and SSCQ (R = 0.667). Interestingly, Qi shows opposite behaviour to Qp and Qm. In fact, the initial water discharge is strongly related to the antecedent rainfall conditions, not showing any significant correlation with variables related to the hydrological or suspended load magnitude of the event. The correlation matrix shows that SSCQ (R = 0.798) and SSCp (R = 0.477) are positively correlated with the total sediment yield. The TSS is well correlated even with the rainfall that generated the flood event, as shown by R = 0.587 when it is correlated with total precipitation, Ptot.
In the Rio Cordon catchment, the suspended load variables are strongly correlated with the water discharge peak. Specifically, Qp exhibits a significant positive correlation with TSS (R = 0.902), SSCp (R = 0.859) and SSCQ (R = 0.817). The relationship between Qp and mean suspended sediment concentration is lower, but still significant (R = 0.530). Similarly to Qp, Qm is correlated with several hydrological and suspended load variables, but showing generally lower correlation coefficients. With the exception of the relationships with Ptot and SSCm, the total runoff of the event is a poor descriptor of the floods investigated, exhibiting low correlations with both hydrological and suspended load conditions. Focusing on the suspended sediment dynamics, SSCp is strongly related to most of the variables investigated, i.e. SSCQ (R = 0.983), TSS (R = 0.973), SSCm (R = 0.669) and, interestingly, it also shows a high correlation with average Iav (R = 0.672) and maximum Imax (R = 0.595) rainfall intensities. Generally, the variables linked to the peaks of water discharge (Qp, QSSC) and suspended sediment concentration (SSCp, SSCQ), as well TSS, are well correlated with Imax and Iav recorded during the floods.
3.1.3 Time delays
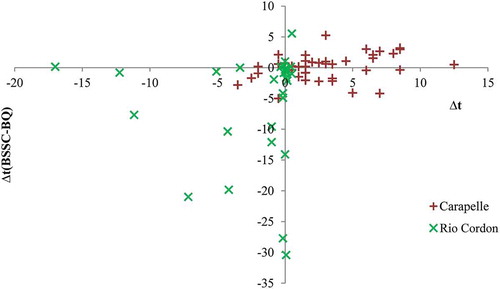
The time delays () show that most events in the Carapelle catchment are counter-clockwise, while in the Rio Cordon they are mostly clockwise, as reported in Section 3.2. Furthermore, shows that ∆t and ∆t(BSSC–BQ) are often both positive and negative in the same event, indicating a concordance of the delay between peaks with that between volumes. Both ∆t and ∆t(BSSC–BQ) are also significantly correlated in the Carapelle catchment ().
Figure 3. Comparison between the time lags of water discharge peak–suspended sediment concentration peak (∆t) and the corresponding time delays between sedigraph and hydrograph barycentres, ∆t(BSSC–BQ), recorded in the Carapelle and Rio Cordon catchments.
In the Carapelle catchment, ∆t is negatively correlated with many of the hydrological and suspended load variables. Interestingly, Qm (R = −0.711), Qp (R = −0.669), SSCp (R = −0.454), Ru (R = −0.543) and TSS (R = −0.464) decrease with an increasing time lag between discharge and suspended sediment concentration peaks. The transport variables generally show inverse correlation with the delays between centres of mass that characterize the pluviograph, hydrograph and sedigraph. Regarding this, the correlation indexes between ∆t(BSSC–BQ) and Qp, Ru, TSS, Ptot are −0.341, −0.567, −0.405 and −0.461, respectively. However, ∆t(BQ–BP) is negatively correlated with Qm (R = −0.382), SSCp (R = −0.365) and SSCm (R = −0.457), and ∆t(BSSC–BP) is negatively correlated with Qp (R = −0.413), SSCp (R = −0.454) and TSS (R = −0.363). Instead, a positive relationship (R = 0.460) was found between the time interval ∆t(BSSC–BP) and ∆t, so the longer the lag is between rainfall mass and mass of sediments transported, the longer the lag is between the sediment and flow peaks. The delay between rainfall and sediment masses, ∆t(BSSC–BP), is also strongly correlated with the lag ∆t(BQ – BP) between rainfall and discharge masses, as demonstrated by the correlation coefficient of 0.952 ().
No good correlation was observed between ∆t and any other variable in the Rio Cordon catchment (). In terms of time delays, ∆t(BQ–BP) shows a negative correlation with ∆t(BSSC – BQ). So, the longer the lag is between discharge and rainfall masses, the closer in time are the sedigraph and hydrograph barycentres. Instead, ∆t(BQ–BP) is positively correlated with Ru (R = 0.415). It is also worth noting that the time delay between sediment and discharge masses exhibits a negative correlation with both Ru (R = −0.767) and Ptot (R = −0.697). Lastly, ∆t(BSSC–BQ) shows a discrete correlation with the antecedent precipitation P3, P6 and P12.
Table 4. Correlation matrix for the parameters analyzed in the thirty Rio Cordon events (see Table 1). The coefficients in bold are significant p-value < 0.01.
3.2 Hysteresis patterns analysis
Events from both catchments were analysed individually, to assess the characteristics of the SSC–Q relationship. In 83% of events in the Carapelle, a counter-clockwise hysteresis was identified, whilst 68% of events in the Rio Cordon showed a clockwise behaviour. The different behaviour of the two catchments can also be observed by analysing the time delays shown in . In the Rio Cordon, during the May 2002 and July 2007 events, no clear hysteresis loops were identified due to the quite constant trend exhibited by the suspended sediment concentration. In the Carapelle torrent, all hystereses with clockwise direction presented an eight-shaped loop. Events showed a circular loop in 63% of cases in the Carapelle and 53% in the Rio Cordon.
3.3 Principal component analysis (PCA)
Principal component analysis (PCA) was used to analyse the main drivers controlling the suspended sediment transport in each catchment. For this purpose, only the variables that showed significant relationships with the suspended sediment dynamics (see Section 3.1) were considered. Specifically, the antecedent rainfall, Qa1d and Qi were excluded in the Carapelle and P3, P12, P24, P48 and Qi in the Rio Cordon.
The two main factors derived from the PCA explain 69.85% of the variance in the Carapelle catchment ()). The first factor, D1, explains 46.28%. It is influenced by Qp, Qm, QSSC, Ru, TSS, Ptot and ∆t, i.e. both flood and transport magnitude. The second factor, D2, seems to be dependent on the variables that define rainfall intensity and, hence, its erosivity (Imax and Iav), as well as the factors that control sediment availability at basin scale (SSCp and SSCm).
Figure 4. PCA for (a) the Carapelle catchment and (b) the Rio Cordon catchment. Component plot in rotated space. The variables are described in .
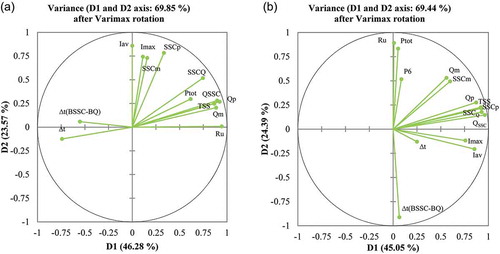
In the Rio Cordon catchment ()), the two main factors derived from the PCA explain 69.44% of the variance. Factor D1 explains 45.05% and is influenced by Qp, QSSC, SSCp, TSS, Imax and Iav. Factor D2 is apparently dependent on Ru, Ptot and ∆t(BSSC–BQ). This factor explains 24.39% of the variance.
In order to observe a possible link between the hysteresis behaviour and the variables and factors defined above, a PCA was performed for both catchments considering the loop direction and shape. The PCA conducted on the 41 events from the Carapelle catchment shows that five of the seven clockwise loops were controlled by factor D1. In contrast, the clockwise events 22 and 36 were influenced by the second component, D2 ().
Figure 5. Event distributions in the factorial planes according to hysteresis directions and hysteresis shape in (a, b) the Carapelle catchment and (c, d) the Rio Cordon catchment.
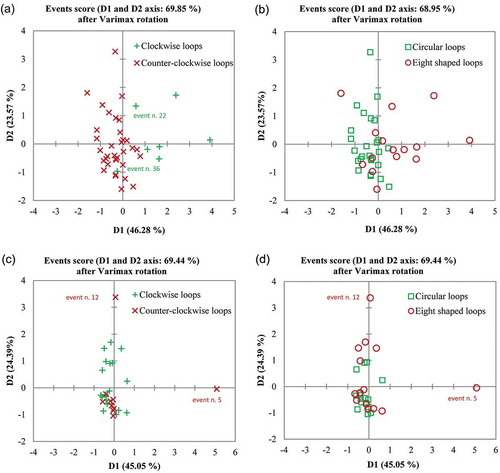
The use of PCA analysis on the 30 events recorded in the Rio Cordon highlighted that D1 and D2 cannot help to explain both the loops and the hysteresis shape observed during the floods (). However, a sort of weak influence of D1 with respect to all the events investigated seems to be appreciable, with the only exception being the high-magnitude flood in September 1994 (event 5). Furthermore, event 12 (15 November 2002) is closely linked to D2. This long rainfall event exhibited high sediment availability due to a mudflow that occurred during the 2001 snowmelt, which released a high quantity of fine material ready to be transported by the subsequent floods.
4 Discussion
4.1 Relationships between climatic, hydrological and suspended load characteristics at event scale
The long-term monitoring programmes in the Carapelle and Rio Cordon catchments enabled a large range of rainfall, flood and transport conditions recorded during 71 events to be investigated. Firstly, the controlling factors of the suspended sediment dynamics were investigated by analysing the relationships between the identified variables. In the Carapelle catchment, the correlation matrix shows that the initial flood conditions (i.e. Qi and Qa1d) were mainly controlled by the antecedent rainfall. In the Rio Cordon catchment, this relationship was not observed, but the previous precipitation seems to be directly related to the total rainfall that triggered the flood. This different behaviour between the study sites can be explained mainly by their different climates and sizes. The Carapelle catchment is an extensive Mediterranean catchment, in which the rainfall distribution shows a high temporal and spatial variability (Milella et al. Citation2012), while the Rio Cordon is a typical Alpine watershed characterized by the occurrence of intense rainstorms and a limited surface area, which induce a rapid and effective rainfall–runoff response (Penna et al. Citation2011).
In both study sites, the hydrological conditions and suspended sediment dynamics observed during flood events are strongly linked to the Qp recorded, suggesting that, in these catchments, the peak discharge may represent a good descriptor of the event magnitude. This result is consistent with the observations made by Duvert et al. (Citation2012), who analysed eight catchments (0.45–22 km2) located in the Mexican Volcanic Belt, the Spanish Pyrenees and the southern French Alps, and demonstrated that the event peak discharge was the best variable to describe the observed suspended sediment yields. In the Rio Cordon and Carapelle catchments, even Qm seems to somehow influence the hydrological conditions and the suspended sediment dynamics of the events, but this effect is less evident in the Alpine catchment. In terms of description of the hydrological conditions and suspended sediment dynamics, the total runoff produced during the flood (Ru) exhibits significant correlations in the Carapelle catchment. Regarding this, it should be noted that the correlations of TSS with Qp and Ru are characterized by very high values compared to the correlation between Qp and SSCp, and this could be related to an attenuation effect due to the catchment size. In the Rio Cordon, the total runoff poorly describes the variables investigated. This can be explained partly by the wide range of flood magnitudes analysed in the Alpine catchment. In addition to several high-frequency floods, some high-magnitude/low-frequency events were considered in the analysis (i.e. September 1994, October 1998 and May 2001). In particular, the exceptional event of September 1994 induced a significant change in the source areas, increasing the sediment supply, and thus altering the transport efficiency and sediment fluxes for approximately a decade (Rainato et al. Citation2017). Therefore, due to the succession of different sediment availability phases, the total runoff (Ru) in the Rio Cordon offers poor performance in describing the hydrological conditions and the suspended sediment dynamics.
It is worth noting that, in both study sites, the variables related to suspended sediment concentration (SSCp and SSCQ) and total sediment yield of the floods are significantly linked to rainfall intensities (Imax and Iav). These results seem to stress the role played by rainfall characteristics (intensity and amount), which, influencing the erosion processes, can strongly affect the suspended sediment dynamics at the event scale. Similar relationships were observed by López-Tarazón and Estrany (Citation2017) in two nested catchments on the island of Mallorca (Spain). In these Mediterranean catchments, the authors noted significant correlations between rainfall intensity and suspended sediment concentrations, ascribing the results to the control of rainfall on erosion-triggering and thus on sediment yield. In the Rio Cordon, the results seem to suggest that even Qp and Qm are controlled by the rainfall intensity and amount. Interestingly, in the Mediterranean catchment, TSS is positively related to Ptot, suggesting a direct and unaltered sedimentary response of the watershed to the amount of rainfall and thus an effective contribution of the active sediment sources (Walling Citation1999, López-Tarazón and Estrany Citation2017).
We also analysed the mass centres (i.e. barycentres) of the different graphs (i.e. hydrograph, sedigraph and pluviograph) and their relationships with the other variables. The contemporary analysis of the time gaps between peaks, as well as between mass centres of graphs, may integrate the information about the type of hysteresis (Klein Citation1984). In the Carapelle catchment, the time lag between Qp and SSCp exhibited a negative correlation with most of the variables related to hydrological conditions and suspended sediment dynamics, suggesting that ∆t is somehow inversely related to the magnitude of the event. In the light of the medium size of the catchment, these results seem to suggest a scenario of flood events triggered by rainfall of different intensities over the watershed, with heavy and localized precipitation, as frequently occurs in Mediterranean areas. This scenario might induce, on the one hand, a differential response of the catchment in terms of runoff processes (Qp) and sediment dynamics (SSCp) and, on other, the occurrence of low-magnitude events, since the intensities of localized rainfall could be mitigated by the large size of the catchment. Also, the inverse relationship between ∆t and Qp confirms that counter-clockwise loops are associated with lower flows. In fact, when the flow intensity increases, ∆t decreases until the loops assume a clockwise direction. This link between hysteresis direction and amount of water volume and sediment is further confirmed by the inverse correlations between ∆t and SSCp, Ru and TSS.
Because of the limited size of the Rio Cordon catchment, the response to rainfall generating a flood is almost immediate. An inverse relationship was observed between Ptot and Ru with ∆t(BSSC–BQ), suggesting that the higher the magnitude of rainfall and runoff, the shorter the distance between BSSC and BQ. This result seems to be consistent with the inverse correlation observed between ∆t(BQ–BP) and ∆t(BSSC–BQ), which indicates that the distance between the barycentres of the sedigraph and hydrograph decreases with the increasing distance between the pluviograph and hydrograph barycentres. This evidence seems to suggest that, in the Rio Cordon, antecedent precipitation affects the arrival time of the hydrograph and sedigraph masses (i.e. abundant and persistent rainfall can lead to a limited time gap between BSSC and BQ). The significant correlations among P3, P6 and P12 and ∆t(BSSC–BQ), as well between Ptot and Ru () suggest agreement with the hypothesis that, in the Alpine catchment, high-magnitude rainfall triggers high runoff volumes, in turn causing a rapid arrival of BSSC with respect to BQ. In the light of the absence of anthropogenic elements able to alter the sedimentary response (Walling Citation1999, Arnáez et al. Citation2015), this behaviour could be explained mainly by the geomorphic setting of the Alpine catchment and, in particular, by the evident disconnectivity that affects the catchment (Rainato et al. Citation2018a): low-magnitude precipitation causes high-frequency/low-magnitude events and, under such “ordinary” conditions, only the downstream (i.e. connected) source areas supply fine material, while the upstream sources (i.e. disconnected) cannot contribute. Thus, under these conditions, the suspended sediment transport exhibits a more rapid response than the water discharge. The prevalence of clockwise hysteresis (68%) seems to be consistent with this hypothesis. An opposite scenario seems to occur in the case of high-magnitude precipitation which induces high runoff volumes and thus causes a large and wide contribution by all source areas. These conditions mean that the response times of suspended sediment transport and water discharge are very similar. Interestingly, these results are in line with what was reported by Seeger et al. (Citation2004) for the Arnás catchment. In this small Pyrenean catchment, the authors observed that clockwise loops were generated mainly under ordinary conditions, when sediment supply and runoff generation were limited to sources close to the channel network, whilst counter-clockwise looped events were characterized by the contribution of source areas normally uncoupled from the channel network. In the Rio Cordon, the observed “lagged response” seems to affect only the suspended sediment dynamics and not the runoff generation processes, as demonstrated by the positive correlation between ∆t(BQ–BP) and Ru ().
4.2 Hysteresis patterns exhibited by the flood events
The results obtained from the investigation of the hysteresis patterns are in line with what was observed by García-Rama et al. (Citation2016), who analysed the Q/SSC relationships in two sub-periods of the Carapelle (2010–2011) and Rio Cordon (2004–2014) data series. In the Carapelle catchment a prevalence of anti-clockwise (i.e. counter-clockwise) loops was observed, while clockwise loops were more frequent in the Alpine catchment. This result is relatively comparable to what was reported by Bezak et al. (Citation2016), who analysed more than 500 station-years of daily Q and SSC data from Slovenian gauged streams, and noted the prevalence of clockwise loops with particular predominance of these in small watersheds. In both the Alpine and Mediterranean environments, the hysteresis relationships were frequently related to the location of sediment source areas. De Girolamo et al. (Citation2015) analysed the suspended sediment dynamics in the Celone stream in southeast Italy. In this Mediterranean catchment, the authors related the clockwise hysteresis to fine material directly released by the streambed, while anticlockwise loops were observed as a consequence of sediment slowly supplied by source areas all over the study site. Iida et al. (Citation2012) linked the clockwise hysteresis observed in a small mountain watershed, located on Honshu Island (Japan), to the material produced by channel bed erosion due, in turn, to flood events that occurred during the early snowmelt. Conversely, the authors observed counter-clockwise loops mainly during late snowmelt-driven floods, due to erosion processes spread over the catchment and triggered by the melted water. Specifically, the results obtained in the Rio Cordon seem to confirm that in this watershed clockwise loops were driven by the nearness of active sediment sources to the outlet and to the disconnection of the upper part of the catchment (Lenzi and Marchi Citation2000, Rainato et al. Citation2018a). Some of the clockwise events from this catchment show a quick diminution of SSC values after the peak, but a very slow decrease in Q values along the falling limb (events 1, 14 and 21). This rapid decrease of SSC could be explained by its dilution induced by a higher contribution of the baseflow during the falling limb (García-Rama Citation2017). The counter-clockwise hysteresis in the Rio Cordon can be related to the sediment supply produced by source areas distant from the monitoring station and activated only during high-magnitude/low-frequency events. Contrary to what is observed in the Rio Cordon, the Carapelle catchment features mostly counter-clockwise hysteresis. In the Mediterranean catchment, the prevalence of counter-clockwise loops might be explained by the location of the main sediment source areas, i.e. highly erodible hillslopes, covered with winter wheat in the upper part of the catchment (Abdelwahab et al. Citation2014, Citation2016). The different hysteresis pattern exhibited by the study sites could also be related to the different sediment availability in the catchments, since clockwise and counter-clockwise loops frequently describe low and high sediment supply conditions, respectively (López-Tarazón and Estrany Citation2017). Generally, the events in the Carapelle catchment show clear hysteresis loops due to the long duration of floods. The concentration time that characterizes this medium-sized catchment plays a key role in flow generation processes and hysteresis relationships. The durations of both rainfall and flood events are considerable. In the cases of clockwise, eight-shaped loops, the initial counter-clockwise behaviour is associated with the initial stage of the rainfall, while the following clockwise direction is induced by higher intensity rainfall. In these cases, the lag between solid concentration and water discharge is quite moderate, whilst it is considerably longer in most counter-clockwise cases. Interestingly, the results also seem to suggest that TSS exhibits high values when the hysteresis pattern is subtle, tending to assume a single curve (events 3, 12, 28 and 38). This is evident for both clockwise and counter-clockwise loops observed in the Carapelle catchment. Such behaviour is consistent with the inverse relationship between ∆t and TSS, suggesting that high sediment yields were recorded when Qp and SSCp responded similarly in time, i.e. under the scenario of rainfall spread over the entire catchment (see Section 4.1).
4.3 Main components controlling the suspended sediment dynamics
The PCA analysis was used to further investigate the main components of the suspended sediment transport, as well their relationships with the shape and direction of the hysteresis loops. A multivariate statistical analysis permitted Zabaleta et al. (Citation2007) to detect significant differences in the factors controlling the suspended sediment dynamics in three catchments in the Basque Country (Spain). Specifically, the authors observed that the relationships between Ptot, TSS, Qp, SSCp and SSCm change with variations in the extent and hydrological behaviour of the catchment, stressing the complex nature of suspended sediment transport. Moreover, Ayadi et al. (Citation2010) investigated the main factors controlling the sediment yield in 26 hillside reservoirs in central Tunisia, demonstrating the role played by geomorphology, drainage length and runoff properties, rather than catchment area, in the description of suspended sediment dynamics. In the Carapelle catchment, the PCA shows that the first component, D1, is related to the flood variables (Qp, Qm, QSSC and Ru), to TSS, Ptot and to the time lag ∆t. The second component, D2, includes the rainfall intensity variables (Imax and Iav) and hence its erosivity, as well the conditions of soil detachment and sediment availability (SSCp and SSCm). The stronger influence of the rainfall intensity variables Imax and Iav on the component D2, with respect to the lower correspondence of Ptot to the component D1, seems to confirm the role played by rainfall magnitude in the Carapelle erosion and transport processes. As observed by the factorial analysis on the hysteresis direction in this catchment, clockwise loops seem generally to be linked to higher-magnitude events. From the seven total clockwise events, five are influenced by the D1 component linked to flood intensity; the latter two (events 22 and 36), which depend on the D2 component, present the higher rate SSCp/Qp that could indicate highly sediment availability during flow due to the rainfall intensity. All clockwise loops in the Carapelle present eight-shaped hysteresis. However, as highlighted by the factorial analysis, the hysteresis shape fits both principal components D1 and D2 ()).
In the Rio Cordon catchment, the main factors of the PCA explain 69.44% of the variance. The first factor, D1, is influenced by Qp, QSSC, SSCp, TSS, Imax and Iav. Bearing in mind that rainfall intensity has been demonstrated to play a key role in the flood magnitude, and given that Qp, SSCp and TSS are a good proxy for this, the principal component results suggest that D1 can be related to flood intensity. The second factor, D2, is affected by Ru, Ptot and ∆t(BSSC–BQ). Hence, in the Rio Cordon, we can consider D2 to be mainly related to the water volumes. Plotting the 30 flood events on the factorial planes, neither the loop direction nor its shape can be explained by the two main components. Exceptions are two counter-clockwise events, event 5, which is strongly related to D1, and event 12, which is related to D2. Both events featured high sediment supply and particular conditions – linked to the flood magnitude in the case of event 5, and rainfall duration in the case of event 12.
5 Conclusions
By using a large dataset (71 flood events) produced by long-term monitoring programmes, this paper analyses and compares the suspended sediment dynamics in a Mediterranean catchment and an Alpine catchment. The diverse climate and size that characterize the catchments cause an evident difference in the rainfall–runoff response. Nevertheless, in both study sites, the antecedent rainfall variables, Imax and Iav, appeared strongly related to the suspended concentrations and amount of material transported by the events (TSS), stressing the role played by precipitation on the erosion processes. In both catchments, Qp was found to be a good descriptor of the hydrological and suspended sediment dynamics observed, while the total runoff produced during the event (Ru) showed significant correlations only in the Carapelle catchment. In the Rio Cordon watershed, the high-magnitude/low-frequency flood events occurring during the study period triggered significant changes in the sediment source areas over time, causing an alteration in the sediment transport efficiency. and then a low performance of Ru in describing the suspended sediment dynamics. Analysis of the hysteresis patterns exhibited by the events showed the prevalence of counter-clockwise loops in the Carapelle catchment (83%), while clockwise was the main direction observed in the Rio Cordon watershed (68%). This can be explained by the different catchment sizes and, in particular, by the sediment supply conditions that characterize the study sites.
The PCA further distinguished the main factors controlling suspended sediment dynamics in the two study sites. In the Carapelle catchment, the results stressed that a key role is played by the flood variables, rainfall intensities and sediment availability, also highlighting that the clockwise loops were mainly related to the high magnitude of the events, while the shape was influenced by both the main components analysed. In the Rio Cordon watershed, the sediment transport behaviour appeared to be influenced mainly by flood magnitude and runoff volumes, while neither the loop nor shape of the hysteresis pattern were described by the main components.
The results of this study show that the analysis of long-term data series can help to better understand the complex suspended sediment dynamics acting in Alpine and Mediterranean catchments, permitting useful results to be obtained for applications such as catchment management and infrastructure design.
Supplemental Material
Download MS Word (585.9 KB)Acknowledgments
The Carapelle rainfall data were kindly provided by the Apulia Region Civil Protection Department (ARCPD). We would like to thank Matteo Cesca (ARPA Veneto), who partly provided the data recorded by the Rio Cordon monitoring station and Alison Garside for revising the English. Also, we would like to thank the Associate Editor (Jesús Rodrigo-Comino) and two anonymous reviewers for their constructive comments, which helped us to improve the manuscript.
Disclosure statement
No potential conflict of interest was reported by the authors.
Supplementary material
Supplemental data for this article can be accessed here.
Additional information
Funding
Related Research Data
References
- Abdelwahab, O.M.M., et al., 2014. Effectiveness of alternative management scenarios on the sediment load in a Mediterranean agricultural watershed. Journal of Agricultural Engineering, 45 (3), 125–136. doi:10.4081/jae.2014.430.
- Abdelwahab, O.M.M., et al., 2016. Evaluation of alternative management practices with the AnnAGNPS model in the Carapelle watershed. Soil Science, 181 (7), 293–305. doi:10.1097/SS.0000000000000162.
- Abdi, H., 2003. Factor rotations in factor analyses. Encyclopedia for research methods for the social sciences. Thousand Oaks, CA: Sage, 792–795.
- Abuiziah, I., et al., 2013. Modelling soil erosion and sediment transport under different land management options in a Southern Italy watershed. International Journal of Safety and Security Engineering, 3 (2), 116–127. doi:10.2495/SAFE-V3-N2-116-127.
- Aich, V., Zimmermann, A., and Elsenbeer, H., 2014. Quantification and interpretation of suspended-sediment discharge hysteresis patterns: how much data do we need? Catena, 122, 120–129. doi:10.1016/j.catena.2014.06.020
- Aquilino, M., et al., 2014. Evaluating the potential of GeoEye data in retrieving LAI at watershed scale. Proceedings of SPIE - the International Society for Optical Engineering, 9239, 92392b 1–11. doi:10.1117/12.2067185,2014
- Arismendi, I., et al., 2017. Suspended sediment and turbidity after road construction/improvement and forest harvest in streams of the trask river watershed study, oregon. Water Resources Research, 53, 6763–6783. doi:10.1002/2016WR020198
- Arnáez, J., et al., 2015. Effects of farming terraces on hydrological and geomorphological processes. A review. Catena, 128, 122–134. doi:10.1016/j.catena.2015.01.021
- Asselman, N.E.M., 1999. Suspended sediment dynamics in a large drainage basin: the River Rhine. Hydrological Processes, 13, 1437–1450. doi:10.1002/(SICI)1099-1085(199907)13:10<1437::AID-HYP821>3.0.CO;2-J
- Ayadi, I., et al., 2010. Sediment yield variability in central Tunisia: a quantitative analysis of its controlling factors. Hydrological Sciences Journal, 55 (3), 446–458.
- Bača, P., 2008. Hysteresis effects in suspended sediment concentration in the Rybáric basin, Slovakia. Hydrological Sciences Journal, 53 (1), 223–235. doi:10.1623/hysj.53.1.224.
- Barsch, D., et al., 1994. Sediment transport and discharge in a high arctic catchment (Liefdefjorden, NW Spitsbergen). In: P. Ergenzinger and K.H. Schmidt, eds. Dynamics and geomorphology of mountain rivers. Berlin: Springer, 225–237. doi:10.1007/BFb0117842.
- Bezak, N., Šraj, M., and Mikoš, M., 2016. Analyses of suspended sediment loads in Slovenian rivers. Hydrological Sciences Journal, 61, 1094–1108.
- Bogen, J., 1995. Sediment transport and deposition in mountain rivers. In: I.D.L. Foster, A.M. Gurnell, and B.W. Webb, eds. Sediment and water quality in river catchments. Chichester: J. Wiley, 437–451.
- Brasington, J. and Richards, K., 2000. Turbidity and suspended sediment dynamics in small catchments in the Nepal Middle Hills. Hydrological Processes, 14, 2559–2574.
- Cavalli, M., et al., 2013. Geomorphometric assessment of spatial sediment connectivity in small Alpine catchments. Geomorphology, 188, 31–41. doi:10.1016/j.geomorph.2012.05.007
- Chahor, Y., et al., 2014. Evaluation of the AnnAGNPS model for predicting runoff and sediment yield in a small Mediterranean agricultural watershed in Navarre (Spain). Agricultural Water Management, 134, 24–37. doi:10.1016/j.agwat.2013.11.014
- Comiti, F., et al., 2011. Channel adjustments and vegetation cover dynamics in a large gravel bed river over the last 200 years. Geomorphology, 125 (1), 147–159. doi:10.1016/j.geomorph.2010.09.011.
- D’Agostino, V. and Lenzi, M.A., 1999. Bedload transport in the instrumented catchment of the Rio Cordon: part II. Analysis of the bedload rate. Catena, 36, 191–204.
- De Girolamo, A.M., Pappagallo, G., and Lo Porto, A., 2015. Temporal variability of suspended sediment transport and rating curves in a Mediterranean river basin: the Celone (SE Italy). Catena, 128, 135–143. doi:10.1016/j.catena.2014.09.020
- DeBoer, D.H. and Campbell, I.A., 1989. Spatial scale dependence of sediment dynamics in a semi-arid badland drainage basin. Catena, 16, 277–290. doi:10.1016/0341-8162(89)90014-3
- Duvert, C., et al., 2012. Towards prediction of suspended sediment yield from peak discharge in small erodible mountainous catchments (0.45–22 km2) of France, Mexico and Spain. Journal of Hydrology, 454–455, 42–55.
- Fattorelli, S., et al., 1988. An experimental station for the automatic recording of water and sediment discharge in a small alpine catchment. Hydrological Sciences Journal, 33, 607–617. doi:10.1080/02626668809491293
- Ferrato, C., et al., 2017. An updated source areas inventory in the Rio Cordon catchment (Dolomites). Rendiconti Online Società Geologica Italiana, 42, 10–13.
- Fontana, D.G. and Marchi, L., 2003. Slope-area relationship and sediment dynamics in two alpine streams. Hydrological Processes, 17, 73–87. doi:10.1002/hyp.1115
- García-Rama, A., 2017. Suspended sediment fluxes in an Alpine torrent basin. Ph.D Thesis, University of Padova, TeSAF Department, p 167.
- García-Rama, A., et al., 2016. Suspended sediment transport analysis in two Italian instrumented catchments. Journal of Mountain Sciences, 13 (6), 957–970. doi:10.1007/s11629-016-3858-x.
- Gentile, F., et al., 2010a. Monitoring and analysis of suspended sediment transport dynamics in the Carapelle torrent (Southern Italy). Catena, 80, 1–8. doi:10.1016/j.catena.2009.08.004
- Gentile, F., Bisantino, T., and Trisorio Liuzzi, G., 2010b. Erosion and sediment transport modelling in Northern Puglia watersheds. WIT Transactions on Engineering Sciences, 67, 199–212. doi:10.2495/DEB100171
- Iacobellis, V., et al., 2011. Flood quantiles estimation based on theoretically derived distributions: regional analysis in Southern Italy. Natural Hazards and Earth System Sciences, 11 (3), 673–695. doi:10.5194/nhess-11-673-2011.
- Iida, T., et al., 2012. Effect of seasonal snow cover on suspended sediment runoff in a mountainous catchment. Journal of Hydrology, 428–429, 116–128. doi:10.1016/j.jhydrol.2012.01.029
- Jansson, M.B., 2002. Determining sediment source areas in a tropical river basin, Costa Rica. Catena, 47, 63–84. doi:10.1016/S0341-8162(01)00173-4
- Kerr, J.G. and Cooke, C.A., 2017. Erosion of the Alberta badlands produces highly variable and elevated heavy metal concentrations in the Red Deer River, Alberta. Science of Total Environment, 596, 427–436. doi:10.1016/j.scitotenv.2017.04.037
- Klein, M., 1984. Anti-clockwise hysteresis in suspended sediment concentration during individual storms. Catena, 11, 251–257. doi:10.1016/0341-8162(84)90014-6
- Lenzi, M.A., D’Agostino, V., and Billi, P., 1999. Bedload transport in the instrumented catchment of the Rio Cordon: part I: analysis of bedload records, conditions and threshold of bedload entrainment. Catena, 36, 171–190. doi:10.1016/S0341-8162(99)00016-8
- Lenzi, M.A., Mao, L., and Comiti, F., 2003. Interannual variation of suspended sediment load and sediment yield in an alpine catchment. Hydrological Sciences Journal, 48, 899–915. doi:10.1623/hysj.48.6.899.51425
- Lenzi, M.A., Mao, L., and Comiti, F., 2004. Magnitude-frequency analysis of bed load data in an Alpine boulder bed stream. Water Resources Research, 40 (7), 1–12. doi:10.1029/2003WR00296.
- Lenzi, M.A. and Marchi, L., 2000. Suspended sediment load during floods in a small stream of the Dolomites (Northeastern Italy). Catena, 39, 267–282. doi:10.1016/S0341-8162(00)00079-5
- López-Tarazón, J.A., et al., 2012. The sediment budget of a highly dynamic mesoscale catchment: the River Isabena. Geomorphology, 138, 15–28. doi:10.1016/j.geomorph.2011.08.020
- López-Tarazón, J.A. and Estrany, J., 2017. Exploring suspended sediment delivery dynamics of two Mediterranean nested catchments. Hydrological Processes, 31 (3), 698–715. doi:10.1002/hyp.11069.
- Mao, L. and Carrillo, R., 2017. Temporal dynamics of suspended sediment transport in a glacierized Andean basin. Geomorphology, 287, 116–125. doi:10.1016/j.geomorph.2016.02.003
- Mao, L., et al., 2009. Sediment transfer processes in two Alpine catchments of contrasting morphological settings. Journal of Hydrolology, 364, 88–98. doi:10.1016/j.jhydrol.2008.10.021
- Mao, L., et al., 2008. Field based analysis of sediment entrainment in two high gradient streams located in Alpine and Andine environments. Geomorphology, 93, 368–383. doi:10.1016/j.geomorph.2007.03.008
- Milella, P., et al., 2012. Diagnostic analysis of distributed input and parameter datasets in Mediterranean basin streamflow modeling. Journal of Hydrology, 472–473, 262–276. doi:10.1016/j.jhydrol.2012.09.039
- Mills, C.F. and Bathurst, J.C., 2015. Spatial variability of suspended sediment yield in a gravel bed river across four orders of magnitude of catchment area. Catena, 133, 14–24. doi:10.1016/j.catena.2015.04.008
- Mouri, G., Ros, F.C., and Chalov, S., 2014. Characteristics of suspended sediment and river discharge during the beginning of snowmelt in volcanically active mountainous environments. Geomorphology, 213, 266–276. doi:10.1016/j.geomorph.2014.02.001
- Nadal-Romero, E., Lasanta, T., and García-Ruiz, J.M., 2013. Runoff and sediment yield from land under various uses in a Mediterranean mountain area: long-term results from an experimental station. Earth Surface Processes and Landforms, 38 (4), 346–355. doi:10.1002/esp.3281.
- Orwin, J.F. and Smart, C.C., 2005. An inexpensive turbidimeter for monitoring suspended sediment. Geomorphology, 68, 3–15. doi:10.1016/j.geomorph.2004.04.007
- Park, J. and Hunt, J.R., 2017. Coupling fine particle and bedload transport in gravel-bedded streams. Journal of Hydrology, 552, 532–543. doi:10.1016/j.jhydrol.2017.07.023
- Paroissien, J.B., et al., 2015. A method for modeling the effects of climate and land use changes on erosion and sustainability of soil in a Mediterranean watershed (Languedoc, France). Journal of Environmental Management, 150, 57–68. doi:10.1016/j.jenvman.2014.10.034
- Pavanelli, D. and Cavazza, C., 2010. River suspended sediment control through riparian vegetation: a method to detect the functionality of riparian vegetation. Clean Soil Air Water, 38, 1039–1046. doi:10.1002/clen.201000016
- Penna, D., et al., 2011. The influence of soil moisture on threshold runoff generation processes in an alpine headwater catchment. Hydrology and Earth System Sciences, 15, 689–702. doi:10.5194/hess-15-689-2011
- Picco, L., et al., 2012. An update of the magnitude-frequency analysis of Rio Cordon (Italy) bedload data after 25 years of monitoring. IAHS-AISH Publication, 356, 65–71.
- Picco, L., et al., 2016. Linking riparian forest structure and fluvio-morphological characteristics in a gravel-bed river (Piave river-Italian alps). Ecohydrology, 9, 101–112. doi:10.1002/eco.1616
- Rainato, R., et al., 2017. Three decades of monitoring in the Rio Cordon instrumented basin: sediment budget and temporal trend of sediment yield. Geomorphology, 291, 45–56. doi:10.1016/j.geomorph.2016.03.012
- Rainato, R., Mao, L., and Picco, L., 2018b. Near-bankfull floods in an Alpine stream: effects on the sediment mobility and bedload magnitude. International Journal of Sediment Research, 33 (1), 27–34. doi:10.1016/j.ijsrc.2017.03.006.
- Rainato, R., et al., 2018a. Coupling climate conditions, sediment sources and sediment transport in an alpine basin. Land Degradation and Development, 29 (4), 1154–1166. doi:10.1002/ldr.2813.
- Recking, A., 2012. Influence of sediment supply on mountain streams bedload transport. Geomorphology, 175–176, 139–150. doi:10.1016/j.geomorph.2012.07.005
- Rodrigo Comino, J., et al., 2016. High variability of soil erosion and hydrological processes in Mediterranean hillslope vineyards (Montes de Málaga, Spain). Catena, 145, 274–284. doi:10.1016/j.catena.2016.06.012
- Romano, G., Abdelwahab, O.M.M., and Gentile, F., 2018. Modeling land use changes and their impact on sediment load in a Mediterranean watershed. Catena, 163, 342–353. doi:10.1016/j.catena.2017.12.039
- Seeger, M., et al., 2004. Catchment soil moisture and rainfall characteristics as determinant factors for discharge/suspended sediment hysteretic loops in a small headwater catchment in the Spanish Pyrenees. Journal of Hydrology, 288, 299–311. doi:10.1016/j.jhydrol.2003.10.012
- Smith, H.G. and Dragovich, D., 2009. Interpreting sediment delivery processes using suspended sediment‐discharge hysteresis patterns from nested upland catchments, south‐eastern Australia. Hydrological Processes, 23 (17), 2415–2426. doi:10.1002/hyp.7357.
- Soler, M., Latron, J., and Gallart, F., 2008. Relationships between suspended sediment concentrations and discharge in two small research basis in a mountainous Mediterranean area (Vallcebre, Eastern Pyrenees). Geomorphology, 98, 143–152. doi:10.1016/j.geomorph.2007.02.032
- Sun, L., et al., 2016. Suspended sediment dynamics at different time scales in the Loushui River, south-central China. Catena, 136, 152–161. doi:10.1016/j.catena.2015.02.014
- Taguas, E.V., et al., 2012. Modeling the contribution of ephemeral gully erosion under different soil managements: A case study in an olive orchard microcatchment using the AnnAGNPS model. Catena, 98, 1–16. doi:10.1016/j.catena.2012.06.002
- Vericat, D. and Batalla, R.J., 2005. Sediment transport in a highly regulated fluvial system during two consecutive floods (lower Ebro River, NE Iberian Peninsula). Earth Surface Processes and Landforms, 30 (4), 385–402. doi:10.1002/esp.1145.
- Vericat, D. and Batalla, R.J., 2010. Sediment transport from continuous monitoring in a perennial Mediterranean stream. Catena, 82, 77–86.
- Walling, D.E., 1999. Linking land use, erosion and sediment yields in river basins. Hydrobiologia, 410, 223–240.
- Williams, G.P., 1989. Sediment concentration versus water discharge during single hydrologic events in rivers. Journal of Hydrology, 111, 89–106. doi:10.1016/0022-1694(89)90254-0
- Zabaleta, A., et al., 2007. Factors controlling suspended sediment yield during runoff events in small headwater catchments of the Basque Country. Catena, 71, 179–190. doi:10.1016/j.catena.2006.06.007