
 ?Mathematical formulae have been encoded as MathML and are displayed in this HTML version using MathJax in order to improve their display. Uncheck the box to turn MathJax off. This feature requires Javascript. Click on a formula to zoom.
ABSTRACT
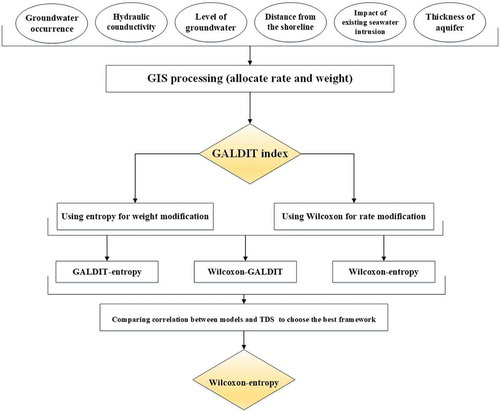
Recently, groundwater vulnerability assessment of coastal aquifers using the GALDIT framework has been widely used to investigate the process of groundwater contamination. This study proposes multi-attribute decision-making (MADM) entropy and Wilcoxon non-parametric statistical test methods to improve the vulnerability index of coastal aquifers. The rates and weights of this framework were modified using Wilcoxon non-parametric and entropy methods, respectively, and a combined framework of GALDIT-entropy, Wilcoxon-GALDIT, and Wilcoxon-entropy was obtained. Pearson correlation coefficients between the mentioned vulnerability indices and total-dissolved solids (TDS) of 0.51, 0.66 and 0.75, respectively, were obtained. According to the results, the Wilcoxon-entropy index had the highest correlation with TDS. Generally, it can be concluded that the proposed frameworks provide a more accurate estimation of vulnerability distribution in coastal aquifers.
Editor S. Archfield Associate editor A. Fiori
1 Introduction
Groundwater is the most important source of water, especially in the arid and semi-arid areas (Neshat et al. Citation2014b). Recently, overexploitation of groundwater resources has led to the vulnerability of these resources to seawater intrusion in coastal aquifers (Kazakis et al. Citation2018). Seawater intrusion can be defined as the influx of seawater into the freshwater in coastal aquifers, which is influenced by both natural and human processes (Werner and Simmons Citation2009). According to the American International Research Organization, all groundwater resources are vulnerable to contamination and, if contaminated, it is difficult to purge them (Hasiniaina et al. Citation2010); therefore, it is important to prevent groundwater contamination (Boufekane Citation2013). Assessment of groundwater vulnerability to seawater intrusion is one of the techniques used to help groundwater protection strategies (Trabelsi et al. Citation2016).
The aquifer vulnerability can be defined as the potential of the contaminant penetration and distribution from the ground surface into the groundwater system (Babiker et al. Citation2005). Selecting an appropriate technique to determine vulnerability depends on the target, size of the area, scale, data availability, time, cost and user needs (Trabelsi et al. Citation2016). The rating index methods are relatively simple and are used on a regional scale (Brindha and Elango Citation2015). Groundwater vulnerability assessment has been used by many researchers by applying rating index frameworks (e.g. Afshar et al. Citation2007, Abbasi et al. Citation2013, Kumar et al. Citation2013, Majandang and Sarapirome Citation2013, Yin et al. Citation2013, Neshat et al. Citation2014a, Citation2014b, Citation2014c, Citation2015, Bartzas et al. Citation2015, Iqbal et al. Citation2015, Kazakis and Voudouris Citation2015, Kura et al. Citation2015, Recinos et al. Citation2015, Neshat and Pradhan Citation2015a, Citation2015b, Citation2017, Jafari et al. Citation2016, Busico et al. Citation2017, Kang et al. Citation2017, Nadiri et al. Citation2017a, Citation2017b, Citation2017c).
Many frameworks have been developed to assess the vulnerability of aquifers, and among them, the GALDIT framework (Chachadi Citation2005) is highly suitable for assessing the vulnerability of coastal aquifers. This framework is composed of parameters corresponding to the hydrogeological conditions of aquifers: groundwater occurrence (G), aquifer hydraulic conductivity (A), height of groundwater level above sea level (L), distance from the shoreline (D), impact of the existing status of seawater intrusion (I) and thickness of the aquifer (T). This framework consists of three main parts: range, rate and weighting. The layers of each parameter are determined based on the rating and weighting system, and they are prepared and integrated into the ArcGIS environment in order to assess the potential of contamination. The GALDIT index is one of the most widely used vulnerability assessment indices for coastal aquifers, and has been used in several countries, such as Algeria (Bouderbala et al. Citation2016), Tunisia (Saidi et al. Citation2013, Trabelsi et al. Citation2016), Greece (Lappas et al. Citation2016, Kazakis et al. Citation2018) and Iran (Gorgij and Moghaddam Citation2016, Kardan Moghaddam et al. Citation2017, Motevalli et al. Citation2018).
The rating index methods are very effective due to their low need for available data and easy application, especially for areas with an uncertain source of contamination (Yu et al. Citation2012). The Wilcoxon non-parametric statistical test (Wilcoxon Citation1945) is one of the methods used to modify the rates of the rating index methods, and it uses the mean concentration of total-dissolved solids, TDS. The Wilcoxon method has been used in numerous studies to modify the rates of the vulnerability index. For example, in a study conducted in Kerman plain, Neshat et al. (Citation2014b) used a Wilcoxon non-parametric statistical model to modify the rates of the DRASTIC index by using nitrate concentration as a pollutant. Nadiri et al. (Citation2018) tried to modify and optimize the DRASTIC rating index in Ardabil plain using the Wilcoxon test and a genetic algorithm (GA). They applied unsupervised learning at level 1 and the supervised learning at level 2. The correlation coefficients between the results and nitrate concentrations showed that the amount of this coefficient was increased to 0.84 by using supervised learning.
The entropy weighting method is one of the multi-attribute decision-making (MADM) methods, which can determine the significance of each parameter in vulnerability. This method reduces the effects resulting from expert opinions in the weighting system of the rating index methods. This method has been applied in studies on aquifer vulnerability in order to modify the weight of the rating index methods. For example, Yu et al. (Citation2012) used fuzzy-optimization and entropy-weighted models in the north of China to assess the groundwater vulnerability, and compared the results with the original DRASTIC index. Their study concluded that the optimization models are able to accurately determine the relative vulnerability distribution. Sahoo et al. (Citation2016) used entropy, fuzzy and single-parameter sensitivity analysis methods to modify DRASTIC weights in the urban area of Kanpur, India. Their E-DRASTIC model accurately showed the vulnerable areas affected by alkalinity contamination in the study region.
There are a few scientific studies that have used modification methods to improve the GALDIT framework. For example, Kazakis et al. (Citation2018) used fuzzy method to modify the GALDIT framework in order to assess the vulnerability of coastal aquifers to seawater intrusion in northern Greece. Mahrez et al. (Citation2018) applied the GALDIT index in the Quaternary coastal Collo aquifer located in the north of Algeria in order to determine the vulnerability due to seawater intrusion. They also used the sensitivity analysis method to modify the GALDIT weights.
Given that there are still gaps in the research on the modification of the GALDIT framework, and the effects of contaminants were not considered in previous studies, this study proposes new frameworks to modify the vulnerability index of coastal aquifers. The Wilcoxon non-parametric statistical model was used for the first time as a new idea to modify the GALDIT rates. Also, its weights were modified by using entropy method for the first time. The novelty of this study is to use new frameworks such as GALDIT-entropy, Wilcoxon-GALDIT and Wilcoxon-entropy to improve the evaluation index of the coastal aquifer vulnerability. This paper investigates the application of statistical methods to enhance the ability of the common GALDIT framework in assessing coastal aquifer vulnerability to seawater intrusion.
2 Materials and methods
2.1 Study area
The Gharesoo-Gorgan Rood basin is located in the eastern part of the Alborz Mountains (54º00′–56º29′E, 36º36′–37º47′N) in the province of Golestan, Iran. The basin area is 4379 km2, and it has a boundary with the Atrak basin to the north and east, the basin of the central desert to the south and the Haraz-Neka basin to the southwest. The geographical location of the Gharesoo-Gorgan Rood basin is shown in . The study area has a dry and cold semi-arid climate. The temperature of this region increases from west to east and decreases from north to south. The average rainfall in this area is 300 mm/year, and the maximum degree of evaporation reaches 1900 mm annually. Also, the maximum and minimum absolute temperatures of the study area are 49ºC and – 28°C, respectively. The monthly average relative humidity fluctuates from 47% to 89%.
Figure 1. Geological map and hydro-lithological cross-section of the study area.
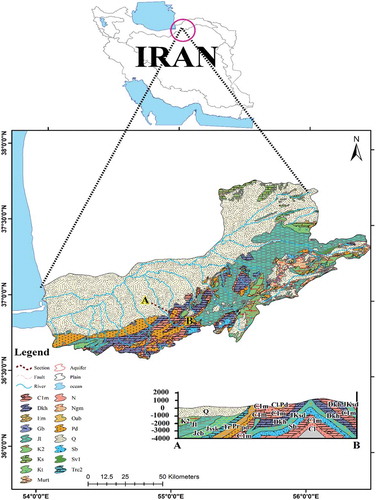
2.2 Geology and hydrology of the region
The formations of this area are Lar, Mozdouran, Khosh Yeylaq, Chaman Bid, Shemshak, and Elika. There are hard formation aquifers in carbonate rocks such as Mozdouran and Lar. The most important lithological units in the study area are Palaeozoic formations, Gorgan green schist, a collection of Jurassic schist and limestone, and Cretaceous limestone. Loess liquorices are widespread sediments of this region, which exist in the form of hills. The Neogene deposits in the study area include shale, marl, sand, and conglomerate, which has the highest surface expansion (). Hydrologically, aquifers in the study area are alluvial aquifers located in shallow areas, and hard formations aquifers located in highlands. Alluvial aquifers consist of sand, gravel, clay and loess deposits. The average thickness of the alluvial aquifer varies from 15 to 150 m. In Gorgan and Gonbad plains, the groundwater depth varies from – 26 to 188 m below ground level. Generally, in this plain, the water level curves have an east-to-west trend, and their numbers are decreased moving from the south to the north. Furthermore, the groundwater flow is from south to north and from east and southeast to west. Sixty-two percent of the water of this basin is supplied from groundwater resources. The hydraulic slope of groundwater decreases toward the north, with an average annual decline of 1.338 m. In general, in the water reservoir, the level of groundwater increases in wet periods due to the presence of rainfall and the reduced groundwater exploitation, and it significantly decreases in dry periods due to increased exploitation and reduced recharge. There are also 23 314 exploitation wells in this region.
2.3 GALDIT framework
The GALDIT vulnerability index is one of the most common vulnerability assessment frameworks for coastal aquifers; it consists of six parameters: groundwater occurrence (G), aquifer hydraulic conductivity (A), height of groundwater level above sea level (L), distance from the shoreline (D), impact of the existing status of seawater intrusion (l), and thickness of the aquifer (T). This framework uses a numerical rating and weighting system to assess the vulnerability of coastal aquifers. In addition, the GALDIT framework considers the physical properties which affect the potential of seawater contamination in a hydrological environment (Saidi et al. Citation2013). In this system, four rates of 2.5, 5, 7.5, and 10 are proposed for each parameter, according to Chachadi’s table (Citation2005), in which the higher rate represents greater vulnerability and vice versa. Then, the maps of all six parameters of this model are weighted, according to , so that the importance of each parameter in vulnerability is determined in the range of 1 (less important) to 4 (more important), as proposed by Chachadi (Citation2005). presents the weights, ranges and rates for each parameter of the GALDIT framework. The final vulnerability index is obtained by combining different layers of GALDIT in the ArcGIS software environment, as follows:
Table 1. Weights and rating of GALDIT parameters (Chachadi Citation2005).
2.4 Wilcoxon test to modify the rates of the GALDIT framework
The better understanding of vulnerability distribution in the region depends on the modification of the rates considering the aquifer’s hydrological properties. The rates of the GALDIT framework were modified using Wilcoxon non-parametric statistical test developed by Wilcoxon (Citation1945). This method is a kind of pair difference test, and it has high capability to determine the level of dependency between rates and hydrological properties (Nadiri et al. Citation2018). Total-dissolved solids (TDS) was selected as the main control parameter in the study area. This parameter was used to modify the GALDIT rates. Considering the coastal position of the study region, the TDS concentration can be used as an index to show a real situation of the study region. In this method, the highest and lowest rates were assigned to the highest and lowest mean TDS concentrations in each class of each parameter, considering the mean TDS concentration.
2.5 Shannon’s entropy theory for modification the weights of the GALDIT framework
The information theory was introduced by Shannon (Citation1948). The entropy method (Shannon entropy) is based on the fundamental principles of the information theory (Gray Citation2013). The information entropy is a concept of information theory which shows the amount of information available in a dataset. The entropy measures the uncertainty of the system. If the values of entropy are lower, then it indicates lower uncertainty of the related data (Li and Fu Citation2007). One of the determining factors of accuracy and confidence from decision-making problems is the number or quality of information resulted from decision-making based on the idea of entropy information (Wu et al. Citation2011). The entropy method was used to determine the relative importance of each parameter on vulnerability. The weighting process of with entropy method is as follows:
Step 1. Matrix formation: suppose that the target area has been divided into n areas, and m is the number of parameters under evaluation. The data related to the rates are in the form of matrix x. The decision-making matrix can be defined as follows:
where
Step 2. The above matrix is normalized and each normalized element is called rij. The normalization is so that the element of each column is divided into the sum of the column:
Step 3. The entropy of each index, ej is calculated as:
Each parameter in Equation (4) is determined by using the variance pij (entropy). Higher variance (lower entropy) shows that the areas have more difference in each parameter j. The variance of different parameters often varies in different field conditions.
Step 4. The value of the degree of deviation, dj is calculated; this indicates how much useful information the related index (dj) provides for decision maker to make decisions. Given the entropy in each index, the distribution of values in each index j is obtained by:
Step 5. Considering the differences in parameter ratings in the GALDIT framework and the difference of variances in weight, the modified weights of parameters were obtained by Equation (6). A parameter with higher variance might have higher weight, while, if the entropy value is smaller, then the weight of that parameter becomes more (Yu et al. Citation2012). The parameter wj denotes the modified weight, Wj is the main weight of GALDIT, and m is the number of options.
The vulnerability assessment process of the coastal aquifer and the methods used are shown in .
Figure 2. Flowchart of the vulnerability frameworks.
3 Results
3.1 Preparation of the GALDIT framework parameters
The six layers of the GALDIT framework are shown in and described below.
Figure 3. Map of parameters of the GALDIT framework.
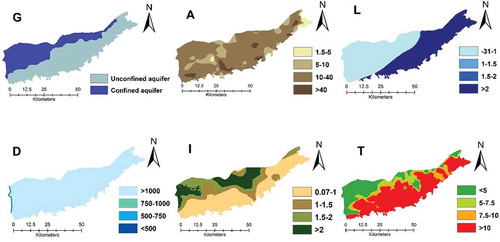
3.1.1 Groundwater occurrence (type of aquifer)
An aquifer may be classified as one of four classes: bounded, leaky confined, unconfined and confined. The performance of groundwater influences the level of seawater intrusion (Chachadi and Lobo Ferreira Citation2001). The map of aquifer type shows that the study area comprises both an unconfined and a confined aquifer. The unconfined aquifer covers the southern lands of the plain, which was rated as 7.5 according to Chachadi’s table (Citation2005). The aquifer in the north and west of the region is a confined aquifer which was rated as 10. The majority of the study area is composed of unconfined aquifers.
3.1.2 Hydraulic conductivity of aquifer
Hydraulic conductivity indicates the ability of the aquifer to transfer water. This parameter is obtained by dividing transmissivity coefficient (T) into the thickness of aquifer (B): k = t/B. The data related to the transmissivity of the aquifer was prepared from pumping tests. Based on , the hydraulic conductivity map was classified into four ranges: <5, 5–10, 10–40 and >40 m/d. The highest rate of hydraulic conductivity is in the class 10–40 m/d.
3.1.3 Height of groundwater level above sea level
This parameter shows the level of groundwater considering the mean sea level in many areas. The height of groundwater level above sea level is one of the most important parameters for assessing vulnerability to seawater intrusion. The parameter of the height of groundwater level was obtained from the data related to the groundwater level of the study region. The value of this parameter varies from – 31.3 to 95.1 m. The lowest groundwater height is in the west of the study area near the sea.
3.1.4 Distance from shoreline
The map of the distance from the shoreline was prepared by using the buffer tool in the ArcGlS environment. The map for this parameter can be divided into four vulnerability classes, ranging from 2.5 (low vulnerability) to 10 (high vulnerability). The area near to the shoreline has the highest vulnerability to seawater intrusion. Therefore, the greater the distance from the shoreline (distance more than 1000 m), the smaller is the vulnerability of the region to seawater intrusion.
3.1.5 Impact of the existing status of seawater intrusion
Data related to the concentrations of chloride and bicarbonate were obtained from different wells. To provide the intrusive seawater map, the Cl/HCO3 ratio was used to determine the seawater intrusion to a coastal aquifer. The lowest level of Cl/HCO3 was observed in the south and east areas of the aquifer, with a rate or 2.5.
3.1.6 Thickness of the aquifer
This parameter shows the thickness of the saturation area of aquifer. Therefore, this parameter is determined from the difference between the groundwater level and the end of aquifer. The aquifer map showed that the western areas of the study aquifers have the lowest thickness, while the highest thickness was observed in the southern and eastern parts of aquifer. The map of this parameter is divided into four vulnerability classes of 2.5, 5, 7.5, and 10.
3.2 GALDIT framework
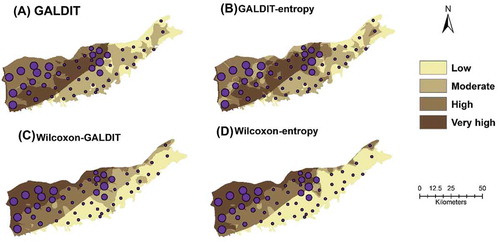
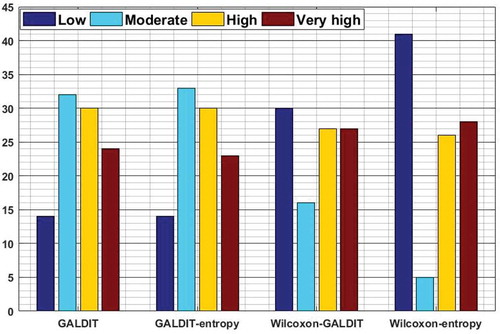
The GALDIT vulnerability index was calculated based on the rates and weights of the common GALDIT framework (Chachadi Citation2005). The final GALDIT vulnerability map was divided into four classes ranging from low to very high vulnerability. The final vulnerability map shows that there is high to very high vulnerability in the western, northwestern and southwestern parts of the study region, while the southern and eastern areas are in the low vulnerability class ()). shows the distribution percentage of the vulnerable areas in the study region and 24% of the area is placed in the very high vulnerability class. The GALDIT index is not able to determine the real and accurate areas of vulnerability; therefore, this framework needs to be modified.
Figure 4. Maps of the vulnerability of the study of coastal aquifer.
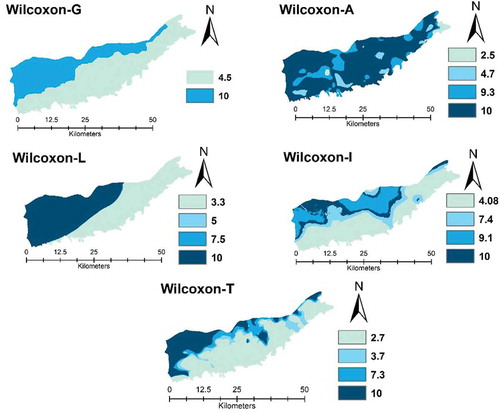
Figure 5. The percentage of areas of vulnerability frameworks.
3.3 TDS sampling
The TDS concentration was selected as the main parameter of the contaminant to modify the GALDIT framework. Two samples were collected from each qualitative well in the Gharasoo-Gorgan Rood coastal aquifer in March 2017 in order to be analysed for TDS concentration. The first sample was used to modify the rates of the GALDIT framework. The second sample was used to validate the models in order to determine the relationship between the indices of vulnerability and contaminant. The TDS concentration was measured using GPS to find the geographical location of each well.
3.4 Modifying the GALDIT rates
In this study, the Wilcoxon non-parametric statistical test and the qualitative data related to the TDS contaminant were used to modify the GALDIT framework. The mean TDS concentration was used to change the rates of the groundwater occurrence (G), aquifer hydraulic conductivity (A), height of groundwater level (L), impact of the existing status of seawater intrusion (I), and thickness of the aquifer (T). The rate for the parameter of distance from shoreline (D) did not change, and the common GALDIT rates were assigned to it, because all TDS data related to the contaminant in the class >1000 m was available, and there was no data available for three ranges of >500, 500–750 and 750–1000. According to the GALDIT framework, the rating ranges of this parameter are 2.5, 5, 7.5 and 10, respectively.
The modified rates obtained from using Wilcoxon non-parametric statistical test are presented in . The higher rate was assigned to the higher mean TDS concentration, and the rates were linearly changed based on this relationship. There is a linear relationship between the rates and TDS concentration so that the higher rate specifies more TDS concentration and vice versa. The aquifer type of the region was divided into two groups – unconfined and confined aquifers – with the main rates of 7.5 and 10, respectively (see Section 3.1.1). The higher modified rate belongs to the highest mean TDS concentration in each class, and other rates are modified according to their linear relationship. Considering the highest mean TDS concentration in the class of 10–40 m/d, the highest modified rate belongs to this class. To modify the rates of the parameter L, the highest mean TDS concentration was assigned to the class >1, and the common GALDIT rates are given to the classes 1–1.5 and 1.5–2. The highest modified rate from the parameter I was assigned to the class 1.5–2.0 with the greatest mean TDS concentration, and other classes were modified according to the linear relationship. For the parameter T, the highest rate is placed in class <5.0 and other classes were modified according to the linear relationship between the mean TDS concentration and rates. Considering the strong correlation between the vulnerability index and TDS concentration, the vulnerability is greater in areas with increased TDS concentration ().
Table 2. Rates of the modified GALDIT framework based on the Wilcoxon test. See for explanation of parameters.
Figure 6. Modified GALDIT layers by Wilcoxon (Wilcoxon-G, Wilcoxon-A, Wilcoxon-L, Wilcoxon-I, Wilcoxon-T).
3.5 Hybrid frameworks
3.5.1 GALDIT-entropy vulnerability framework
The weights of GALDIT framework were modified by using the entropy method (Section 2.5). The entropy values of the GALDIT framework and Wilcoxon model are presented in and , respectively; the modified weights are presented in . The results of the modified weights show that the parameter A has the highest importance in the aquifer vulnerability, and is rated first. The height of groundwater level, L, is in second place and D (distance from the shoreline) is in third place. The highest entropy value was assigned to the parameter of the aquifer type and the lowest entropy value is related to the parameter of the impact of the existing status of seawater intrusion. The GALDIT-entropy map was prepared using the modified weights of the entropy method and their replacement with the common weights of the GALDIT framework:
Table 3. Entropy values of the GALDIT framework.
Table 4. Entropy values of the Wilcoxon model.
Table 5. Weights used in this study.
) shows that the northwestern, southwestern and western parts of the study area have the high and very high vulnerability. The map was then divided into four classes of low, moderate, high, and very high vulnerability, which cover 14%, 33%, 30% and 23% of the area, as shown in .
3.5.2 Wilcoxon-GALDIT vulnerability framework
The rates of GALDIT framework were modified by using Wilcoxon model based on the mean TDS concentration in each class of each parameter. The rates of the parameters of aquifer type, aquifer hydraulic conductivity (A), height of groundwater level (L), impact of the existing status of seawater intrusion (I) and thickness of the aquifer (T) were modified, while the parameter of the distance from shoreline (D) was rated according to Chachadi’s table (Citation2005) due to the lack of data related to TDS in the classes of this parameter. Then, the Wilcoxon-GALDIT framework was obtained fusing the rates of Wilcoxon and common GALDIT.
The final Wilcoxon-GALDIT map was classified into four classes of low, moderate, high and very high vulnerability, which cover 30%, 16%, 27% and 27% of the study area, respectively, as shown in . The map in ) shows that the northwestern and western parts of the aquifer have high vulnerability, while the southern and eastern parts have low vulnerability.
3.5.3 Wilcoxon-entropy vulnerability framework
After modifying the model’s rates with Wilcoxon non-parametric statistical test, new weights were obtained using the entropy method. The Wilcoxon-entropy framework was obtained as:
The results show that the parameter of the height of groundwater level (L) has the highest weight (0.774), and the parameter of the impact of the existing status of seawater intrusion (I) has the lowest weights (0.090) (). The parameter of the thickness of aquifer had the lowest amount of entropy (). The Wilcoxon-entropy map shows that the highest vulnerability covers the western and northwestern areas of the aquifer. shows that 28% of the region has the highest vulnerability, while the lowest vulnerability was observed in the east and south parts of the aquifer which covers 41% of the area ()).
3.6 Framework validation
3.6.1 Pearson correlation coefficient
The Pearson correlation coefficient was used to determine the correlation between the vulnerability indices and TDS concentration. The TDS concentration related to 53 wells was used in this analysis. The correlation coefficient between the index of common GALDIT vulnerability and TDS concentration was calculated as 0.43, which indicates a weak correlation. The correlation coefficients between the vulnerability index of Wilcoxon-GALDIT, GALDIT-entropy and Wilcoxon-entropy with TDS concentration were calculated as 0.66, 0.51 and 0.75, respectively. As a result, the Wilcoxon-entropy framework shows the vulnerability distribution in the study area in a better way, and it was selected as the optimal model ().
Table 6. Correlation between frameworks and TDS concentration.
3.6.2 Correlation index (CI)
One of the ways to verify the results is to use the correlation index (CI) (Fijani et al. Citation2013, Nadiri et al. Citation2018). In this study, the correlation index uses the relationship between different frameworks and TDS data. To calculate the CI, the values of TDS parameter were divided into four classes (very high, high, moderate and low). Then, the difference between the TDS values and vulnerability indices was calculated for each well. A score of CI = 4 is assigned to the performance of a given model when the difference in the categories of TDS concentration and vulnerability value is 0, whereas the scores are 3, 2, or 1 are given when the differences are 1, 2, or 3, respectively. Finally, the resulting values are summed up, and the correlation index is obtained. The CI for GALDIT, GALDIT-entropy, Wilcoxon-GALDIT and Wilcoxon-entropy was calculated as 149, 152, 171 and 176, respectively ().
4 Discussion
One of the factors influencing the vulnerability of aquifers is the phenomenon of groundwater salinity and the seawater intrusion caused by the overexploitation of these resources. The seawater intrusion causes an imbalance in fronts of the freshwater and seawater (Motevalli et al. Citation2018). For this reason, conservation of groundwater resources is of major concern in the field of environmental research considering its importance as a natural resource (Barzegar et al. Citation2018).
In this paper, the GALDIT framework was used to determine areas vulnerable to seawater intrusion in a coastal aquifer. According to Kardan Moghaddam et al. (Citation2017), the GALDIT framework is suitable for assessing the groundwater vulnerability to seawater intrusion in coastal areas. Some research has modified this index according to all hydrogeological features of the study area. For example, Gontara et al. (Citation2016) used single-parameter sensitivity analysis to modify the GALDIT weights.
Modifying the GALDIT framework based on the Wilcoxon non-parametric statistical model provided more accurate results for preparing the vulnerability maps. The proposed modified method is more efficient than the common GALDIT index. Other research on the rating index methods, such as Jafari and Nikoo (Citation2016), confirms the performance of the Wilcoxon test. The combined Wilcoxon test and GA was a suitable model to assess vulnerable areas. Neshat et al. (Citation2014b) also used the Wilcoxon statistical test to modify the rates of DRASTIC parameters showing that the modified DRASTIC index was more accurate. Nadiri et al. (Citation2018) applied the Wilcoxon test and GA to optimize the DRASTIC framework. Also, they developed an artificial intelligence-running multiple framework (AIMF) based on SVM-LS to provide rational results. On the other hand, the weights of parameters are determined based on the relative importance of each parameter among the other parameters and the amounts of variance of parameters (Yu et al. Citation2012). The entropy method is an appropriate assessment scale in different decision-making processes in different cases (Wu et al. Citation2011).
Although many works have studied the modification of the DRASTIC index based on the entropy method, no research has applied the entropy method for modification of the GALDIT framework. The novelty of this study based on the concept of entropy was to modify the GALDIT weights. The optimization of the GALDIT framework was done to manage the coastal aquifers exposed to contamination. The weights of the parameters resulting from the entropy method show the importance of each parameter for vulnerability. This method increases the capability of the GALDIT index. The results from another research showed the fitness of this method in improving the rating index frameworks. Yu et al. (Citation2012) concluded that the entropy and fuzzy methods improved the original DRASTIC model and reduced the uncertainty of the framework. The results of this research show that the combined Wilcoxon statistical test and entropy method improved the GALDIT framework and the amount of correlation for Wilcoxon-entropy with TDS values increased to 0.75. The main drawback of this study is that it has not been validated with other quality parameters. There is still a need for further research to identify the vulnerability of coastal areas. In future research, it is suggested to use evolutionary algorithms such as Particle Swarm Optimization (PSO) and Genetic Algorithm (GA) to optimize this index in order to accurately estimate vulnerable areas.
5 Conclusion
The Gharesoo-Gorgan Rood coastal aquifer is one of the most important coastal aquifers, which has been affected by seawater intrusion due to the overexploitation of groundwater resources. Furthermore, groundwater is the most important source of water supply in this area. The GALDIT framework has been used to assess and identify the vulnerable areas in coastal aquifers, although it was not suitable to assess vulnerability due to the use of constant numerical values in the rating and weighting of the parameters. In this paper, we have proposed new methods of Wilcoxon non-parametric statistical test and entropy weighting method to improve the rating and weighting system of the GALDIT framework. The rates of each parameter in GALDIT were modified using the Wilcoxon non-parametric statistical test and the mean concentration of TDS contaminant in the study area. In addition, the entropy method was used to modify the weights of this framework and determine the importance of each parameter in vulnerability. The novelty of this study is to use new, modified frameworks, such as GALDIT-entropy, Wilcoxon-GALDIT and Wilcoxon-entropy, to improve the evaluation index of the coastal aquifer vulnerability. The correlation coefficients between the results of the combined frameworks and TDS concentration were calculated as 0.51, 0.66 and 0.75, respectively. Furthermore, the correlation index (CI) was used to validate the results, which gave CI values for GALDIT, GALDIT-entropy, Wilcoxon-GALDIT and Wilcoxon-entropy of 149, 152, 171 and 176, respectively. In both validation methods, the Wilcoxon-entropy framework had the highest correlation with the TDS parameter. Therefore, the Wilcoxon-entropy framework was chosen as the most suitable model to assess the vulnerability of the Gharesoo-Gorgan Rood coastal aquifer. The map obtained from the GALDIT modified rates and weights is more consistent with the real conditions of the contamination of the study area. The final results of vulnerability showed that the western and northwestern areas, located along the shoreline, are exposed to seawater intrusion. Combining the statistical and entropy methods mitigates the effects of the pre-determined rating and weighting system of the parameters of GALDIT vulnerability for this coastal aquifer and provides more accurate results. Therefore, this study can contribute to plan and make management decisions to prevent the contamination of groundwater resources in the study area. Also, it is useful for monitoring the quality of groundwater. Generally, it can be concluded that the modified models can be effective in determining the areas affected by seawater intrusion. Finally, further studies are needed to assess the vulnerability of coastal aquifers and examine the effects of contaminants.
Disclosure statement
No potential conflict of interest was reported by the authors.
References
- Abbasi, S., et al., 2013. Aquifer vulnerability assessments using DRASTIC, weights of evidence and the analytic element method. Hydrological Sciences Journal, 58 (1), 186–197. doi:10.1080/02626667.2012.743027
- Afshar, A., et al., 2007. Rule-based fuzzy system for assessing groundwater vulnerability. Journal of Environmental Engineering, 133 (5), 532–540. doi:10.1061/(ASCE)0733-9372(2007)133:5(532)
- Babiker, I.S., et al., 2005. A GIS-based DRASTIC model for assessing aquifer vulnerability in Kakamigahara Heights, Gifu Prefecture, central Japan. Science of the Total Environment, 345 (1–3), 127–140. doi:10.1016/j.scitotenv.2004.11.005
- Bartzas, G., et al., 2015. Assessment of aquifer vulnerability in an agricultural area in Spain using the DRASTIC model. Environmental Forensics, 16 (4), 356–373. doi:10.1080/15275922.2015.1091407
- Barzegar, R., et al., 2018. Mapping groundwater contamination risk of multiple aquifers using multi-model ensemble of machine learning algorithms. Science of the Total Environment, 621, 697–712. doi:10.1016/j.scitotenv.2017.11.185
- Bouderbala, A., et al., 2016. Assessment of groundwater vulnerability and quality in coastal aquifers: a case study (Tipaza, North Algeria). Arabian Journal of Geosciences, 9 (3), 181. doi:10.1007/s12517-015-2151-6
- Boufekane, A., 2013. Assessment of groundwater pollution by nitrates using intrinsic vulnerability methods: A case study of the Nil valley groundwater (Jijel, North-East Algeria). African Journal of Environmental Science and Technology, 7, 949–960. doi:10.5897/AJEST2013.1428
- Brindha, K. and Elango, L., 2015. Cross comparison of five popular groundwater pollution vulnerability index approaches. Journal of Hydrology, 524, 597–613. doi:10.1016/j.jhydrol.2015.03.003
- Busico, G., et al., 2017. A modified SINTACS method for groundwater vulnerability and pollution risk assessment in highly anthropized regions based on NO3− and SO42− concentrations. Science of the Total Environment, 609, 1512–1523. doi:10.1016/j.scitotenv.2017.07.212
- Chachadi, A.G., 2005. Seawater intrusion mapping using modified GALDIT indicator model-case study in Goa. Jalvigyan Sameeksha, 20, 29–45.
- Chachadi, A.G. and Lobo Ferreira, J.P.C., 2001. Sea water intrusion vulnerability mapping of aquifers using the GALDIT method. Proceeding of the Workshop on modeling in hydrogeology. Chennai, India: Anna University, 143–156.
- Fijani, E., et al., 2013. Optimization of DRASTIC method by supervised committee machine artificial intelligence to assess groundwater vulnerability for Maragheh–bonab plain aquifer, Iran. Journal of Hydrology, 503, 89–100. doi:10.1016/j.jhydrol.2013.08.038
- Gontara, M., et al., 2016. Sensitivity analysis for the GALDIT method based on the assessment of vulnerability to pollution in the northern Sfax coastal aquifer, Tunisia. Arabian Journal of Geosciences, 9 (5), 416. doi:10.1007/s12517-016-2437-3
- Gorgij, A.D. and Moghaddam, A.A., 2016. Vulnerability assessment of saltwater intrusion using simplified GAPDIT method: a case study of Azarshahr Plain Aquifer, East Azerbaijan, Iran. Arabian Journal of Geosciences, 9 (2), 106. doi:10.1007/s12517-015-2200-1
- Gray, R.M., 2013. Entropy and Information Theory. New York: Springer-Verlag.
- Hasiniaina, F., Zhou, J., and Guoyi, L., 2010. Regional assessment of groundwater vulnerability in Tamtsag basin, Mongolia using drastic model. Journal of American Science, 6 (11), 65–78.
- Iqbal, J., et al., 2015. Development of GIS-based fuzzy pattern recognition model (modified DRASTIC model) for groundwater vulnerability to pollution assessment. International Journal of Environmental Science and Technology, 12 (10), 3161–3174. doi:10.1007/s13762-014-0693-x
- Jafari, F., et al., 2016. Groundwater risk mapping prediction using mathematical modeling and the Monte Carlo technique. Environmental Earth Sciences, 75 (6), 491. doi:10.1007/s12665-016-5335-9
- Jafari, S.M. and Nikoo, M.R., 2016. Groundwater risk assessment based on optimization framework using DRASTIC method. Arabian Journal of Geosciences, 9 (20), 742. doi:10.1007/s12517-016-2756-4
- Kang, J., et al., 2017. Groundwater vulnerability assessment based on modified DRASTIC model: a case study in Changli County, China. Geocarto International, 32 (7), 749–758. doi:10.1080/10106049.2016.1167969
- Kardan Moghaddam, H., Jafari, F., and Javadi, S., 2017. Vulnerability evaluation of a coastal aquifer via GALDIT model and comparison with DRASTIC index using quality parameters. Hydrological Sciences Journal, 62 (1), 137–146.
- Kazakis, N., et al., 2018. A fuzzy multicriteria categorization of the GALDIT method to assess seawater intrusion vulnerability of coastal aquifers. Science of the Total Environment, 621, 524–534. doi:10.1016/j.scitotenv.2017.11.235
- Kazakis, N. and Voudouris, K.S., 2015. Groundwater vulnerability and pollution risk assessment of porous aquifers to nitrate: modifying the DRASTIC method using quantitative parameters. Journal of Hydrology, 525, 13–25. doi:10.1016/j.jhydrol.2015.03.035
- Kumar, S., et al., 2013. Groundwater vulnerability assessment using SINTACS model. Geomatics, Natural Hazards and Risk, 4 (4), 339–354. doi:10.1080/19475705.2012.732119
- Kura, N.U., et al., 2015. Assessment of groundwater vulnerability to anthropogenic pollution and seawater intrusion in a small tropical island using index-based methods. Environmental Science and Pollution Research, 22 (2), 1512–1533. doi:10.1007/s11356-014-3444-0
- Lappas, I., et al., 2016. Groundwater vulnerability assessment to seawater intrusion through GIS-based GALDIT method. Case study: atlanti coastal aquifer, Central Greece. Bulletin of the Geological Society of Greece, 50 (2), 798–807. doi:10.12681/bgsg.11786
- Li, G.L. and Fu, Q., 2007. Grey relational analysis model based on weighted entropy and its application. International Conference on Wireless Communications, Networking and Mobile Computing, 5500–5503.
- Mahrez, B., et al., 2018. GIS-based GALDIT method for vulnerability assessment to seawater intrusion of the Quaternary coastal Collo aquifer (NE-Algeria). Arabian Journal of Geosciences, 11 (4), 71.
- Majandang, J. and Sarapirome, S., 2013. Groundwater vulnerability assessment and sensitivity analysis in Nong Rua, Khon Kaen, Thailand, using a GIS-based SINTACS model. Environmental Earth Sciences, 68 (7), 2025–2039.
- Motevalli, A., Moradi, H.R., and Javadi, S., 2018. A Comprehensive evaluation of groundwater vulnerability to saltwater up-coning and sea water intrusion in a coastal aquifer (case study: ghaemshahr-juybar aquifer). Journal of Hydrology, 557, 753–773.
- Nadiri, A.A., et al., 2017a. Groundwater vulnerability indices conditioned by supervised intelligence committee machine (SICM). Science of the Total Environment, 574, 691–706.
- Nadiri, A.A., et al., 2017b. Assessment of groundwater vulnerability using supervised committee to combine fuzzy logic models. Environmental Science and Pollution Research, 24 (9), 8562–8577. doi:10.1007/s11356-017-8489-4
- Nadiri, A.A., et al., 2017c. Mapping vulnerability of multiple aquifers using multiple models and fuzzy logic to objectively derive model structures. Science of the Total Environment, 593, 75–90. doi:10.1016/j.scitotenv.2017.03.109
- Nadiri, A.A., Gharekhani, M., and Khatibi, R., 2018. Mapping aquifer vulnerability indices using artificial intelligence-running multiple frameworks (AIMF) with supervised and unsupervised learning. Water Resources Management, 32 (9), 3023–3040. doi:10.1007/s11269-018-1971-z
- Neshat, A., et al., 2014a. Estimating groundwater vulnerability to pollution using a modified DRASTIC model in the Kerman agricultural area, Iran. Environmental Earth Sciences, 71 (7), 3119–3131. doi:10.1007/s12665-013-2690-7
- Neshat, A. and Pradhan, B., 2015a. An integrated DRASTIC model using frequency ratio and two new hybrid methods for groundwater vulnerability assessment. Natural Hazards., 76, 543–563. doi:10.1007/s11069-014-1503-y
- Neshat, A. and Pradhan, B., 2015b. Risk assessment of groundwater pollution with a new methodological framework: application of Dempster–shafer theory and GIS. Natural Hazards, 78 (3), 1565–1585. doi:10.1007/s11069-015-1788-5
- Neshat, A. and Pradhan, B., 2017. Evaluation of groundwater vulnerability to pollution using DRASTIC framework and GIS. Arabian Journal of Geosciences, 10 (22), 501. doi:10.1007/s12517-017-3292-6
- Neshat, A., Pradhan, B., and Dadras, M., 2014c. Groundwater vulnerability assessment using an improved DRASTIC method in GIS. Resources, Conservation and Recycling, 86, 74–86. doi:10.1016/j.resconrec.2014.02.008
- Neshat, A., Pradhan, B., and Javadi, S., 2015. Risk assessment of groundwater pollution using Monte Carlo approach in an agricultural region: an example from Kerman Plain, Iran. Computers, Environment and Urban Systems, 50:, 66–73. doi:10.1016/j.compenvurbsys.2014.11.004
- Neshat, A., Pradhan, B., and Shafri, H.Z.M., 2014b. An integrated GIS based statistical model to compute groundwater vulnerability index for decision maker in agricultural area. Journal of the Indian Society of Remote Sensing, 42 (4), 777–788. doi:10.1007/s12524-014-0376-6
- Recinos, N., et al., 2015. Application of GALDIT index to assess the intrinsic vulnerability to seawater intrusion of coastal granular aquifers. Environmental Earth Sciences, 73 (3), 1017–1032. doi:10.1007/s12665-014-3452-x
- Sahoo, M., et al., 2016. Effectiveness evaluation of objective and subjective weighting methods for aquifer vulnerability assessment in urban context. Journal of Hydrology, 541, 1303–1315. doi:10.1016/j.jhydrol.2016.08.035
- Saidi, S., Bouri, S., and Dhia, H.B., 2013. Groundwater management based on GIS techniques, chemical indices and vulnerability to seawater intrusion modelling: application to the Mahdia–ksour Essaf aquifer, Tunisia. Environmental Earth Sciences, 70 (4), 1551–1568. doi:10.1007/s12665-013-2241-2
- Shannon, C.E., 1948. A mathematical theory of communication. Bell System Technical Journal, 27 (3), 379–423. doi:10.1002/bltj.1948.27.issue-3
- Trabelsi, N., et al., 2016. Aquifer vulnerability and seawater intrusion risk using GALDIT, GQI SWI and GIS: case of a coastal aquifer in Tunisia. Environmental Earth Sciences, 75 (8), 669. doi:10.1007/s12665-016-5459-y
- Werner, A.D. and Simmons, C.T., 2009. Impact of sea‐level rise on sea water intrusion in coastal aquifers. Groundwater, 47 (2), 197–204. doi:10.1111/gwat.2009.47.issue-2
- Wilcoxon, F., 1945. Individual comparisons by ranking methods. Biometrics Bulletin, 1, 80–83. doi:10.2307/3001968
- Wu, J., et al., 2011. Determination of weights for ultimate cross efficiency using Shannon entropy. Expert Systems with Applications, 38 (5), 5162–5165. doi:10.1016/j.eswa.2010.10.046
- Yin, L., et al., 2013. A GIS-based DRASTIC model for assessing groundwater vulnerability in the Ordos Plateau, China. Environmental Earth Sciences, 69 (1), 171–185. doi:10.1007/s12665-012-1945-z
- Yu, C., et al., 2012. A field demonstration of the entropy-weighted fuzzy DRASTIC method for groundwater vulnerability assessment. Hydrological Sciences Journal, 57 (7), 1420–1432. doi:10.1080/02626667.2012.715746