
 ?Mathematical formulae have been encoded as MathML and are displayed in this HTML version using MathJax in order to improve their display. Uncheck the box to turn MathJax off. This feature requires Javascript. Click on a formula to zoom.
ABSTRACT
Taking a representative catchment of the Yangtze River Delta region as the study area, this research evaluated sub-daily rainstorm variability and its potential effects on flood processes based on an integrated approach of the HEC-HMS model and design storm hyetographs. The results show that the intensities of rainfall on sub-daily scale are getting more extreme. The annual maximum 1-, 2- and 3-hour rainstorms followed significant upward trends with increases of 0.32, 0.43 and 0.44 mm per year, respectively, while the annual maximum 6-, 12- and 24-h events had non-significant rising trends. The detected significant trends in short-duration rainstorms were then used to redesign storm hyetographs to drive the HEC-HMS model, the results show that these changes in short-duration rainstorm characteristics would increase the flood peak discharge and flood volume. These findings indicate that regional flood control capabilities must be improved to manage the adverse impacts of rainfall variation under changing environments.
Editor A. Castellarin Guest Editor Y. Jia
1 Introduction
The episodic nature of flood events can often be attributed to the variable nature of rainfall, which is one of the principal drivers of floods. Changes in frequency and intensity of heavy precipitation events have been observed recently at regional (Pachauri, Citation2014, Hu et al. Citation2017) and global scales (Beniston Citation2009, Giorgi et al. Citation2011, Chou et al. Citation2013). The magnitude–frequency relationship of extreme events has been influenced (Emam et al. Citation2016, Meißl et al. Citation2017) and resulted in increases in flash-flood and debris-flow hazards (Beniston et al. Citation2011, Borga et al. Citation2014). These flood hazards have seriously threatened human life and property all over the world and resulted in the death of 175 000 people globally in the period 1975–2001 (Jonkman Citation2005). In the USA, Ashley and Ashley (Citation2008) reported that flash floods caused 4586 fatalities between 1959 and 2005, while in Europe, flash floods cause an average of approximately 49 casualties per year (Barredo Citation2007). In the Taihu Basin, located in the central part of the Yangtze River Delta, China, flood disasters caused 237 deaths between 2013 and 2016 (Taihu Basin Authority of Ministry of Water Resources Citation2013–2016). Thus, gaining a better understanding of rainstorm variability, especially on a sub-daily scale, and its potential effects on flood processes is critically important for flood disaster prevention and reduction (Hajani et al. Citation2017).
Hydrological models are practical tools for the quantitative evaluation of flood responses and can be categorized as lumped, semi-distributed and distributed. Progress in geographic information system (GIS) and remote sensing techniques has greatly facilitated the development of hydrological models in recent years (Chen et al. Citation2016). Several popular models, especially physically-based models, such as the Soil and Water Assessment Tool (SWAT; Arnold et al. Citation1998), the Hydrological Engineering Center-Hydrological Modeling System (HEC-HMS; HEC Citation1998), the Variable Infiltration Capacity (VIC) model (Liang et al. Citation1994), the Water and Energy Transfer Process (WEP) model (Jia et al. Citation2001), and the Liuxihe model (Chen et al. Citation2010), have been widely used to quantify flood responses in recent years. Although the HEC-HMS model is a semi-distributed model, this model has a strong physical basis and has been successfully used to simulate hydrological processes in various watersheds (Wang et al. Citation2003, Olang and Fürst Citation2011). In the HEC-HMS model, the whole basin is divided into sub-basins based on a digital elevation model (DEM), and the heterogeneity of underlying surface characteristics, such as soil, topography and land use, can be considered in the model. The HEC-HMS model is suitable for simulating hydrological processes in complex watersheds and is thus selected to simulate rainstorm runoff processes in this paper.
Assessment of the hydrological impacts of rainfall changes mainly combines a hydrological model and scenarios provided by global or regional climate models (Cunderlik and Simonovic Citation2005, Yu et al. Citation2013, Marchane et al. Citation2017). A statistical method (Wilby et al. Citation2002, Reshmidevi et al. Citation2018), or dynamical downscaling (Bergström et al. Citation2006, Boé et al. Citation2007) approach should be used when applying the climate scenarios due to the relatively coarse spatial resolution of general circulation models (GCMs). Many studies have assessed the impacts of rainfall variability on hydrological extremes based on different climate scenarios generated by downscaling methods (e.g. Sillmann et al. Citation2013, Zhang et al. Citation2016). However, these studies often perform their assessments on the daily scale and might neglect the influence of sub-daily rainstorm variation.
In the Yangtze River Delta, one of the most developed regions of China, previous studies have indicated that rainfall characteristics, such as precipitation intensity, have changed during the past few decades (Yang et al. Citation2014, Han et al. Citation2015, Hu et al. Citation2016, Wang et al. Citation2016) and have potentially increased flood disasters in the region. However, these studies have also not assessed the impacts of sub-daily rainfall variation on floods, and further studies about flood responses to rainstorm variability are needed.
Design rainfall is the most valuable input for hydrological and hydraulic calculations (Huff Citation1967, Guo and Hargadin Citation2009, Awadallah and Younan Citation2012). In this study, designed 24-h hyetographs were changed according to the tendency of observed sub-daily rainstorms, thus enabling them to reflect the variations in short-duration rainfall events under changing environments. Due to the uncertainty introduced by the design rainfall distribution, multi-storm distribution curves should be applied to generate the 24-h design storm hyetographs and estimate the average hydrological responses.
The main objectives of this study are to evaluate the variations in rainstorm characteristics under changing environments and assess the impacts of these variations on flood processes at sub-daily scale. To achieve the objectives, the variations in short-duration rainstorms were detected first. Then, the rainstorm patterns for 24-h durations were redesigned based on the detected tendencies of short-duration rainstorms. Finally, the impacts of sub-daily rainstorm variability on flood processes were assessed using the HEC-HMS model and the redesigned rainfall hyetograph scenarios.
2 Study area and data source
2.1 Study area
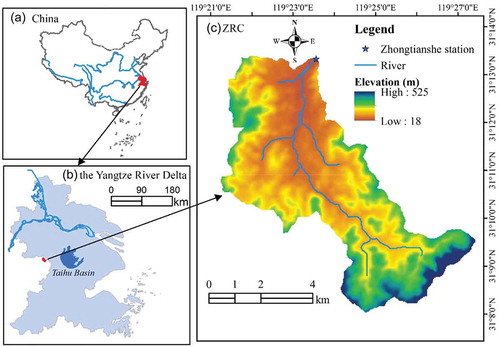
The Zhongtianshe River Catchment (ZRC), which covers an area of 40.15 km2, lies between latitudes 31°08′0″ and 31°13′30″N and longitudes 119°21′0″ and 119°27′18″E in the western Yangtze River Delta region, China (). The catchment is in a hilly area with an elevation range of 18–525 m a.s.l. A subtropical humid monsoon climate is dominant, with a mean annual precipitation of 1293 mm, and floods occur in the rainy season (May–September) due to plum rains and typhoons. The land-use change in the ZRC has little variability and few anthropogenic interventions, and the main land-use type is forest. Due to the intertwined influences of rainfall variation and changes in underlying surface characteristics, a basin in which human activities are limited is an ideal area for assessing the impacts of rainfall variations on floods. Hence, the ZRC was selected as a representative region for exploring the impacts of changes in sub-daily rainstorm characteristics on flood processes, in which the influences of human activities could be disregarded.
Figure 1. Location of the study area.
2.2 Datasets
The datasets used in this study mainly include spatial data (i.e. topography, soil map and land use) and hydrometeorological data, which are used to drive the hydrological model. The topographical data were derived from the ASTER GDEM (Advanced Spaceborne Thermal Emission and Reflection Radiomenter global digital elevation model), with a resolution of 30 m, and the soil data were obtained from the Harmonized World Soil Database. The land-use data were acquired by digitizing a Google Map of 16 November 2015. These spatial data were transformed into 30-m resolution raster datasets. The hydrometeorological data from the Zhongtianshe station included long-term daily precipitation and annual short-duration rainfall between 1978 and 2016 and rainfall–streamflow data between 2015 and 2016, which were provided by the Hydrological Bureau of Changzhou. Six rainfall events with 1-h interval measured during the flood season were used to calibrate and validate the hydrological model. The annual maximum rainstorms (1978–2016) of 1-, 2-, 3-, 6-, 12- and 24-h durations, denoted MAX1H, MAX2H, MAX3H, MAX6H, MAX12H and MAX24H, respectively, were used to detect the variations in sub-daily rainstorm characteristics.
3 Methods
In this study, redesigned 24-h hyetograph scenarios were run in the HEC-HMS model to understand the possible effect of sub-daily rainstorm variability on flood processes. Firstly, the hydrological model developed here is based on spatial and hydrometeorological data from the study area. The Mann-Kendall test (Mann Citation1945, Kendall Citation1955) was used for trend analysis for the short-duration rainstorms, and the Pearson type III distribution – widely used in China – was selected to fit the annual maximum sequence of 24-h rainfall for frequency analysis. Then, the detected significant trends were used to redesign the 24-h hyetographs under different rainfall return periods (5-, 10-, 25-, 50- and 100-year return). Finally, the flood responses provided with these hyetographs were detected. The general metrological framework is shown in .
Figure 2. Methodological framework of the study.
3.1 HEC-HMS model
The HEC-HMS model, developed by the Hydrologic Engineering Center of the US Army Corps of Engineers (HEC), has been successfully used for many hydrological problems, such as water supply, flood hydrology and small urban or natural watershed runoff simulation (e.g. Cunderlik and Simonovic Citation2005, Yilmaz and Imteaz Citation2011, Hajian et al. Citation2016). The model includes four different components (a basin model, a meteorological model, control specifications and time series data managers). The basin model was built from a DEM, with the support of HEC-GeoHMS extension for ArcGIS 10.3 software, and five sub-catchments of the ZRC were delineated from the ASTER GDEM.
In this study, the following methods were used to represent the different hydrological processes: the initial and constant method was used for loss estimation, the Snyder unit hydrograph method for transformation, the recession method for baseflow calculation and the Muskingum method for channel routing (Feldman Citation2000). Ten main parameters must be estimated for the model to simulate the flood processes in the ZRC. These parameters include the initial loss, constant rate and impervious rate for loss estimation, the standard lag and peaking coefficient for the Snyder unit hydrograph method, the initial discharge, recession constant and peak ratio for the recession method, and the K and X values for the Muskingum method. Some of these parameters could be obtained from the characteristics of the watershed. For instance, the impervious rate was estimated using the land-cover data. The antecedent soil moisture contents of the hydrological events are almost the same because the events were all flood season events. Hence, initial loss and initial discharge were estimated based on the average values of the calibrated events. Other parameters, such as the constant rate, standard lag and peaking coefficient, were estimated during the automatic calibration process implemented in the HEC-HMS model (Saghafian et al. Citation2008).
Several goodness-of-fit metrics were selected to evaluate model performance with a focus on extreme values (peak flows), runoff volumes and hydrograph shape (peak time) (Davtalab et al. Citation2017). These factors include relative error of peak discharge and volume, deviation of peak time and the Nash-Sutcliffe (Nash and Sutcliffe Citation1970) efficiency criterion (NS), defined as:
where is the hourly ith observed streamflow,
is the simulated streamflow, and
is the average value of the observed streamflow. The NS ranges from –∞ to 1 and indicates how well a model explains the variance in the observed flow; a value closer to 1 indicates better model performance (Chang et al. Citation2017).
3.2 Mann-Kendall test for trends
The Mann-Kendall (M-K) test (Mann Citation1945, Kendall Citation1955) has been widely applied to detect a trend in hydrometeorological time series (Han et al. Citation2015, Wang et al. Citation2016, Hu et al. Citation2017). The M-K test is a nonparametric method and the slope of the series to be detected can be computed using the Theil-Sen method:
where and
are the observed values in years j and i (
), respectively, M is the median of the calculated series and S is the slope. A positive value of S indicates an upward trend, while a negative value indicates a downward trend. Significance levels of 5% and 10% were used in the implication of the test.
3.3 Designing rainfall scenarios and frequency analysis
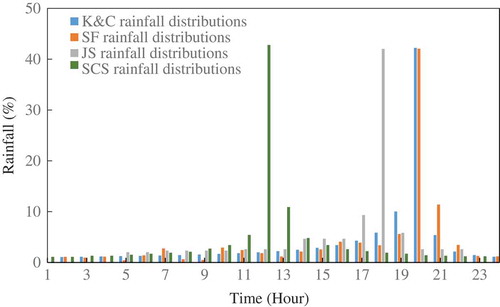
In this study, four different synthetic hyetographs, i.e. Keifer and Chu (K&C), same-frequency (SF), storm and flood atlas of Jiangsu (JS) and Soil Conservation Service (SCS) Type II rainfall distributions, were applied to generate the 24-h design storm hyetographs (as shown in ). The K&C rainfall distribution was designed according to the Chicago hyetograph method based on historical short-duration data (Keifer and Chu Citation1957). The SF rainfall distribution was calculated by amplifying the representative observed rainfall process through the same-frequency or same-ratio method, which is the primary method used in China (Yang et al. Citation2013). The JS rainfall distribution was derived from the storm and flood atlas of Jiangsu Province, China. The K&C, SF and JS rainfall distributions for 24-h duration were provided by Changzhou, Jiangsu Province Hydrology and Water Resources Investigation Bureau. The SCS Type II storm distribution, suggested by the US Department of Agriculture (USDA) Soil Conservation Service (now the Natural Resources Conservation Service) for use in most of the USA, is the most critical design storm, as it has the steepest peak (USDA Citation1973).
Figure 3. Four design rainstorm patterns for 24 × 1 h.
To analyse the potential impacts of the variations in rainstorm characteristics on flood processes, the 24-h design hyetographs under different rainfall return periods (5, 10, 25, 50 and 100 years) were modified according to the variation trends of the MAX1H, MAX2H, MAX3H, MAX6H, MAX12H and MAX24H between 1978 and 2016. The procedure for different rainstorm return periods involves the following steps:
The rainfall hyetograph under a certain return period for a 24-h duration was calculated based on the design storm pattern as follows:
where(3)
(2) The variation trends of rainstorm characteristics were computed based on the M-K test for MAX1H, MAX2H, MAX3H, MAX6H, and MAX12H between 1978 and 2016.
(3) The maximum continuous for m-hour rainfall was changed according to the detected significant trends as follows:
where m is the duration with significant trends of MAX1H, MAX2H, MAX3H, MAX6H, and MAX12H,
(4) Finally, to exclude the influence of change in total rainfall, a number was subtracted from the rainfall not in maximum continuous rainfall in m hours to keep the total rainfall constant under certain return periods. This was applied for rainstorm structure, but not for total 24-h rainfall. Therefore, the differences in flood responses of HEC-HMS results are just caused by the variations of short-duration rainstorms.
4 Results and discussion
4.1 Model performance
In this study, six measured storm flood events were collected during the flood season. Of these events, three (events no. 20150515, 20150615 and 20160620) were used for model calibration, and the other three (20160627, 20160701 and 20160914) were used for validation purposes. Visual comparison of the observed and simulated flow for the six test events is shown in .
Figure 4. Observed vs simulated hydrographs by the HEC-HMS model for the six test events: (a) 20150515, (b) 20150615, (c) 20160620 – calibration and (d) 20160627, (e) 20160701 and (f) 20160914 – validation.
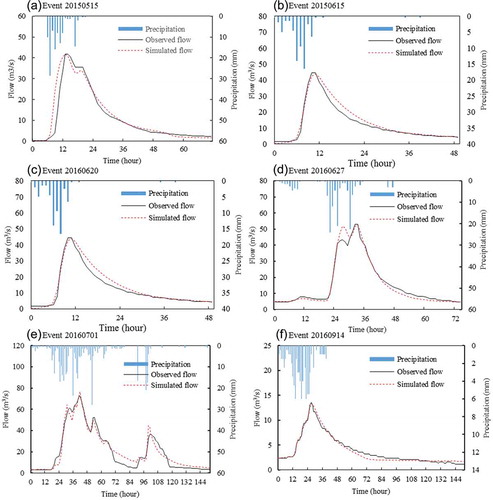
As shown in , the HEC-HMS model results are in accordance with the observed flow, despite a few differences in the double-humped flood events, such as event 20160627. The goodness-of-fit values of the HEC-HMS model simulations for the calibration and validation periods are summarized in . All NS values are greater than 0.9, suggesting that there is satisfactory fit between the simulated and observed flows in both calibration and validation periods (Moriasi et al. Citation2007). The absolute values of relative error (RE, ) for peak discharge and volume range from 0 to 10%. The peak time deviations are all less than one hour in the calibration and validation periods, denoting that the HEC-HMS model could capture the peak time of these flood events in the ZRC.
Table 1. Results of evaluation of HEC-HMS model for six simulated flood events of the ZRC. RE: relative error; NS: Nash-Sutcliffe efficiency criterion.
According to the hydrological model evaluation criteria, the performance of the HEC-HMS model is satisfactory, and the model is capable of simulating flood processes in the ZRC. Next, we performed different model runs with the redesigned 24-h hyetographs under different rainfall return periods (5, 10, 25, 50 and 100 years) based on the well-calibrated HEC-HMS model.
4.2 Changes in rainstorm characteristics
The time trend of the number of days with precipitation greater than 50 mm was examined using the M-K test. As shown in , the number of annual rainstorm events had a statistically significant upward trend (p < 0.05) over time, which suggests that the rainstorm frequency was increasing in the ZRC during the study period.
Figure 5. Time series of annual rainstorm event counts for the ZRC.
The tendencies of MAX1H–MAX24H were then detected using the M-K method ( and ). All annual maximum rainfall series suggest the possibility of an upward time trend: MAX1H and MAX2H have a significant rising trends at the 95% confidence level, MAX3H shows a significant rising trend at 90% confidence level, while MAX6H, MAX12H and MAX24H show non-significant rising trends (). Thus the intensity of short-duration rainfall events has increased in the past several decades (1978–2016).
Table 2. Trends in annual maximum rainfall series for different durations (1 to 24 h) in the ZRC for the period 1978–2016 (n = 39).
Figure 6. Time series of annual maximum rainfall of 1-, 2-, 3-, 6-, 12- and 24-h duration (MAX1H–MAX24H) in the ZRC.
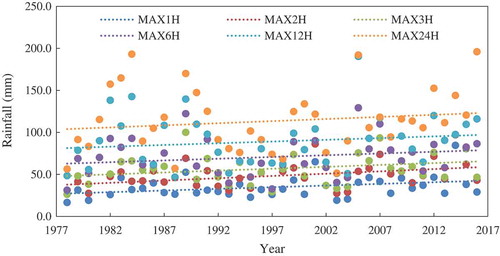
Previous studies reported that the precipitation intensity showed an upward trend on a daily scale in the Yangtze River Delta region (Han et al. Citation2015, Wang et al. Citation2016). However, the results presented herein show that both the frequency and intensity of extreme rainstorms follow an upward trend, not only on a daily scale but also on a sub-daily scale, especially on for 1-, 2- and 3-h events. Extreme rainfall changes are usually evaluated based on annual maximum daily changes in previous studies, and sub-daily variations in rainstorms may have been overlooked, while these variations may severely influence flood processes.
4.3 Effects of rainstorm variations on flood processes
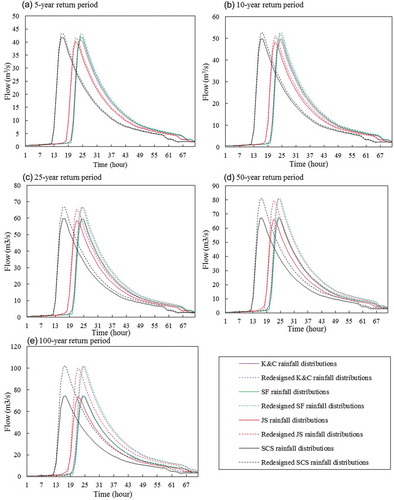
The hyetographs derived from K&C, SF, JS and SCS rainfall distributions were redesigned based on detected significant variation in short-duration rainstorms (i.e. MAX1H, MAX2H and MAX3H), resulting in eight of the original and redesigned rainfall scenarios under different return periods (5, 10, 25, 50 and 100 years). These rainfall scenarios were then used to drive the HEC-HMS model. The flood responses to different rainfall scenarios are shown in . The results indicate that peak discharge increased in all redesigned scenarios for different storm distributions, but with no obvious change in flood peak time.
Figure 7. Flood hydrographs simulated for eight rainfall scenarios with rainfall return periods of: (a) 5 years, (b) 10 years, (c) 25 years, (d) 50 years and (e) 100 years.
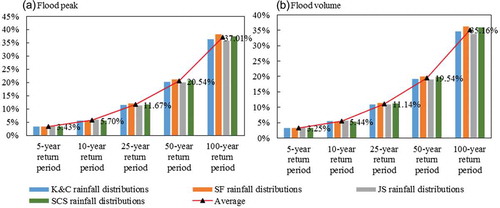
The change in flood peak discharge and volume and the average hydrological responses under four different storm distribution scenarios with different return periods are shown in . The results illustrate that, on average, the changes in rainfall characteristics increased the flood peak discharge by 3.43%, 5.7%, 11.67%, 20.54% and 37.01% for the rainfall return periods of 5, 10, 25, 50 and 100 years, respectively, and the flood volume increased by 3.25%, 5.44%, 11.14%, 19.54% and 35.16%, respectively. Thus, the rainstorm variation changed the magnitude–frequency relationship between extreme rainfall and flooding events.
Figure 8. The impacts of rainstorm variation on (a) flood peak and (b) flood volume for different rainfall return periods.
These results reveal that changes in rainstorm characteristics may influence the flood characteristics, especially flood peak and flood volume, which were highly consistent with each other under different rainstorm time patterns ( and ). Extreme rainfall is the main trigger factor for extreme flood events (Gaume et al. Citation2009, Borga et al. Citation2014); thus, variations in extreme rainstorms would result in changes in flood processes. Similar findings were reported by Roy et al. (Citation2001), who concluded that potentially very serious increases in the volume of runoff, maximum discharge and water level might occur under future climate scenarios based on a hydrological model with the inputs of 24-h rainfall hyetographs. In addition, Fang and Pomeroy (Citation2016) also found that flood peak discharge increased as precipitation increased on an hourly scale in a basin in Kananaskis Valley, Canada. These studies confirm that changes in precipitation variation will have an adverse effect on flood processes. As higher flood peaks and more frequent heavy rainstorms increase the flood risk, flood control standards need to be upgraded and flood control capabilities for flood mitigation under changing environments must be improved.
4.4 Uncertainties and limitations
Uncertainties in hydrological modelling mainly come from hydrological models, observed data and input data (Minville et al. Citation2008, Wang et al. Citation2011, Marchane et al. Citation2017). Although the HEC-HMS model performed satisfactorily ( and ), we used only a single outlet gauge for calibration and validation due to the limitations in obtaining observed data. Thus, accurate simulation in the spatial variation of sub-basin streamflow is not ensured (Musau et al. Citation2015, Zhang et al. Citation2016). Additionally, the parameters in the HEC-HMS model are sensitive to the chosen calibration events for the different conditions, such as antecedent soil moisture and rainfall patterns (Meißl et al. Citation2017). Hence, the events used to calibrate and validate the models were selected from the flood season (May–September) to avoid the influence of different antecedent conditions.
The observed flood events at a 1-h time interval used in this study were provided by the local Hydrological Bureau; however, the time of concentration in the ZRC may be shorter than one hour. Hence, the HEC-HMS model, driven by 1-h interval data, might not fully capture the flood peak. Therefore, data of shorter time resolution, such as weather radar observations, will be very helpful to monitor flash flood responses to rainfall events (Borga et al. Citation2008).
In the estimation of the new design rainfall we excluded the influence of total 24-h rainfall, by keeping constant the total rainfall when redesigning the short-duration rainfall intensities according to the detected trends over time. However, as observed by Han et al. (Citation2015), the precipitation intensity on a daily scale has also increased during the past several decades in the region. Therefore, the flood peak discharge and flood volume generated by rainstorms may be higher and, thus, the flood risk might be more serious in the Yangtze River Delta region under the changing environment.
In addition to the influence of rainstorm variability, watershed size also plays an important role in the regional flood processes (Creutin et al. Citation2013). The delay between rainstorms and floods is linked to catchment size. Thus, the flood responses to rainstorm variability in basins of different sizes may vary. Moreover, the water cycle also affects the relationship between rainstorms and flood events on a large scale. For instance, some cyclical factors exist in rainstorms events. Wang et al. (Citation2016) found that dryness/wetness had 4–8-year dominant cycles in the Yangtze River Delta region from 1960 to 2012. That is, in 1983, 1999 and 2016, floods occurred relatively more frequently in the Yangtze River Delta region. Therefore, the effects of rainstorm variability on floods are complicated to identify and further analysis is required. Moreover, other factors, such as land-use/cover change (LUCC), also affect the processes of flash floods (Saghafian et al. Citation2008, Zope et al. Citation2017). Since human activities have had a limited effect on land use and land cover in the mountainous catchment studied here, LUCC was not considered in this work. However, farmland reclamation (forest transformed into dry land) has been observed in the northwestern area of the ZRC in recent years. Thus, LUCC may have a greater effect on floods and may further increase the regional flood risk in the future. Therefore, further studies on the effects of changes in rainfall combined with land-use and land-cover changes are also needed.
5 Conclusions
In this study, the Zhongtianshe River Catchment (ZRC) was selected as a representative catchment of the Yangtze River Delta region, which is very vulnerable to floods. Changes in the number of annual rainstorms and annual maximum short-duration rainfall magnitudes (i.e. MAX1H, MAX2H, MAX3H, MAX6H, MAX12H and MAX24H) were detected using the Mann-Kendall test, and its impacts on floods were evaluated using a calibrated hydrological model, the HEC-HMS.
The number of annual rainstorms showed a statistically significant upward trend over time. The MAX1H, MAX2H and MAX3H all followed significant upward trends (increases of 0.32, 0.43 and 0.44 mm/year, respectively). In addition, the results of hydrological modelling revealed that these changes in precipitation would increase flood peak and flood volume. The ensemble mean of four different storm distributions showed that changes in sub-daily rainstorms increased the flood peak by 3.43%, 5.7%, 11.67%, 20.54% and 37.01% for the rainfall return periods of 5, 10, 25, 50 and 100 years, respectively, and increased the flood volume by 3.25%, 5.44%, 11.14%, 19.54% and 35.16% for the same rainfall return periods.
The findings of this study indicate that rainfall changes on a sub-daily scale will adversely affect the population and assets under a changing environment. Flood control standards must be upgraded and the flood control capabilities in the Yangtze River Delta region need to be improved. Moreover, further analysis is needed on the combined effects of changes in rainfall and land use in areas with substantial human activities. These results will help in understanding the impacts of changes in rainfall characteristics on flood processes and are useful for flood mitigation and disaster planning.
Acknowledgements
The authors thank the Changzhou branch of Jiangsu Province Hydrology and Water Resources Investigation Bureau for supplying the data used in this study.
Disclosure statement
No potential conflict of interest was reported by the authors.
Additional information
Funding
References
- Arnold, J.G., et al., 1998. Large area hydrologic modeling and assessment Part I: model development. Journal of the American Water Resources Association, 34 (1), 73–89. doi:10.1111/jawr.1998.34.issue-1.
- Ashley, S.T. and Ashley, W.S., 2008. Flood fatalities in the United States. Journal of Applied Meteorology and Climatology, 47 (3), 805–818. doi:10.1175/2007JAMC1611.1.
- Awadallah, A.G. and Younan, N.S., 2012. Conservative design rainfall distribution for application in arid regions with sparse data. Journal of Arid Environments, 79, 66–75. doi:10.1016/j.jaridenv.2011.11.032
- Barredo, J.I., 2007. Major flood disasters in Europe: 1950–2005. Natural Hazards, 42 (1), 125–148. doi:10.1007/s11069-006-9065-2.
- Beniston, M., 2009. Trends in joint quantiles of temperature and precipitation in Europe since 1901 and projected for 2100. Geophysical Research Letters, 36 (7), 374. doi:10.1029/2008GL037119.
- Beniston, M., Stoffel, M., and Hill, M., 2011. Impacts of climatic change on water and natural hazards in the Alps: can current water governance cope with future challenges? Examples from the European “ACQWA” project. Environmental Science & Policy, 14 (7), 734–743. doi:10.1016/j.envsci.2010.12.009.
- Bergström, S., et al., 2006. Climate change impacts on runoff in Sweden-assessments by global climate models, dynamical downscaling and hydrological modelling. Climate Research, 16 (2), 101–112. doi:10.3354/cr016101.
- Boé, J., et al. 2007. Statistical and dynamical downscaling of the Seine basin climate for hydro‐meteorological studies. International Journal of Climatology, 27 (12), 1643–1655. doi:10.1002/joc.1602.
- Borga, M., et al., 2008. Surveying flash floods: gauging the ungauged extremes. Hydrological Processes, 22 (18), 3883–3885. doi:10.1002/hyp.v22:18.
- Borga, M., et al., 2014. Hydrogeomorphic response to extreme rainfall in headwater systems: flash floods and debris flows. Journal of Hydrology, 518, 194–205. doi:10.1016/j.jhydrol.2014.05.022
- Chang, T.K., et al., 2017. Choice of rainfall inputs for event-based rainfall-runoff modeling in a catchment with multiple rainfall stations using data-driven techniques. Journal of Hydrology, 545, 100–108. doi:10.1016/j.jhydrol.2016.12.024
- Chen, Y., et al., 2010. Liuxihe model and its modeling to river basin flood. Journal of Hydrologic Engineering, 16 (1), 33–50. doi:10.1061/(ASCE)HE.1943-5584.0000286.
- Chen, Y., Li, J., and Xu, H., 2016. Improving flood forecasting capability of physically based distributed hydrological models by parameter optimization. Hydrology and Earth System Sciences, 20 (1), 375–392. doi:10.5194/hess-20-375-2016.
- Chou, C., et al., 2013. Increase in the range between wet and dry season precipitation. Nature Geoscience, 6 (4), 263–267. doi:10.1038/ngeo1744.
- Creutin, J.D., et al., 2013. A space and time framework for analyzing human anticipation of flash floods. Journal of Hydrology, 482, 14–24. doi:10.1016/j.jhydrol.2012.11.009.
- Cunderlik, J.M. and Simonovic, S.P., 2005. Hydrological extremes in a southwestern Ontario river basin under future climate conditions. Hydrological Sciences Journal, 50 (4), 631–654. doi:10.1623/hysj.2005.50.4.631.
- Davtalab, R., et al., 2017. Improving continuous hydrologic modeling of data-poor river basins using hydrologic engineering center’s hydrologic modeling system: case study of Karkheh River basin. Journal of Hydrologic Engineering, 22 (8), 05017011. doi:10.1061/(ASCE)HE.1943-5584.0001525.
- Emam, A.R., et al., 2016. Impact assessment of climate and land-use changes on flooding behavior in the Upper Ciliwung River, Jakarta, Indonesia. Water, 8 (12), 559. doi:10.3390/w8120559.
- Fang, X. and Pomeroy, J.W., 2016. Impact of antecedent conditions on simulations of a flood in a mountain headwater basin. Hydrological Processes, 30 (16), 2754–2772. doi:10.1002/hyp.v30.16.
- Feldman, A., 2000. Hydrologic modeling system HEC-HMS technical reference manual. Davis, CA: US Army Corps of Engineers.
- Gaume, E., et al. 2009. A compilation of data on European flash floods. Journal of Hydrology, 367 (1), 70–78. doi:10.1016/j.jhydrol.2008.12.028.
- Giorgi, F., et al. 2011. Higher hydroclimatic intensity with global warming. Journal of Climate, 24 (20), 5309–5324. doi:10.1175/2011JCLI3979.1.
- Guo, J.C.Y. and Hargadin, K., 2009. Conservative design rainfall distribution. Journal of Hydrologic Engineering, 14 (5), 528–530. doi:10.1061/(ASCE)HE.1943-5584.0000013.
- Hajani, E., Rahman, A., and Ishak, E., 2017. Trends in extreme rainfall in the state of New South Wales, Australia. Hydrological Sciences Journal, 62 (13), 2160–2174. doi:10.1080/02626667.2017.1368520.
- Hajian, F., et al., 2016. Prediction of climate change effects on the runoff regime of a forested catchment in northern Iran. Hydrological Sciences Journal, 61 (15), 2729–2739. doi:10.1080/02626667.2016.1171870.
- Han, L., et al., 2015. Changing structure of precipitation evolution during 1957–2013 in Yangtze River Delta, China. Stochastic Environmental Research & Risk Assessment, 29 (8), 2201–2212. doi:10.1007/s00477-015-1034-4.
- HEC (Hydrologic Engineering Center), 1998. HEC-1 flood hydrograph package: user’s manual. Davis, CA: US Army Corps of Engineers.
- Hu, C., et al., 2016. Long-term trends in daily precipitation over the Yangtze River Delta region during 1960–2012, Eastern China. Theoretical & Applied Climatology, 125 (1–2), 131–147. doi:10.1007/s00704-015-1493-z.
- Hu, M., et al. 2017. Assessment of hydrological extremes in the Kamo River Basin, Japan. Hydrological Sciences Journal, 62 (8), 1255–1265. doi:10.1080/02626667.2017.1319063.
- Huff, F.A., 1967. Time distribution of rainfall in heavy storms. Water Resources Research, 3 (4), 1007–1019. doi:10.1029/WR003i004p01007.
- Jia, Y., et al., 2001. Development of WEP model and its application to an urban watershed. Hydrological Processes, 15, 2175–2194. doi:10.1002/(ISSN)1099-1085
- Jonkman, S.N., 2005. Global perspectives on loss of human life caused by floods. Natural Hazards, 34 (2), 151–175. doi:10.1007/s11069-004-8891-3.
- Keifer, C.J. and Chu, H.H., 1957. Synthetic storm pattern for drainage design. Journal of the Hydraulics Division, 83, 1–25.
- Kendall, M.G., 1955. Rank correlation methods. Oxford, England: Griffin.
- Liang, X., et al., 1994. A simple hydrologically based model of land surface water and energy fluxes for general circulation models. Journal of Geophysical Research: Atmospheres, 99 (D7), 14415–14428. doi:10.1029/94JD00483.
- Mann, H.B., 1945. Nonparametric tests against trend. Econometrica: Journal of the Econometric Society, 13, 245–259. doi:10.2307/1907187
- Marchane, A., et al., 2017. Climate change impacts on surface water resources in the Rheraya catchment (High Atlas, Morocco). Hydrological Sciences Journal, 62 (6), 979–995. doi:10.1080/02626667.2017.1283042.
- Meißl, G., et al. 2017. Climate change effects on hydrological system conditions influencing generation of storm runoff in small Alpine catchments. Hydrological Processes, 31 (6), 1314–1330. doi:10.1002/hyp.11104.
- Minville, M., Brissette, F., and Leconte, R., 2008. Uncertainty of the impact of climate change on the hydrology of a nordic watershed. Journal of Hydrology, 358 (1–2), 70–83. doi:10.1016/j.jhydrol.2008.05.033.
- Moriasi, D.N., et al. 2007. Model evaluation guidelines for systematic quantification of accuracy in watershed simulations. Transactions of the ASABE, 50 (3), 885–900. doi:10.13031/2013.23153.
- Musau, J., et al., 2015. Hydrological responses to climate change in Mt. Elgon watersheds. Journal of Hydrology Regional Studies, 3, 233–246. doi:10.1016/j.ejrh.2014.12.001
- Nash, J.E. and Sutcliffe, J.V., 1970. River flow forecasting through conceptual models part I—A discussion of principles. Journal of Hydrology, 10 (3), 282–290. doi:10.1016/0022-1694(70)90255-6.
- Olang, L.O. and Fürst, J., 2011. Effects of land cover change on flood peak discharges and runoff volumes: model estimates for the Nyando River Basin, Kenya. Hydrological Processes, 25 (1), 80–89. doi:10.1002/hyp.7821.
- Pachauri, R. K., et al. 2014. Climate change 2014: synthesis report. Contribution of Working Groups I, II and III to the fifth assessment report of the Intergovernmental Panel on Climate Change. IPCC.
- Reshmidevi, T.V., et al., 2018. Estimation of the climate change impact on a catchment water balance using an ensemble of GCMs. Journal of Hydrology, 556, 1192–1204. doi:10.1016/j.jhydrol.2017.02.016
- Roy, L., et al., 2001. The impact of climate change on seasonal floods of a southern Quebec River Basin. Hydrological Processes, 15, 3167–3179. doi:10.1002/hyp.323
- Saghafian, B., et al., 2008. Flood intensification due to changes in land use. Water Resources Management, 22 (8), 1051–1067. doi:10.1007/s11269-007-9210-z.
- Sillmann, J., et al., 2013. Climate extremes indices in the CMIP5 multimodel ensemble: Part 2. Future climate projections. Journal of Geophysical Research Atmospheres, 118 (6), 2473–2493. doi:10.1002/jgrd.50188.
- Taihu Basin Authority of Ministry of Water Resources, 2013–2016. Annual report on flood control and typhoon prevention in Taihu Basin & Southeast Rivers. Shanghai, China: Taihu Basin Authority.
- USDA, SCS (US Department of Agriculture, Soil Conservation Service), 1973. A method for estimating volume and runoff in small watersheds. USDA technical paper, TP-149.
- Wang, Y., et al., 2011. Progress in the research and application of uncertainty analysis methods for hydrological system. Progress in Geography, 30 (9), 1167–1172.
- Wang, Y., et al., 2016. Spatio-temporal characteristics of precipitation and dryness/wetness in Yangtze River Delta, eastern China, during 1960–2012. Atmospheric Research, 172-173, 196–205. doi:10.1016/j.atmosres.2016.01.008.
- Wang, Z., Liu, C., and Huang, Y., 2003. The theory of SWAT model and its application in Heihe Basin. Progress in Geography, 22 (1), 79–86. In Chinese.
- Wilby, R.L., Dawson, C.W., and Barrow, E.M., 2002. SDSM — a decision support tool for the assessment of regional climate change impacts. Environmental Modelling & Software, 17 (2), 145–157. doi:10.1016/S1364-8152(01)00060-3.
- Yang, M.N., et al., 2014. Impacts of urbanization on precipitation in Taihu Lake Basin, China. Journal of Hydrologic Engineering, 19 (4), 739–746. doi:10.1061/(ASCE)HE.1943-5584.0000852.
- Yang, X., et al., 2013. Safety margin for design hyetograph calculated by same-frequency amplification method. Journal of Hydroelectric Engineering, 32 (6), 19–23. In Chinese.
- Yilmaz, A.G. and Imteaz, M.A., 2011. Impact of climate change on runoff in the upper part of the Euphrates basin. Hydrological Sciences Journal, 56 (7), 1265–1279. doi:10.1080/02626667.2011.609173.
- Yu, G., Guo, Y., and Liao, M., 2013. Probe on attributions of extreme floods responding to the climate changes in Lake Taihu catchment. Journal of Lake Sciences, 25 (5), 765–774. doi:10.18307/2013.0520.
- Zhang, Y., et al., 2016. Impacts of climate change on streamflows under RCP scenarios: A case study in Xin River Basin, China. Atmospheric Research, 178-179, 521–534. doi:10.1016/j.atmosres.2016.04.018
- Zope, P.E., Eldho, T.I., and Jothiprakash, V., 2017. Hydrological impacts of land use–land cover change and detention basins on urban flood hazard: a case study of Poisar River basin, Mumbai, India. Natural Hazards, 87 (3), 1267–1283. doi:10.1007/s11069-017-2816-4.