
 ?Mathematical formulae have been encoded as MathML and are displayed in this HTML version using MathJax in order to improve their display. Uncheck the box to turn MathJax off. This feature requires Javascript. Click on a formula to zoom.
ABSTRACT
Rapid urbanization in China has severely disturbed the underlying surface and river systems. The stream structure parameters of Suzhou City were analysed to study the evolution and spatial differentiation of a water system undergoing urbanization. The influencing pattern of different urbanization processes on river system structure and hydrological processes was detected by statistical methods and simulation analysis. The results show that urban sprawl is influenced by both the natural environment and the social economy. At different stages of urbanization, the spatial urban expansion and the natural river characteristics influence the evolution of the river network: during rapid urbanization, the decline in surface water ratio and river density is more intense. The decrease of surface water ratio and river density in rapidly urbanized areas was greatest, followed by that in area urbanized in the 1980s, with few changes in the old town. Under high urbanization, river system indicators tend to stabilize. The rivers’ hydrological features were affected by urbanization, with water yield in the study area increasing from 0.81 to 0.95 m3/m2 (1991–2015). The same rainfall intensity results in higher flood levels and greater risk of flooding under rapid urbanization.
Editor A. Castellarin GUEST EDITORY. Jia
1 Introduction
A river system is the carrier of the hydrological process, playing an important role in the ecological environment, and providing important support for economic and social development (Li et al. Citation2011). Since the beginning of the 20th century, rapid urbanization accompanied by other human activities has profoundly impacted river systems. Of the world’s rivers, 60% have changed with the urbanization process (Surian and Rinaldi Citation2003), and in this process, the increase in impervious surfaces has had a significant influence on surface runoff (Corbett et al. Citation1999), leading to frequent floods and river ecological problems in urbanized areas, and causing a serious threat to the sustainable development of human society.
In the middle of the 20th century, Horton (Citation1945) and Strahler (Citation1957) proposed the well-known Horton law and Strahler river grading method, respectively, which laid the foundation for studying the hydrological effects of urbanization, for example, on river structure. In recent years, with the continuous advancement of urbanization, different scholars have conducted extensive research on how urbanization affects a river system. In particular, urbanization increases the amount of impervious surfaces and channel breadth (Gregory et al. Citation1992), causing a series of effects, such as the shortening of the confluence time, an increase in flood peak, runoff coefficient, etc. (Hollis Citation1975, Brown Citation1988, Ng and Marsalek Citation1992). Water environment problems and water safety issues, such as the decrease of the river network capacity (Vicars-Groening and Williams Citation2007), and the deterioration of water quality (Schueler Citation1994), are increasingly significant. A number of highly urbanized areas have seen a significant decline in water systems. Many stream networks have become angular, for example, in Detroit (USA), where they have lost at least 85% of the stream channels since 1902, while other cities, such as Ann Arbor and Warren (USA), have lost more than 60% of the stream network (Napieralski and Welsh Citation2016). In Michigan, California and the Atlantic coastal areas of the USA, urban stream desert regions (river-free zones) have developed (Elmore and Kaushal Citation2008, Taniguchi and Biggs Citation2015, Napieralski and Carvalhaes Citation2016).
In contrast, China went through rapid urbanization starting in the late 1970s, due to the implementation of the “reform and opening-up” policy, which accelerated economic and social development. In recent years, the river network in the plains area of China has experienced particularly rapid urbanization, with cities such as Shanghai (Yang et al. Citation2004, Yuan et al. Citation2005), and areas such as the Taihu Lake Basin (Han and Mao Citation1997, Chen et al. Citation2007), the Pearl River Delta region (Huang et al. Citation2008, Zheng et al. Citation2009), and the Yangtze River Delta. A dramatic increase in human activities has led to changes in underlying surface conditions, such as land use and land cover, thereby affecting regional hydrological processes. Existing research indicates that the river system in areas of rapid urbanization is strongly influenced (Han et al. Citation2015, Deng et al. Citation2016). For example, the river network of Suzhou Central District became atrophic and blocked (Shao et al. Citation2012). According to Yuan et al. (Citation2007), the river structure for Shanghai can be classified as having an evolution tendency of “natural type – well type – main stream type”. Zhang et al. (Citation2014) found that increasing urban storm floods in Taihu Lake Basin were closely related to rapid urbanization. Research by Li et al. (Citation2007) showed that, while land-use change in the whole Taihu Lake Basin led to an average increase of only 4.11% in runoff from 1985 to 2000, in the Suzhou-Wuxi-Changzhou and Pudong-Puxi sub-regions, which experienced rapid urbanization, the land-use changes resulted in average increases in runoff of 10.07% and 7.03%, respectively, with a maximum of 20–30%. Changes in land use have changed the infiltration capacity of the Earth’s surface (Ge et al. Citation2003), which has a significant impact on the hydrological cycle, resulting in an increase in water volume, a shortened flood formation process (Gao and Wen Citation2002), as well as increased flood disasters.
At present, the study of urban hydrology in the highly urbanized plain water network area is still limited due to intense human activities, as well as the flat terrain with crisscrossing rivers and lakes with their particular properties of runoff and confluence. The characteristics of river systems and hydrological processes vary in different areas, due to the natural characteristics of different river basins and complex human activities, especially under different stages of urbanization. Furthermore, the complexity of the underlying surface conditions and the water yield–confluence mechanism of the river network in the plain region also increase the difficulty of hydrological model simulation and analysis. Therefore, it is urgent to further explore hydrological problems under urbanization in the plain region, including the evolution of the river system, the spatial distribution of streams, and the hydrological characteristics of highly urbanized areas.
The Yangtze River Delta is a highly urbanized area in China. Rapid urbanization has effectively promoted the growth of the regional economy, but, at the same time, it has had a great impact on the original river system, so the processes of rainfall runoff and flooding are seriously affected. Located in the plain river network in the lower reaches of the Yangtze River Delta, Suzhou is a typical urbanized city in China in one of the most economically developed regions. There are many lakes in the area, with a crisscrossing water system and large surface water to land ratio. Rapid urbanization in recent decades has led to a substantial increase in impervious area in the region, the shrinkage of the river network and a change in hydrological characteristics.
It is worth investigating the changing relationship between urbanization and river systems. Therefore, based on the characteristics of the underlying surface and the river network in Suzhou City, combined with the spatial and temporal changes of the underlying surface and water system parameters, two study periods were selected: the periods 1960–1980 and 1980–2015, using the available data of the river system, topographic maps, land-use, hydrology and meteorology. This paper explores the influence of urbanization and other human activities on the structure and hydrological processes of rivers under different stages of urbanization in Suzhou City. The results are expected to provide reference and theoretical support for the protection of the river system, as well as and flood control and mitigation in other urbanized areas of China.
2 Study area and datasets
2.1 Study area
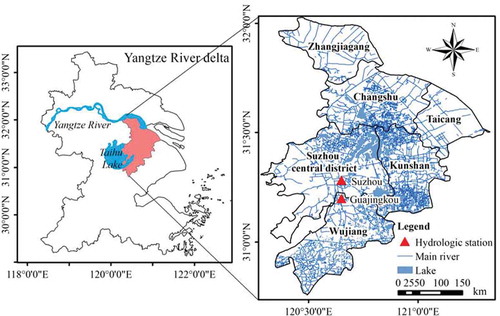
Suzhou City is located between 30.76°–32.04°N and 119.92°–121.33°E, in the downstream reaches of the Yangtze River Delta (). The city area reached 8657.32 km2 in 2015, and dominated by the plain topology, with flat terrain, a large lake area, an intensive river network, and high proportion of water surface. It is located in the subtropical monsoon climate zone, with high temperatures and abundant rainfall. The average annual temperature is 15.7ºC, and the average annual rainfall is 1100 mm. Due to changes in monsoon intensity, there is a clear inter-annual variation of precipitation, and the distribution is uneven throughout the year. In recent years, rapid urbanization and intense human activities have had a profound impact on the river network pattern. The continuous progress of urbanization in Suzhou has had the following impacts: (a) the proportion of urban land area has been increasing constantly; (b) the river network structure has been damaged to certain degrees; (c) many rivers are landfilled and clogged; and (d) runoff and confluence mechanisms have changed. All of these impacts eventually result in more frequent flood disasters in Suzhou City and seriously affect the economic development and social stability.
Figure 1. Location of the study area, Suzhou City showing the hydrological stations.
2.2 Datasets
Three datasets are used in this study: (a) the land-use data of 1973, 1991 and 2015; (b) the corresponding river system data of the 1960s, 1980s and 2010s; and (c) rainfall data and water-level data of Suzhou and Guajingkou stations. The land-use data were acquired by Landsat MSS and TM images, with a resolution of 60 m in 1973 and a resolution of 30 m in 1991 and 2015. Geometric correction, image cropping and reclassification, as well as other processing were performed, and these data were unified to 60 m resolution.
Based on the Land Use Category System of China, the land-use type is interpreted according to the characteristics of the land cover type and the research needs, with interpretation of the accuracy of more than 80% and a kappa coefficient of up to 0.80. The urban boundary is obtained by superposition analysis and topological treatment.
The river system data for the 1960s and 1980s were obtained from paper topographic maps on a scale of 1:50 000. The river system data in the 2010s were obtained from digital line graphic in 2006, also on a scale of 1:50 000, which was modified by using high-precision Google Earth® images from 2014. Since the study area is located in the plain region, where there are crossing and reciprocating rivers, it is difficult to grade rivers according to the traditional rules proposed by Strahler. According to their natural morphology and social function, we divided the rivers into three categories: a river more than 20 m wide is defined as a main river; a secondary river is between 10 and 20 m wide; and a tertiary river is less than 10 m wide. When analysing the characteristics of the river system, the widths of the secondary and tertiary rivers are generalized to 15 m and 5 m, respectively.
Daily water-level data for Suzhou central district were obtained from Suzhou and Guajingkou stations for the period 1961–2014 (each with 54 years of data) (). The rainfall data of Guajingkou station is from 1962 to 2014, while that of Suzhou station is from 1961 to 2014. The two hydrological stations represent the hydrological characteristics of highly and slowly urbanized regions, respectively, and Suzhou station is closer to the highly developed area.
3 Methodology
3.1 Evaluating the stream structure indicator
Referring to the literature on river network structure research in plain areas (Yang et al. Citation2004, Yuan et al. Citation2005, Han et al. Citation2015), and combining the urbanization characteristics of the plain area, a unified index of the structural parameters of the water system was adopted to identify and quantitatively describe the structural evolution of the water system in each period. It is helpful to reveal the changing trend in the internal structure and function of the river network in terms of the planar shape and structural features of the river system. Three parameters were investigated: for the planar shape of the water system, the water surface ratio (Wp) and the drainage density (Dd), and, for its structural characteristics, the main river area to length ratio (RAL) (Han et al. Citation2015).
3.1.1 Water surface ratio (Wp)
The water surface ratio is a common quantitative analysis index in river water systems. It is the proportion of the total area of rivers and lakes in the river basin and is given by:
where Aw is the total area of rivers and lakes, and A is the total area of the river basin or study area.
3.1.2 Drainage density (Dd)
The drainage density reflects the degree of water system development and the density of water distribution, and the greater its value, the stronger the regulation and storage capacity in the basin. Drainage density is given by:
where LR is the total length of the river.
3.1.3 Main river area–length ratio (RAL)
The area–length ratio measures the water area per unit length of the river; the larger its value, the greater the water capacity of the river. It is calculated as:
where Am is the main river area, and Lm is the main river length.
3.2 Water production model
In view of the rainfall and runoff characteristics of the plain area, and considering the influence on the runoff of the underlying surface change, due to the rapid development of urban areas, a single production flow model is not suitable to calculate the water yield. Therefore, the underlying surface is divided into four types, based on the difference of runoff characteristics of different land-use types: construction land, irrigated land, dry land, and non-cultivated land. The water production for each of these land-use types was calculated separately to reveal the impact of urbanization on the runoff process during the rapid urbanization period. The calculation steps of the water production model are described below.
3.2.1 Runoff on construction land (impermeable land)
Construction land is weakly permeable and prone to produce flow; runoff from construction land can be expressed as:
where RC is runoff from construction land, K is a runoff coefficient, and P is precipitation.
3.2.2 Runoff on irrigated land
According to the water balance principle and the water demand of paddy fields in different periods, among other conditions, the water circulation process in paddy fields during rice growing periods can be expressed as:
where M is irrigation water for the period, R is field water requirement, D is displacement, and is water depth variation of the paddy land. The field water demand, R, during the rice growth period includes the amount of plant transpiration, inter-plant evaporation and infiltration. Therefore, equation (5) can be rewritten as:
where α is the paddy growth coefficient of different periods, CE is a conversion coefficient of the evaporation pan, E is evaporation of the evaporation pan, and F is infiltration; the other symbols have the same meaning as before.
To ensure the normal growth of rice, it is necessary to keep the water depth in the field within a certain range: when the water volume is lower than the lower limit of the water depth, irrigation should be carried out; and if the water depth exceeds the upper limit, drainage is required. Since the monthly variation of water depth, , in the paddy field is negligible, equation (6) becomes:
The structure of water production of paddy fields is comprised of drainage and water loss through soil infiltration. Under natural conditions, the cycle of infiltration F out of the soil is less than 1 month, so the changes in soil water storage can be neglected, i.e.:
where G is soil interflow. Thus, paddy water runoff, RR, can be calculated as:
Irrigation water may be derived from both inside and outside an area. Therefore, this was taken into account in the water production model, and the amount of irrigation water from outside the area needs to be deducted. In summary, the paddy field water production is:
where DP is the ratio of precipitation days in a month.
3.2.3 Runoff on dry land and uncultivated land
The study area is located in the plain river network area, where paddy fields account for a significant proportion of the area and the groundwater level is relatively high. Runoff yield of the study area occurs mainly under saturated storage. Therefore, the runoff from dry farmland and uncultivated (i.e. non-irrigated) land can be calculated using the model of saturation excess runoff. First, the evaporation from dry land, EE, is calculated as:
where is CK is the evaporation conversion coefficient of the land surface, E is pan evaporation, WD is the initial soil moisture content, and WM is the average water storage (the maximum possible shortage of soil water). The maximum curve index of water storage, WMM, is calculated as:
where B is the curve index of water storage. Thus,
When P – EE ≤ 0, it produces runoff, i.e.:
where RD is the runoff of dry farmland and non-cultivated land.
When P – EE + A < WMM,
and when P – EE + A ≥ WMM,
3.2.4 Water surface runoff
Runoff from water surface, RW (net depth of rainfall) is the difference between rainfall, P, and evaporation, i.e.:
3.2.5 Total runoff
The total runoff of each sub-area, RT, is calculated by multiplying the runoff depth of each underlying surface by the corresponding area percentage.
where AC, AR, AD and AW are the area weights of construction land, irrigated land, dry farmland and uncultivated land, and water surface, respectively.
Considering that Suzhou is located in Taihu Lake basin, these model parameters are selected based on previous analysis of Taihu Lake basin, and combined with the actual situation of the study area. According to the parameters, the yield model is set up and total runoff is estimated. Among them, referring to rain flood study in the experimental urban area, the average runoff coefficient, KC, in this region is generally 0.5–0.6, and 0.6 is taken in this study. When WM is 100, WD is 50% of WM, B is 0, α is referred from the model of Taihu Lake watershed (Chen et al. Citation2006), and the coefficients CE and CK are as presented in . The above parameters were tested in the Taihu basin region, and it was found that they are reasonable and the model calculation results are precise (Gao and Wen Citation2002, Shao Citation2013). Therefore, these parameters meet the needs of this simulation analysis.
Table 1. Conversion coefficients, CE and CK, used in the study. The pan evaporation conversion coefficient (CE) is determined by evaporation pan E-601; and the land surface evaporation conversion coefficient (CK) is obtained by multiplying CE by a coefficient k. For winter (November, December, January, February), k= 1.0; for spring and autumn (March, April, May and October), k = 1.2; and for summer (June, July, August, September), k = 1.4.
4 Results
4.1 Temporal and spatial variations of urban development in Suzhou
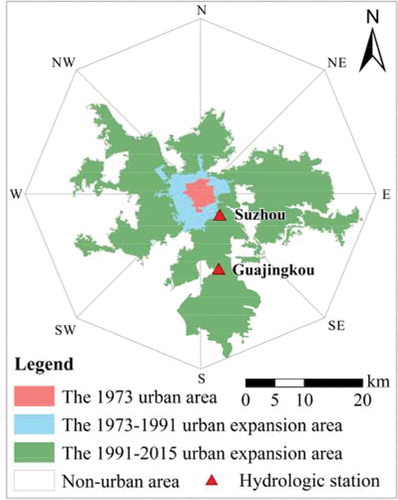
Based on the land-use classification maps of 1973, 1991 and 2015, there are several urban development points in Suzhou, and urban areas are constantly expanding outward around the development points (). Therefore, this study takes the central urban area of Suzhou as the typical town development point. We drew a circle with a radius of 20 km from the geometric centre of Suzhou central urban area in 1973 (120.61°E, 31.32°N), and then divided it into eight equal sectors. For each sector, we used the city boundary vector maps of 1973, 1991 and 2015 to calculate the degree of urban expansion. Since the angles and planes of each sector are equal, the results show clear temporal and spatial variations in urban expansion.
Figure 2. Land use of Suzhou central district in 1973, 1991 and 2015.
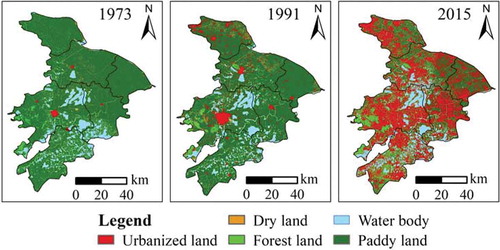
As mentioned before, the central part of Suzhou has been expanding outward gradually. The old town area of Suzhou City in 1973 is referred to as District I, while District II and District III are the urban areas that expanded during the periods 1973–1991 and 1991–2015, respectively, extending to the municipal district of Suzhou (). From the speed of development (), the city developed slowly during the period 1973–1991, with a growth rate of less than 1 km2/year. However, the central city of Suzhou entered a rapidly-developing period of urbanization since 1991, especially in areas E-SE, SE-S, W-NW (). Different processes of urbanization in different districts correspond to the time of development, as shown in .
Table 2. Suzhou central urban spatial expansion in the period 1973–2015.
Table 3. Urbanization processes of the different districts of Suzhou City.
Figure 3. Overlay of urban forms in Suzhou central district during the period 1973–2015.
4.2 Temporal and spatial variations of river structure in Suzhou
Within the urbanization of the study area, the 1960s–1980s was in a slow development stage, with no significant changes. However, during the 1980s–2010s, Suzhou gradually entered a stage of rapid urbanization. Therefore, the land-use classification of 1973, 1991 and 2015 can be taken to correspond to the stream data of the 1960s, 1980s and 2010s. By combining the water system data from the districts I, II and III, and comparing the internal changes in the water systems in the three periods under different urbanization processes, the influence of urbanization on the river system can be better explained.
Analysis of the length of different grades of river network ()) shows that the amount of variation in secondary and tertiary rivers is the most significant, while that in the main rivers is less evident. In the 1960s–1980s period, a large number of secondary rivers disappeared. However, the quantity of water increased greatly in tertiary rivers, while it increased only slightly in main rivers, indicating that some secondary rivers were likely to have been transformed into tertiary rivers or widened to become part of the main rivers. The variation of river length in District III is similar to that in districts I and II, but the range of change is smallest. In the 1980s period, the main rivers became stable and the number of tertiary rivers decreased in districts I and II, but there were fewer secondary rivers in District II. The rivers of District III continued to shorten at all levels. The analysis of the structural composition of rivers leads to the conclusion ()) that District I tends to be tributary-river-structure dominant, and that the main rivers are becoming more and more significant in District III. Secondary rivers of these two districts are seriously reduced. However, in District III, tertiary rivers have increased, striking a balance among the river distribution at all levels.
Figure 4. Quantity characteristics of the river system in Suzhou central district: (a) change ratio of stream length (%), and (b) structural composition of river networks in different districts (%).
Based on the analysis of the changes of river network above, GIS spatial analysis technology and a Rose diagram are used to reveal further spatial and temporal variations of the river system from the aspect of drainage and structural characteristics in different districts during the past 50 years (). Over nearly half a century, the water system in Suzhou showed an overall decay.
Figure 5. Features of the river system in Suzhou central district: (a) river density (km/km2), (b) water surface ratio (%), and (c) river area–length ratio (10−3 km2/km).
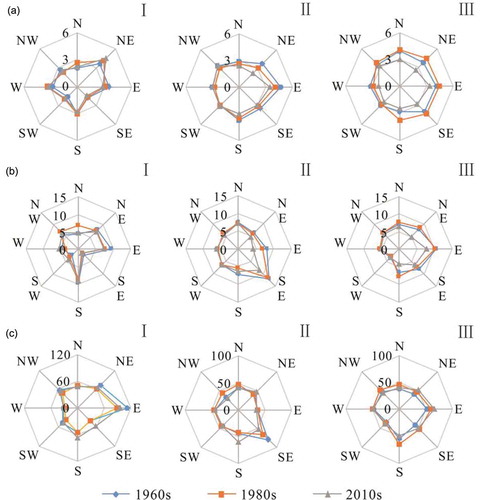
The spatial variation of river density (Dd) is enormous under different urban processes. The decay trend during the 1960s–2010s is District III > District II > District I, and the average variation range is – 5.92, – 4.53 and 0.39 km/km2, respectively ()). For District I, Dd changes little in all three periods. The Dd of District II is not decreasing in the SW, W and NW areas, and the attenuation of this whole area is large. The Dd reduced by an average of 0.34 and 0.23 km/km2 in the 1960s–1980s and 1960s–1980s, respectively. In District III, Dd increases slightly in the natural state, but decreases greatly after rapid urban development, with a range of up to 1.81 km/km2. The water surface ratio, Wp in District I is not high ()), so the change in Wp is small. The Wp of most areas in the 1960s–1980s in District II decreased, and after the 1980s the rate of decrease became larger, especially in the SE and E areas. The Wp of District III shows the trend of increasing first and then decreasing, especially in the NE, E, SE and S areas. The Wp is greatly attenuated in the 1980s–2010s. With the development of urbanization, the main river area–length ratio (RAL) of District I shows a trend that reduces first and then increases ()). A changes in RAL is not obvious in District II, and the RAL increased or decreased only in some regions. The decrease of RAL is constant in SE, but the trend of RAL in NW increased after it decreased. The RAL continues to increase in District III. In general, the average variation of RAL during the 1960s–2010s in districts I, II and III is – 1.14, – 1.45 and 3.79 × 10⁻³ km2/km, respectively, and the RAL in the W and SW is relatively stable.
4.3 Temporal and spatial variations of hydrological characteristics in Suzhou
Over the past few years, the mean water level of Suzhou station has been steady at 2.90 m. The annual mean water level has been increasing since the 1970–1979 period, with the rate of increase becoming faster. The mean water level in the 2000–2009 period reached its maximum and then declined. The maximum water level in the Suzhou is peaked in the 1990–1999 period. The maximum water level has gradually declined since the 2000–2009 period and is even lower than the mean water level in the 2010–2014 period. In addition, the lowest water level has been increasing since the 1970–1979 period. The multi-year mean water level of Guaijingkou station is 2.91 m, and the mean annual water level has gradually increased, which is transferred to positive anomaly in the 1980–1989 period. The minimum and maximum water levels in the 1962–1969 period and the 1970–1979 period are negative anomalies, which have been averaged over the years since the 1990–1999 period (). In general, the water level of the later period is not only higher than the mean annual water level but also higher than that of the earlier period. And the closer the ages are, the higher the mean water level probably is. Extreme water level is almost controlled by water conservancy facilities. As the process of urbanization progresses, the maximum water level tends to be reduced by manmade controls, and the minimum water level may continue to increase.
Figure 6. Anomalous changes in the inter-annual water level at (a) Suzhou station and (b) Guajingkou station. Along the x-axes, i: 1962–1969; ii: 1970–1979; iii: 1980–1989; iv: 1990–1999; v: 2000–2009; and vi: 2010–2014.
The Mann-Kendall (MK) test (a = 0.01) was adopted to find the point of abrupt change. The results show that the maximum water level change occurred in 1979 at Suzhou station and in 1986 at Guajingkou station; the minimum and mean annual water levels are centred around the early 1990s. In fact, since China’s reform and opening-up policies were implemented at the end of the 1970s, human activities have increased gradually. It was also during the 1990s that Suzhou urban area expanded rapidly (Yao et al. Citation2009). Combined with the water level dataset and corresponding to the sudden change of time nodes, this study reveals the characteristics and rules of the water level changes before and after the rapid urbanization. Overall, the maximum water level has the highest dispersion degree, and the mean water level was second. The median value of highest water level has significantly increased, and its volatility range also increased after the abrupt change. The average water level of the two sites before urbanization is basically the same as that of the lowest water level. The minimum water level of Suzhou station is more stable, but the minimum water level fluctuates at Guajingkou station. The mean water level and minimum water level after the abrupt change tends to focus, indicating a clear increase in the trend ().
Figure 7. Box-plots of water level at Suzhou and Guajingkou stations before and after rapid urbanization: (a) maximum, (b) minimum and (c) mean water levels. BAC: before abrupt change; AAC: after abrupt change.
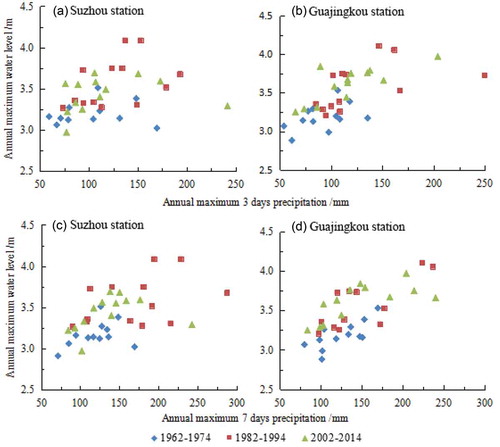
However, the rapid expansion of urban areas and the increase of urban construction land resulted in drastic changes in the underlying surface, leading to a drastic change in the relationship between rainfall and water level, such as frequent occurrence of the “light rain great flood” phenomenon. According to the characteristics of urbanization in Suzhou, and to make the data comparable, the time series was divided into three periods, namely 1962–1974, 1982–1994 and 2002–2014, with a time interval of 13 years each. We selected datasets of maximum 3-d and 7-d precipitation and the annual highest water level, which have the best correlation (0.559 or 0.671) to analyse the response trend of extreme rainfall and water level in flood peak in each period (). For Suzhou station, the flood peak water level under the condition of the underlying surface of 1982–1994 is much higher than the water level under the condition of the underlying surface of 2002–2014, when the maximum 3-d and 7-d precipitation is more than 150 mm. Through analysis of the Pearson correlation coefficient (), the correlation between annual maximum 3-d and 7-d precipitation and the maximum water level is seen to gradually weaken. Suzhou station comes into the process of urbanization earlier than Guajingkou station does, and its hydrological process shows the more significant change. As a result, the flood level is higher and the risk of flood is greater for the same intensity of rainfall. One of the causes of this phenomenon is the rapid development of urbanization before the 1990s, and water level is raised by the increase of runoff yield and concentration. At the same time, the Yangtze River Delta experienced frequent heavy rainstorms during the 1990s, resulting in a higher flood peak water level in the 1980s and 1990s. After that, the impacts of the gates, pumps and other water conservancy project works on water regulation is gradually increased, resulting in the increase in water level in this area being less responsive to rainfall.
Table 4. Correlation (Pearson correlation coefficient, r) between annual maximum 3-d and 7-d rainfall and annual maximum water level at Suzhou and Guanjingkou stations.
Figure 8. Relationship between (a, b) 3-d and (c, d) 7-d annual maximum rainfall and annual maximum water level in different periods at Suzhou and Guajingkou stations.
In order to further analyse the change in storm and flooding characteristics caused by underlying surface land-use change in the process of urbanization, based on the model of runoff in the study area, it is necessary to combine the historical flood with the typical precipitation distribution. Considering that the storm flood in 1991 is typical, and many water conservancy projects were built in the study area to improve the regional flood control capacity after the flood disaster in 1991, the study adopted the precipitation conditions in 1991 for simulation analysis to reveal the runoff yield characteristics of different urbanization stages. Taking the rainy season of 1991, we used underlying surface land use of 1991, 2001 and 2015 to calculate the water yield per unit area in three regions ().
Figure 9. Water yield per unit area (m3/m2) in different periods of for the three districts of Suzhou City.
In the whole region, due to the rapid expansion of urban land, the increase of impervious surface area is enormous, and the water yield per unit area with underlying surface of 2015 is greater than that in 1991 and 2001, with a significant increase in 1991–2001. During that period, the urban expansion was dramatic, land-use change large, and the urban areas grew rapidly. They entered a period of rapid urbanization as early as 1991, and the degree of urbanization is high, so the water yield does not change much, and even decreases in the period 2001–2015. This is related to the fact that low-impact development measures are vigorously promoted to reduce the impact of urban development and construction on the ecological environment. However, for the district, which located in the periphery of the city, the urbanization rate is not high due to the late entry into the urbanization process, the increase of regional urban water yield is dramatic during the period of rapid urban development in 1991–2001. With the progress of urbanization, the change of water production under the drastic change in the underlying surface shows a strong response to urbanization. However, when the degree of urbanization has reached a certain stage, to mitigate flood control pressure, low-impact development measures such as widening the channels will be adopted and a green space ecosystem will be constructed. Since 2001, accompanied by the implementation of the national garden city, Suzhou’s green area coverage has increased significantly in the urban area, from 3833 to 17 551 ha in 15 years, leading to a rapid increase in green area coverage rate in developed areas, with a total increase of 8.97% (Suzhou Statistics Bureau Citation2002–2016). As a result, the increase in water yield is small in the high-speed urbanization area.
5 Discussion
5.1 Influence of urbanization process on river system
Urban sprawl has both temporal and spatial characteristics, and is influenced and restricted by both the natural environment and economic development. Before the 1970s, the morphological scope of the urban areas was basically confined to the ancient city. Subsequently, into the 1990s, urban sprawl spread eastward and westward, conforming to the Suzhou government’s planning. In 2001, Suzhou central district further expanded to the north and south, finally forming the spatial structure of a cross (+) (Yao et al. Citation2009). The characteristics of the river system in the western region have not changed basically, while those in the eastern region have changed the greatest, followed by those of the south and the north. This is coincident with the guidelines of urban development “East to cooperate with Shanghai; North to respond to the development along the Yangtze River, strictly protect the western ecological region, adjust and optimize the southern space”, which were proposed in the 11th Five-Year Plan of Suzhou.
Furthermore, the variation characteristics of different levels of river system are varying under the disturbance of natural characteristics of river basin and complex human activities in the different stages of urbanization. For the quantitative characteristics of different levels of river system, the secondary and tertiary rivers are mainly affected by the changes of land use, and are significantly reduced. The main river is relatively stable and more affected by water conservancy facilities. As urbanization continues, urban space continues to expand, primarily at the expense of farmland and water area. Thus, the direct burial of river courses and the contraction of rivers are carried out simultaneously. In the changing trend of the river system structure, the spatial characteristic indexes are decaying constantly in the early stages of urbanization, while the river density and water surface ratio are decaying constantly, especially during rapid urbanization. During the highly urbanized period, the urbanization gradually becomes saturated and the main river begins to be widened to alleviate the city flood pressure. The river system structure becomes stable and simple. It is worth mentioning that the urban periphery where the urbanization process starts late takes the regional flood control pressure, and the main river area here is increasing. Due to the late start of urbanization in China, it has not yet reached saturation stage. Combined with research in China and abroad, we have found that, after urbanization gradually reaches saturation, the late stage of urbanization has little or no effect on the river network (Zhou et al. Citation2008). The urban river system tends to be stable and the new urbanization period will reach the new equilibrium. Whether China’s river systems will follow this trend needs to be further explored.
5.2 Influence of urbanization process on hydrological characteristics
The influence of human activities on regional hydrological characteristics is becoming more and more clear due to urbanization, which is mainly manifested by land use/cover change, construction of many water conservancy projects and other changes in the underlying surface conditions of the basin, affecting the hydrological processes in the region. On the one hand, due to the rapid urbanization, the land use changed a lot, with urban construction land increased significantly, which occupied a lot of rivers and lakes and led to attenuation of the morphological and structural characteristics of the river system. The increase of in impervious surfaces and river channelization made the arrival time of the flood peak earlier, the flood peak flow higher, flood process shortened and the volume concentrated. The change of water yield under the drastic land-use change has a strong response to different stages of urbanization. Gao and Wen (Citation2002) and Zheng et al. (Citation2009) researched, respectively, in Taihu Lake basin and Shenzhen City, and their studies point out that, with the continuous development of urbanization, impervious surfaces are increasing, and the same magnitude of rainfall results in higher floodwater levels and greater water yield. Zhou et al. (Citation2008) further found that the influence of urbanization on the river network would experience the reverse change accompanied with the process of urbanization, from occupying to protecting and then restoring the river network of Shenzhen. This is also reflected in our conclusions. In the early stage of urbanization, the increase of urban area results in the increase of regional water yield. In the period of rapid development, out of the flood control pressure in the city, the rivers are widened and dredged. As a result, impervious surface and the water yield will even reduce.
On the other hand, a large number of water conservancy facilities after urbanization, such as sluices and pumping stations, also affect the water level. The water levels in highly urbanized areas with advanced economies are actually controlled by artificial measures to alleviate urban flooding. Before the 1980s, the water conservancy facilities in the whole area were scattered across suburban areas, and human activities had less influence on the hydraulic connection of the river networks. Then, with the increasing development of urban construction, urban water conservancy facilities began to be built in large quantity in urban areas, mainly along the main river channels. This study finds that each characteristic water level increased gradually, which is in line with the development of urbanization. After the urbanization, the extreme water level has an obvious increasing trend, but the highest water level fluctuates. The precipitation–water level process is collectively influenced by land use change, water conservancy facilities regulation and other human activities, and such influence is growing. First, a hardened underlying surface leads to shortened flood processes and concentrated flood volumes. A lot of runoff is discharged from the polder district through pumps during a heavy rainfall event, which would make the water level of the main river increase sharply. Moreover, such pumping projects also played an important role in improving regional water environment through artificial regulation. The use of higher normal water levels will increase the ability to dilute pollutants to some extent and improve the water quality, but it will also make the flood risk become higher. Therefore, some measures must be taken to lower the water level in the polder districts before a heavy rainstorm occurs.
6 Conclusions and future work
Taking Suzhou, a typical plain river network in China, as an example, this paper mainly discusses the influence of urbanization on the structural and hydrological characteristics of the river network. Our research shows:
The process of urbanization has developed rapidly. From 1973 to 1991, urbanization experienced slow progress, but rapid development occurred during the period 1991–2015. As the urbanization process continued to develop, urban space continued to expand, primarily at the expense of farmland and water surface area. The process of urban sprawl follows different stages and has different trends, and is influenced and restricted by both the natural environment and the social economy.
The influence of urbanization on river system structure is obvious. In the different stages of urbanization, the direction, speed, scale and mode of spatial urban expansion and the natural characteristics of the river basin have influenced the transformation and evolution of the river network to different degrees. At the early stage of urbanization, the river system is decaying constantly. At the same time, the river network structure tends to be weakened and simplified. During the rapid development urbanization period, the river system is basically stable and tends to develop. Finally, during the highly urbanized period, the urbanization gradually reaches its saturation point, and the river system structure becomes stable. During the 1960s–2010s (the period of rapid urbanization), the attenuation trend of surface water rate and river density is District III > District II > District I. And the average variation of RAL in these three districts is 3.79, – 1.45 and – 1.14 × 10⁻³ km2/km, respectively. In particular, the change of these indicators in the NE-S area is more significant than in other areas.
The hydrological characteristics of the river are deeply affected by the urbanization process. Along with the progress of urbanization, regional water level and the rainfall–water level process has changed. Compared to the stage before urbanization, the inter-annual water level, maximum and minimum water levels increase significantly in the stages after urbanization. However, the highest annual water level has declined slightly, which is related to human activities such as water conservancy regulation and control. Floods caused by the same rainfall intensity have a higher flood level and greater risk of flooding under rapid urbanization. At the same time, the change of water yield has a strong response to the change of land use. The higher the urbanization, the greater the water yield will be. From 1991 to 2015, the water yield per unit area increased from 0.81 to 0.95 m3/m2 in the whole study area. In the period of high urbanization, the water yield changes in a reverse direction. Due to flood control pressure, measures are taken to increase urban green spaces and widen the main river channels. As a result, impervious surface and water yield will decrease.
At present, there are many studies on the impact of urbanization on the changes of river systems and their hydrological features. The research results in different areas show that rapid urbanization leads to the attenuation of a river system and its hydrological process is deeply affected. However, research on the impact of different urbanization processes on hydrological processes needs further study. The ecological protection of rivers and waterbodies has become an urgent problem to be solved by analysing the influence of land-use and climate change in river systems on water level processes under rapid urbanization with simulation and other methods.
Acknowledgements
The authors thank Jiangsu Province Hydrology and Water Resources Investigation Bureau for supplying data used in this study.
Disclosure statement
No potential conflict of interest was reported by the authors.
Additional information
Funding
References
- Brown, R.G., 1988. Effects of precipitation and land use on storm runoff. JAWRA Journal of the American Water Resources Association, 24 (2), 421–426. doi:10.1111/jawr.1988.24.issue-2
- Chen, W., Wang, C., and Zhu, Y., 2006. Research of water volume model for river systems in Taihu Lake basin. Nanjing: Hohai University.
- Chen, Y.X., Xu, Y.P., and Fu, W.J., 2007. Influences of urbanization on river network in the coastal areas of East Zhejiang. Advances in Water Science, 18 (1), 68–73.
- Corbett, D.R., et al., 1999. Patterns of groundwater discharge into Florida Bay. Limnology & Oceanography, 44 (4), 1045–1055. doi:10.4319/lo.1999.44.4.1045
- Deng, X., et al., 2016. Spatial-temporal changes of river systems in Jiaxing under the background of urbanization. Acta Geographica Sinica, 71 (1), 75–85.
- Elmore, A.J. and Kaushal, S.S., 2008. Disappearing headwaters: patterns of stream burial due to urbanization. Frontiers in Ecology & the Environment, 6 (6), 308–312. doi:10.1890/070101
- Gao, J.F. and Wen, Y.H., 2002. Impact of land use change on runoff of Taihu basin. Acta Geographica Sinica, 57 (2), 194–200.
- Ge, Y., et al., 2003. Simulation of flood disaster scenario under driving action of land use change in urb of shanghai. Journal of Natural Disasters, 12 (3), 25–30.
- Gregory, K.J., Davis, R.J., and Downs, P.W., 1992. Identification of river channel change due to urbanization. Applied Geography, 12 (4), 299–318. doi:10.1016/0143-6228(92)90011-B
- Han, C. and Mao, R., 1997. The structure characteristics and the functional variation of the river systems in Taihu Lake catchment. Journal of Lake Science, 9 (4), 300–306. doi:10.18307/1997.0403
- Han, L., et al., 2015. Temporal and spatial change of stream structure in Yangtze River Delta and its driving forces during 1960s-2010s. Acta Geographica Sinica, 70 (5), 819–827.
- Hollis, G.E., 1975. The effect of urbanization on floods of different recurrence interval. Water Resources Research, 11 (3), 431–435. doi:10.1029/WR011i003p00431
- Horton, R.E., 1945. Erosional development of streams and their drainage basins; hydrophysical approach to quantitative morphology. Geological Society of America Bulletin, 56 (3), 275–370. doi:10.1130/0016-7606(1945)56[275:EDOSAT]2.0.CO;2
- Huang, Y.L., et al., 2008. Stream construction characteristics in rapid urbanization area: shenzhen city as a case. Geographical Research, 27 (5), 1212–1220.
- Li, H.P., Yang, G.S., and Jin, Y., 2007. Simulation of hydrological response of land use change in Taihu basin. Journal of Soil & Water Conservation, 19 (5), 537–543.
- Li, Y.Y., et al., 2011. Issues and challenges for the study of the interconnected river system network. Resources Science, 33 (3), 386–391.
- Napieralski, J.A. and Carvalhaes, T., 2016. Urban stream deserts: mapping a legacy of urbanization in the United States. Applied Geography, 67, 129–139. doi:10.1016/j.apgeog.2015.12.008
- Napieralski, J.A. and Welsh, E.S., 2016. A century of stream burial in Michigan (USA) cities. Journal of Map, 12 (S1), 300–303. doi:10.1080/17445647.2016.1206040
- Ng, H.Y.F. and Marsalek, J., 1992. Sensitivity of streamflow simulation to changes in climatic inputs. Nordic Hydrology, 23 (4), 257–272. doi:10.2166/nh.1992.0018
- Schueler, T.R., 1994. The importance of imperviousness. Watershed Protection Techniques, 1 (3), 100–111.
- Shao, Y.L., 2013. Changes of river network structure and connectivity of Taihu Lake basin and its influence on floods. Thesis (Master). Nanjing University.
- Shao, Y.L., Xu, Y.P., and Ma, S.S., 2012. Change of river structure and stream network connectivity in the Taihu Lake basin under the urbanization development——a case study in urban Suzhou. Resources & Environment in the Yangtze Basin, 21 (10), 1167–1172.
- Strahler, A.N., 1957. Quantitative analysis of watershed geomorphology. Eos Transactions American Geophysical Union, 38 (6), 913–920. doi:10.1029/TR038i006p00913
- Surian, N. and Rinaldi, M., 2003. Morphological response to river engineering and management in alluvial channels in Italy. Geomorphology, 50 (4), 307–326. doi:10.1016/S0169-555X(02)00219-2
- Suzhou Statistics Bureau, 2002–2016. Suzhou statistical yearbook. Beijing: China Statistics Press.
- Taniguchi, K.T. and Biggs, T.W., 2015. Regional impacts of urbanization on stream channel geometry: A case study in semiarid southern California. Geomorphology, 248, 228–236. doi:10.1016/j.geomorph.2015.07.038
- Vicars-Groening, J. and Williams, H.F.L., 2007. Impact of urbanization on storm response of White Rock Creek, Dallas, TX. Environmental Geology, 51 (7), 1263–1269. doi:10.1007/s00254-006-0419-6
- Yang, K., et al., 2004. Stream structure characteristics and its urbanization responses to tidal river system. Acta Geographica Sinica, 59 (4), 557–564.
- Yao, S.M., et al., 2009. Spatial expansion patterns of Chinese big cities——the case of Suzhou. Scientia Geographica Sinica, 29 (1), 15–21.
- Yuan, W., Yang, K., and Tang, M., 2005. Stream structure characteristics and their impact on storage and flood control capacity in the urbanized plain river network. Geographical Research, 24 (5), 717–724.
- Yuan, W., Yang, K., and Wu, J.P., 2007. River structure characteristics and classification system in river network plain during the course of urbanization. Scientia Geographica Sinica, 27 (3), 401–407.
- Zhang, M.Y., et al., 2014. The impact of land use changes on streamflow in Taihu basin. Journal of Beijing Normal University, 50 (5), 467–471.
- Zheng, J., et al., 2009. Modeling the impacts of land use change on hydrological processes in fast urbanizing region——a case study of the Buji watershed in Shenzhen city, China. Journal of Natural Resources, 24 (9), 1560– 1572.
- Zhou, H.J., et al., 2008. River network change and its ecological effects in Shenzhen region in recent 30 years. Acta Geographica Sinica, 63 (9), 969–980.