
 ?Mathematical formulae have been encoded as MathML and are displayed in this HTML version using MathJax in order to improve their display. Uncheck the box to turn MathJax off. This feature requires Javascript. Click on a formula to zoom.
ABSTRACT
This investigation proposes the use of the analytic hierarchy process (AHP) to evaluate potential sites for stream monitoring and broadcast of flood warnings. The methodology adopts variables established by the World Meteorological Organization (WMO) for the selection of stream-monitoring sites and incorporates new variables associated with the stream morphometry and hydraulics. The proposed approach quantifies subjective valuations through pairwise comparisons of judgements within the selection criteria. The uncertainty of expert judgement was assessed via Monte Carlo simulations and its effects on the resulting priority vector were analysed. This approach was applied on three main mountain watershed streams at which 11 alternative stream-gauging sites were evaluated and scored. According to our findings, six variables explain 0.711 of the total weight in the priority vector for the evaluation of a candidate site. Our approach is suitable for selecting the most stable alternative location based on a multi-criteria analysis in an inter-comparison arrangement.
Editor S. Archfield Associate editor N. Ilich
1 Introduction
Reliable knowledge of streamflow variability is essential to flood risk mitigation, water resources planning and allocation, conservation of riparian and aquatic ecosystems and drought risk management. The Intergovernmental Panel on Climate Change (IPCC) has warned about the poor spatial accuracy of existing information to assess recent trends and implement reliable climatic models in developing countries (Magrin et al. Citation2014). This lack of knowledge results in challenges for watershed management and development of meaningful prevention, warning and mitigation mechanisms (Krzysztofowicz Citation1993, Penning-Rowsell et al. Citation2000, Werner et al. Citation2006). Accordingly, improving the hydrometric monitoring in developing countries is an urgent requirement for designing proper water management plans. However, it is tied to the capital and operating costs of hydrometric stations and it is needed to develop not just low-cost technologies (Peña et al. Citation2017), but is also highly desirable to select the best locations to generate high quality data and introduce the possibility for early flood warning systems particularly in high-grade streams (García-Parra et al. Citation2016), which are defined as stream reaches having a water-surface slope greater than 6%.
Site selection for installing hydrometric stations is conducted based on the requirements outlined by the World Meteorological Organization (WMO Citation2008). Judgement frameworks for the implementation of the WMO criteria have been rarely addressed and discussed in the literature. Previous studies have been concerned with the optimal design of hydrometric networks. For example, (Mishra and Coulibaly Citation2009) provide a review of several methods of hydrometric network design, including statistical, entropy-based and optimization methods, among others. However, these methods have focused mostly on establishing hydrometric networks that reduce data redundancy between stations and maximize benefit/cost ratios. Very few studies, if any, provide methodologies for selecting the location of hydrometric stations based on a quantitative evaluation of the physical characteristics of the alternative sites (Peña et al. Citation2011). The main contributions of this paper are to implement an objective way to quantify subjective judgements for the evaluation of stream-gauging site alternatives, and to introduce new morphometric, hydraulic and safety variables relevant in the context of flood early warning systems and the operation of measurement instruments, in addition to the WMO criteria.
The quantitative assessment of the weights for each variable was performed through the implementation of the analytic hierarchy process (AHP), which was introduced due to its multi-criteria decision making (MCDM) ability to integrate hard data with subjective judgements concerning intangible factors (Kahraman et al. Citation2007, Saaty Citation2013). The AHP has been used to solve complex decision-making problems, including those related to finding a solution to the issue of location (Aras et al. Citation2004). Key to the AHP is the pairwise comparison procedure for deriving relative measures based on a fundamental scale ranging from 1 to 9 (Saaty Citation2010). According to Sipahi and Timor (Citation2010), the AHP has been applied in a wide range of fields (manufacturing, environmental management, power and energy industry, transportation, construction industry and healthcare). Recent applications showed the usefulness of AHP for solving water resources issues in the context of watershed management (Chowdary et al. Citation2013); landfill site selection (Zelenović Vasiljević et al. Citation2012); flood risk assessment (Chen et al. Citation2011, Stefanidis and Stathis Citation2013); water quality monitoring (Do et al. Citation2013); and groundwater pollution vulnerability (Sener and Davraz Citation2013).
The aims of this paper are: (a) to introduce a quantitative evaluation for the selection of stream-gauging site alternatives; (b) to include additional variables to the WMO criteria for the characterization of potential sites (these new variables are related to improving the decision in terms of considering the potential implementation of flood early warning systems and to guarantee the proper operation of measurement instruments); and (c) to assess the uncertainty of judgements for the site selection process via Monte Carlo simulations. On the one hand, we show the utility of MCDM concepts for choosing the best stream-gauging site among a set of alternatives, and a way for assessing the effect of judgement uncertainty in the decision-making process. On the other hand, this research displays the need to complement the WMO criteria to consider relevant site characteristics for the broadcast of flood warnings and assure the correct operation of measurement instruments in high-grade streams.
2 Material and methods
2.1 Study sites
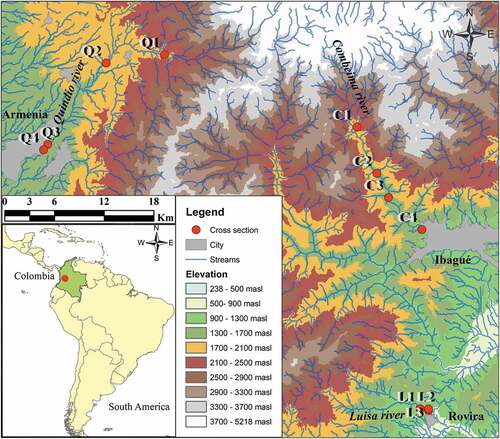
The AHP analysis was implemented in three high-grade streams in the Colombian Andes (Combeima, Quindío and Luisa rivers, ) (See also the Supplementary material, Table S1). The Quindío River is located in the Central Andean cordillera of Colombia; the river drains an area of about 753.5 km2, and has an altitudinal range of between 1040 and 4800 m a.s.l., with an average main channel gradient of 13.24%. The Quindío River basin has mean annual rainfall of 2020.5 mm and mean annual flow of 15.40 m3/s. The Quindío River supplies drinking water to 0.3 million people in the city of Armenia and is an important resource for hydropower generation in the region. The Combeima River, with a drainage area of 278.4 km2 and a main channel gradient of 12.6%, lies in the Upper Magdalena River Basin. The watershed of the Combeima River has an altitudinal range of between 700 and 5150 m a.s.l., mean annual precipitation of 1816.2 mm and mean annual flow of 5.60 m3/s. The river provides drinking water for 500 000 inhabitants of the city of Ibagué and is the primary water supply for the Combeima irrigation district. The Luisa River drains an area of 788.7 km2 within the altitudinal range 271–3378 m a.s.l. and has a mean annual flow of 17.87 m3/s; the main channel gradient is about 10.9% and it provides water resources for agricultural irrigation, hydropower generation and urban supplies. These streams were selected because their watersheds are highly susceptible to flooding, and present economic and social relevance.
Figure 1. Potential locations of hydrometric stations in Combeima, Quindío and Luisa rivers.
2.2 Criteria for characterizing potential stations
The WMO (Citation2008) recommends the evaluation of nine variables for selecting a stream-gauging site. These variables are related to specific characteristics of the channel cross-section and are defined to guarantee the stability of the site and the stage–discharge rating curve. However, the WMO criteria lack factors considering mesoscale effects that can be useful to improve the selection and to implement early warning systems. For this reason, we included eight additional variables based on the morphometric, hydraulic and safety characteristics of the site (). A restriction was defined for each variable that satisfies minimum requirements to consider a site as a candidate for the installation of a stream-gauging station. These restrictions have a physical meaning and a quantitative description, as shown in . We rated each candidate site on a numerical scale by means of a pairwise comparison matrix through a weighted linear function of the 17 variables. The detailed procedure is described in Section 2.3. The sign of the weight for each variable is defined in .
Table 1. Physical factors characterizing each station for stream-gauging site selection. The sign (+ or –) of each variable in the weighting function drives the impact of the variable in the overall score of each candidate site; a positive value contributes to improve the score of the evaluated site, and a negative value penalizes the overall score.
An exhaustive survey of alternative stations was conducted through field observations and cartographic analysis. Field data were collected during low-flow conditions and the 11 channel cross-sections were surveyed in each study reach by standard differential levelling procedures. shows the normalized values of the 17 variables in each candidate site for the three high-grade streams. This procedure was conducted by dividing each variable by its physical maximum in the candidate set. Details of the cross-sections are shown in the Supplementary material (Table S1).
Table 2. Normalized variables of each alternative site for stream-gauge location. All variables are expressed with the weighting sign.
In addition to the WMO criteria, the eight new variables introduced in this study () are related to stream hydraulics, catchment morphometry, operational safety and flood warning alerts. The streambed grade (X10) is relevant to assure a reliable measurement of velocity in each vertical section during the estimation of discharge with current meters (Genç et al. Citation2015, García-Parra et al. Citation2016) and hydro-acoustic methods (WMO Citation2008). Basin slope (X11) is related to the flood wave velocity (Büchele et al. Citation2006) and high values of X11 are associated with flash floods. Time of concentration (X12) influences flood damage (Lugeri et al. Citation2010). Mean flow velocity in the control cross-section (X13) is crucial for travel time estimation (X14) and has an impact on the uncertainty of the flow measurements (Klijn et al. Citation2004, Thieken et al. Citation2005, Winsemius et al. Citation2013, García-Parra et al. Citation2016); a restriction of 0.15 m/s was imposed as the minimum mean flow velocity because a lower value can affect the stability of the control section due to sedimentation. Warning distance (X15) between gauging sites and the town receiving the warning is important in reducing the vulnerability of the population exposed to flood risk (Hall et al. Citation2003, Dutta et al. Citation2006, Brouwer et al. Citation2007, Verkade and Werner Citation2011, Winsemius et al. Citation2013). Safety (X16) depends on the degree of risk by high waters, terrain instability for operators and field technicians in the evaluated site, and risk of vandalism and theft of equipment. Finally, distance from the site to tributaries (X17) is important since tides and backwaters affect the measurement of flow velocity and depth in the control cross-section (Prinos Citation2008, Mishra and Coulibaly Citation2009, McIntyre et al. Citation2012, Whitfield Citation2012).
2.3 Analytic hierarchy process (AHP) for stream-gauge selection
The issue of selecting an appropriate site for the establishment of a stream-gauging station was addressed through the implementation of the standard analytical hierarchy process, which is based on the opinion of experts (Saaty Citation2013). Moreover, a randomized version of the AHP was implemented to deal with the uncertainty of the decision-making process.
2.3.1 Standard AHP
The AHP is a multi-criteria decision-making technique that assesses the impact of various subjective and/or objective factors in the decision-making process. The AHP integrates hard data with subjective judgements for selecting projects, activities, schemes, or alternatives based on quantitative criteria (Saaty Citation2013). According to Saaty (Citation2013), there are two kinds of decision: intuitive and analytical; intuitive decisions are entirely subjective and are unable to be justified with a logical argumentation, while analytical decisions imply the need to form a judgement and compare between alternatives, or rate them one at a time with respect to an ideal. The AHP supports the latter kind of decision.
The AHP applies a pairwise comparison between variables to build a reciprocal rating matrix between them, which provides the relative weight of each variable. The comparisons were performed with the comparative scale presented by Saaty (Citation2013), which is composed of integer numbers in the range 1–9. The lowest value (1) means that both compared factors are equally important, and the highest (9) means that one of them is much more important than the other. The ranks of the pairwise comparison matrix (PCM, ) indicate the relative importance of one factor (variable) over the other for the selection of stream-gauging station sites; the pairwise comparisons were defined by an expert group of five members, who are professors of watershed science and hydrology at our local universities of Tolima and Ibagué (Colombia). They discussed and formulated specialized opinions regarding the eight new variables that we added to the WMO criteria (), and the quantification of the minimum, maximum and most likely values, comparing the 17 variables in pairs to judge the level of importance in a paired way.
Table 3. Modal pairwise comparison matrix (PCM) for stream-gauging site selection. It must be read by rows, i.e. the importance of variable i (row i) in contrast to variable j (col j). The lower triangular matrix is the reciprocal of the upper one. Importance – 1: equal; 2: weak or slight; 3: moderate; 4: moderate plus; 5: strong; 6: strong plus; 7: very strong or demonstrated; 8: very, very strong; 9: extreme (Saaty Citation2013).
Following Saaty (Citation2013), we defined the relative weights (W) as the normalized eigen vector of the pairwise comparison matrix, also called the “priority vector”. This vector was computed as follows:
each element of column j in the pairwise comparison matrix was divided by the sum of column j, thereby obtaining a normalized matrix in which the sum of each column is 1;
a main vector (MV) was obtained as the sum of each row of the normalized matrix; and
the weight (W) is defined as the element of the main vector divided by its total; thus, the sum of all elements of W is 1.
The consistency of the pairwise comparison was assessed by applying the consistency ratio (CR), which is a scalar value defined as the ratio between the consistency index (CI) and a reference value called the random index (RI). The RI depends on the size of the pairwise comparison matrix; we used a RI of 1.5834, which is reasonable for our pairwise matrix size (Alonso and Lamata Citation2006). The CI was computed as (Stefanidis and Stathis Citation2013):
where λm is the principal eigen value, which was obtained from the sum of the products between each element of the eigen vector (W) and the sum of columns of the pairwise matrix; and n is the size of the pairwise comparison matrix.
Saaty (Citation1980) proposed the CR as a criterion to assess the relation between the CI of the evaluated pairwise matrix and the averaged value of CI over several reciprocal matrices of the same size whose values are random. If CR is significantly small (0.1 or less), we can accept the consistency of the evaluated pairwise matrix. According to Vargas (Citation1982), below this threshold (CR ≤ 0.1) the following hypothesis is plausible: the distribution function of the principal right-eigenvector of a pairwise comparison matrix built with expert judgement is identical to the one for a theoretically consistent pairwise comparison matrix. Vargas (Citation1982) conducted several simulation experiments using the Dirichlet distribution and truncated normal distributions to verify this hypothesis. Therefore, it is widely accepted that a reliable empirical pairwise comparison matrix has a CR ≤ 0.1 (Harker Citation1989, Saaty Citation1990, Saaty and Vargas Citation2012, Sener and Davraz Citation2013, Stefanidis and Stathis Citation2013). We applied this criterion to define consistent pairwise comparison matrices. presents the modal PCM generated by the expert group.
Each candidate site was scored according to:
where Sj is the global score of candidate site j, Wi is the weight of variable i, and Xij is the normalized score of variable i in candidate site j. The best site for discharge gauge installation is the one with the highest global score in each stream.
2.3.2 AHP with monte carlo simulation (MC-AHP)
Expert judgement might introduce errors and can be insufficient to choose the optimal alternative (Ayağ and Özdemir Citation2006); therefore, the assessment of this uncertainty is crucial in multi-criteria decision making. As described in Section 2.3.1, the pairwise comparisons were built with subjective expert opinions. To quantify the propagation of the judgement uncertainty to the priority vector, the nondiagonal elements of the pairwise comparison matrix must be treated as random variables. Triangular distribution is the most commonly used distribution for modelling expert judgements (Vose Citation2008). It is defined by its minimum, most likely and maximum values, but its main drawback is that the mean and standard deviation are equally sensitive to the all three parameters. When the maximum for the distribution is large, it is prone to potential systematic bias issues in the mean. Beta-PERT distribution is exclusively used for modelling expert judgements (Jing et al. Citation2013) and is recommended for this propose because its mean is four times more sensitive to the most likely value than to the minimum and maximum values (Vose Citation2008). Therefore, it is exposed to less potential systematic bias problems than triangular distribution.
To this end, and following Jing et al. (Citation2013), expert estimates were approximated to a Beta-PERT distribution in each nondiagonal PCM element of the lower triangle of the matrix. The Beta-PERT distribution is a variant of the beta distribution and is parameterized by the minimum (a), most likely (b) and maximum (c) values. According to Vose (Citation2008), the Beta-PERT inverse cumulative distribution function for a given probability p and a given set of parameters a, b and c is expressed as follows:
where is the Beta inverse cumulative distribution function, and
Each element of the pairwise comparison matrix was approximated with the Beta-PERT distribution. One hundred thousand (100 000) realizations were sampled from each Beta-PERT distribution using pseudo-random numbers generated with MATLAB, resulting in the same number of PCM samples. Given that the pairwise comparison matrix is reciprocal, each element of the upper triangle of each PCM was calculated as the inverse of the corresponding element in the lower triangle; the elements of each matrix were properly rounded to preserve the comparative scale. A subset of the matrices with consistency ratios lower than 0.1 was selected to support the analysis with reliable random pairwise comparison matrices, therefore a reliable PCM is defined as having a CR < 0.1. Finally, the priority vector of each reliable PCM was calculated by applying the same procedure described in Section 2.3.1, and the corresponding score S was determined with Equation (2) for each alternative and each randomized PCM.
3 Results and discussion
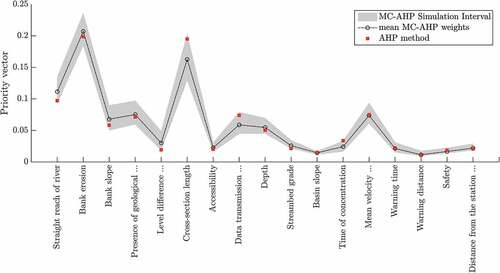
The elements of the priority vector represent the weights of the physical factors for stream-gauging site selection with a consistency ratio of 0.098, which means that the pairwise comparison matrix is reciprocal, the provided judgements are consistent and the pairwise comparisons can be accepted. According to the standard AHP method, the most important variables for the selection are the straightness of the reach (X1), the susceptibility to bank erosion (X2), the presence of geological formations (X4), the cross-section length (X6), the availability for data transmission (X8) and the mean velocity in the cross section (X13). These six variables explain 0.711 of the total weight in the priority vector for the evaluation of a candidate site (). A straight reach and a wide cross-section are associated with lower turbulence and less uncertainty in discharge estimation in the studied stream (Costa et al. Citation2000, García-Parra et al. Citation2016). Low bank erosion and the presence of geological formations in the cross-section are related to a high stability of the cross-section, while the presence of backwaters decreases the mean cross-sectional velocity (Abernethy and Rutherfurd Citation2000, Johannesson and Parker Citation2013, Loizou and Koutroulis Citation2016, Enlow et al. Citation2018).
Table 4. Priority vector defined by the standard AHP method and by Monte Carlo simulation (64 475 reliable PCMs).
The Monte Carlo simulation of 100 000 pairwise comparison matrices resulted in 64 475 reliable realizations (). This subset of realizations showed that the bank slope (X3) and the availability for data transmission (X8) have a similar weight of distribution and magnitude (). On average, the weight of X3 is higher than that of X8 (0.68 and 0.59, respectively, see ), which cannot be seen with the standard AHP analysis. This underlines the advantage and importance of considering the judgement uncertainty in the multicriteria decision method. Despite this difference, the overall performance of the standard AHP method is very close to the priority vector range obtained with the Monte Carlo simulation ().
Figure 2. Histogram of consistency ratio for 100,000 realizations of the pairwise comparison matrices with the Beta-PERT distribution. Realizations are classified as reliable with a CR lower than 0.1 and displayed in blue, inconsistent realizations (CR ≥ 0.1) are displayed in red.
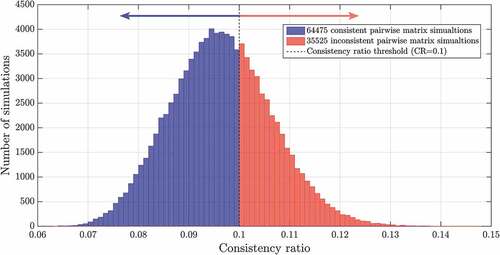
Figure 3. Weights defined with the standard AHP method (red squares) and applying Monte Carlo simulations (64 475 reliable realizations) with the Beta-PERT distribution (simulation interval in grey and mean value represented by black circles).
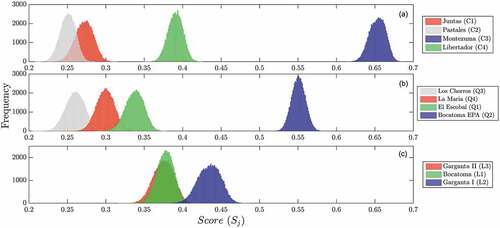
Global scores based on the standard AHP approach for each alternative site () reveal that the best alternatives correspond to the Montezuma site (Combeima River), the Bocatoma EPA site (Quindío River), and the Garganta I site (Luisa River). Montezuma is the most recommendable site in the Combeima River because it has the highest and more stable bank slopes compared to the other alternatives, and because of the straightness of the reach with the best geometry to confine the flow. The highest score of the Bocatoma EPA site in the Quindío River is mainly explained by the high stability of the cross-section, which is expressed by dominant bedrock material and the lowest bank erosion value compared to sites Q1, Q3 and Q4 (). In the Luisa River, the Garganta I site presents lower susceptibility to bank erosion, the straightest reach compared to sites L1 and L3, and the widest cross-section (see Table S1).
Table 5. Weighted variables and overall score of each candidate site with the standard AHP. Shaded rows indicate the best alternative sites.
The best alternative locations found through Monte Carlo simulation are consistent with the standard AHP results. As can be seen by comparing scores shown in and , there is a satisfactory agreement between the standard AHP approach and the Monte Carlo experiment. This would appear to indicate that AHP is a powerful and useful method to be apply in choosing the most appropriate location for a stream-gauging site.
Figure 4. Absolute frequency distribution of scores for alternative locations of stream-gauging stations. Each histogram corresponds to an alternative location and is based on 64 475 reliable realizations of the pairwise comparison matrix with the beta-PERT distribution. Score distribution for (a) Combeima River alternatives; (b) Quindío River alternatives; and (c) Luisa River alternatives.
The reliability of discharge estimation using rating curves is strongly linked with the stability of the channel morphology (Halliday Citation2007), i.e. small changes in cross-section geometry result in changes in the relationship between stream discharge and stage (Ibbitt and Pearson Citation1987, Thomas Citation1988). Therefore, stream-gauging stations must be placed in stable cross-sections. The approach developed in this research is suitable for selecting the most stable site based on a multi-criteria analysis in an inter-comparison arrangement. Our results show that the AHP could be a promising way to quantify subjective judgements for the selection of the best candidate site to establish a stream-gauging station. These findings affirm that the uncertainty of expert judgements most likely has a marginal effect on the final scores of the alternative locations.
Entropy-based approaches (Sarlak and Sorman Citation2006), geostatistical methods (Bastin et al. Citation1984, Chen et al. Citation2008) and optimization techniques (Bastin et al. Citation1984) have been frequently applied for the design of hydro-meteorological networks. The selection of sampling sites in water science has been frequently based on optimization techniques (Dixon et al. Citation1999), spatial statistical analysis (Do et al. Citation2012) and genetic algorithm-related approaches (Perez-Pedini et al. Citation2005). This shows important advances have been reached for the design of streamflow networks and sampling networks on a statistical basis. Nonetheless, known methods applied for choosing a stream-gauging site are based on the qualitative assessment of the morphometric conditions in the cross-section and the related reach (WMO Citation2008), and quantitative approximations for the optimal selection of a specific site are scarce. Progress to date for developing methods to select potential stage and discharge monitoring stations based on multi-criteria analysis is still poor, and AHP could be a future direction for such research.
The selection of a stream-gauging site (Meyer et al. Citation2009) requires an expert judgement criterion (Kron Citation2005). As found in this study, such a process may introduce uncertainty in the assignment of weights, which can be addressed through Monte Carlo simulations.
4 Conclusions
The proposed methodology offers an alternative for the assessment of in-stream monitoring sites and for selecting the best potential stage monitoring site. Based on pairwise comparisons, the weights assigned to each variable can be readily modified to adapt the method to specific study areas or instrumentation aims.
The quantitative evaluation of each candidate site related to the stability of the cross-section is useful to assess the best alternative site. Thus, the proposed AHP approach for selecting stream-gauging sites contributes to the robustness of the rating curves and reliability of the hydrometric data recorded by the stations. Certainly, definition of weights affects the result of the weighting process. In our analysis, we prioritize features of the candidate site linked to the stability of the cross-section and reach. The proposed method preserves the WMO criteria in a quantitative way and incorporates additional criteria. The main advantage of the quantitative analysis is the introduction of an objective basis in the process via the analytic hierarchy process. Future research should consider the comparison of this method with other multi-criteria techniques.
Supplemental Material
Download MS Word (3 MB)Acknowledgements
The authors would like to acknowledge to the environmental authority of Quindío in Colombia for sharing some important Quindío river information (Project no. 0047).
Disclosure statement
No potential conflict of interest was reported by the authors.
Supplementary material
Supplemental data for this article can be accessed here.
Additional information
Funding
Related Research Data
References
- Abernethy, B. and Rutherfurd, I.D., 2000. The effect of riparian tree roots on the mass-stability of riverbanks. Earth Surface Processes and Landforms, 25 (9), 921–937.
- Alonso, J.A. and Lamata, M.T., 2006. Consistency in the analytic hierarchy process: a new approach. International Journal of Uncertainty, Fuzziness and Knowledge-Based Systems, 14 (04), 445–459.
- Aras, H., Erdoğmuş, Ş., and Koç, E., 2004. Multi-criteria selection for a wind observation station location using analytic hierarchy process. Renewable Energy, 29 (8), 1383–1392.
- Ayağ, Z. and Özdemir, R.G., 2006. A fuzzy AHP approach to evaluating machine tool alternatives. Journal of Intelligent Manufacturing, 17 (2), 179–190.
- Bastin, G., et al., 1984. Optimal estimation of the average areal rainfall and optimal selection of rain gauge locations. Water Resources Research, 20 (4), 463–470.
- Brouwer, R., et al., 2007. Socioeconomic vulnerability and adaptation to environmental risk: a case study of climate change and flooding in Bangladesh. Risk Analysis, 27 (2), 313–326.
- Büchele, B., et al., 2006. Flood-risk mapping: contributions towards an enhanced assessment of extreme events and associated risks. Natural Hazards and Earth System Sciences, 6 (4), 485–503.
- Chen, Y.C., Wei, C., and Yeh, H.C., 2008. Rainfall network design using kriging and entropy. Hydrological Processes, 22 (3), 340–346.
- Chen, Y.-R., Yeh, C.-H., and Yu, B., 2011. Integrated application of the analytic hierarchy process and the geographic information system for flood risk assessment and flood plain management in Taiwan. Natural Hazards, 59 (3), 1261–1276.
- Chowdary, V.M., et al., 2013. Multi-Criteria decision making approach for watershed prioritization using analytic hierarchy process technique and GIS. Water Resources Management, 27 (10), 3555–3571.
- Costa, J.E., et al., 2000. Measuring stream discharge by non-contact methods: a proof-of-concept experiment. Geophysical Research Letters, 27 (4), 553–556.
- Dixon, W., Smyth, G.K., and Chiswell, B., 1999. Optimized selection of river sampling sites. Water Research, 33 (4), 971–978.
- Do, H.T., et al. 2012. Design of sampling locations for mountainous river monitoring. Environmental Modelling & Software, 27-28, 62–70.
- Do, H.T., Lo, S.-L., and Phan Thi, L.A., 2013. Calculating of river water quality sampling frequency by the analytic hierarchy process (AHP). Environmental Monitoring and Assessment, 185 (1), 909–916.
- Dutta, D., Herath, S., and Musiake, K., 2006. An application of a flood risk analysis system for impact analysis of a flood control plan in a river basin. Hydrological Processes, 20 (6), 1365–1384.
- Enlow, H.K., et al. 2018. A modeling framework for evaluating streambank stabilization practices for reach-scale sediment reduction. Environmental Modelling & Software, 100, 201–212.
- García-Parra, B., et al. 2016. Uncertainty of discharge estimation in high-grade Andean streams. Flow Measurement and Instrumentation, 48, 42–50.
- Genç, O., Ardıçlıoğlu, M., and Ağıralioğlu, N., 2015. Calculation of mean velocity and discharge using water surface velocity in small streams. Flow Measurement and Instrumentation, 41, 115–120.
- Hall, J.W., et al., 2003. A methodology for national-scale flood risk assessment. Proceedings of the Institution of Civil Engineers - Water and Maritime Engineering, 156 (3), 235–247.
- Halliday, R.A., 2007. Current meter rating in Western Canada. Canadian Water Resources Journal/Revue Canadienne Des Ressources Hydriques, 32 (2), 149–160.
- Harker, P.T., 1989. The art and science of decision making: the analytic hierarchy process. In: B.L. Golden, E.A. Wasil, and P.T. Harker, eds. The analytic hierarchy process: applications and studies. Berlin, Heidelberg: Springer Berlin Heidelberg, 3–36.
- Ibbitt, R.P. and Pearson, C.P., 1987. Gauging frequency and detection of rating changes. Hydrological Sciences Journal, 32 (1), 85–103.
- Jing, L., et al., 2013. Monte Carlo simulation–aided analytic hierarchy process approach: case study of assessing preferred non-point-source pollution control best management practices. Journal of Environmental Engineering, 139 (5), 618–626.
- Johannesson, H. and Parker, G., 2013. Linear theory of river meanders. In: S. Ikeda and G. Parker, eds. River meandering. Washington DC: American Geophysical Union, 181–213.
- Kahraman, C., Demirel, N.Ç., and Demirel, T., 2007. Prioritization of e-Government strategies using a SWOT-AHP analysis: the case of Turkey. European Journal of Information Systems, 16 (3), 284–298.
- Klijn, F., Buuren, M.V., and Rooij, S.A.M., 2004. Flood-risk management strategies for an uncertain future: living with rhine river floods in The Netherlands? AMBIO: A Journal of the Human Environment, 33 (3), 141–147, 147.
- Kron, W., 2005. Flood risk = hazard • values • vulnerability. Water International, 30 (1), 58–68.
- Krzysztofowicz, R., 1993. A theory of flood warning systems. Water Resources Research, 29 (12), 3981–3994.
- Loizou, K. and Koutroulis, E., 2016. Water level sensing: state of the art review and performance evaluation of a low-cost measurement system. Measurement, 89, 204–214.
- Lugeri, N., et al., 2010. River flood risk and adaptation in Europe—assessment of the present status. Mitigation and Adaptation Strategies for Global Change, 15 (7), 621–639.
- Magrin, G.O., et al., 2014. Central and South America. In: V.R. Barros, et al., ed. Climate change 2014: impacts, adaptation, and vulnerability. Part B: regional aspects. Contribution of working group II to the fifth assessment report of the intergovermmental panel on climate change. Cambridge, UK: Cambridge University Press, 1499–1566.
- McIntyre, N., et al., 2012. The potential for reducing flood risk through changes to rural land management: outcomes from the flood risk management research consortium. ed. BHS Eleventh National Symposium. Dundee, UK: Hydrology for a Changing World.
- Meyer, V., Scheuer, S., and Haase, D., 2009. A multicriteria approach for flood risk mapping exemplified at the Mulde river, Germany. Natural Hazards, 48 (1), 17–39.
- Mishra, A.K. and Coulibaly, P., 2009. Developments in hydrometric network design: a review. Reviews of Geophysics, 47, 2.
- Peña, L.E., et al., 2011. Ubicación estaciones hidrométricas. Ibagué, Colombia: Universidad de Ibagué.
- Peña, L.E., et al., 2017. Low-cost alternative for the measurement of water levels in surface water streams. Sensors & Transducers Journal, 217 (11), 36–44.
- Penning-Rowsell, E.C., et al., 2000. The benefits of flood warnings: real but elusive, and politically significant. Water and Environment Journal, 14 (1), 7–14.
- Perez-Pedini, C., Limbrunner James, F., and Vogel Richard, M., 2005. Optimal location of infiltration-based best management practices for storm water management. Journal of Water Resources Planning and Management, 131 (6), 441–448.
- Prinos, P., 2008. Review of flood hazard mapping. Athens: University of Athens, T03–07–01.
- Saaty, T.L., 1980. The analytic hierarchy process. New York: McGraw-Hill.
- Saaty, T.L., 1990. How to make a decision: the analytic hierarchy process. European Journal of Operational Research, 48 (1), 9–26.
- Saaty, T.L., 2010. Mathematical principles of decision making (Principia Mathematica Decernendi). Pittsburgh, PA: RWS Publications.
- Saaty, T.L., 2013. The modern science of multicriteria decision making and its practical applications: the AHP/ANP approach. Operations Research, 61 (5), 1101–1118.
- Saaty, T.L. and Vargas, L.G., 2012. Models, methods, concepts & applications of the analytic hierarchy process. 2nd ed. New York, NY: Springer US.
- Sarlak, N. and Sorman, U.A., 2006. Evaluation and selection of streamflow networks using entropy methods. Turkish Journal of Engineering and Environmental Sciences, 30, 91–100.
- Sener, E. and Davraz, A., 2013. Assessment of groundwater vulnerability based on a modified DRASTIC model, GIS and an analytic hierarchy process (AHP) method: the case of Egirdir Lake basin (Isparta, Turkey). Hydrogeology Journal, 21 (3), 701–714.
- Sipahi, S. and Timor, M., 2010. The analytic hierarchy process and analytic network process: an overview of applications. Management Decision, 48 (5), 775–808.
- Stefanidis, S. and Stathis, D., 2013. Assessment of flood hazard based on natural and anthropogenic factors using analytic hierarchy process (AHP). Natural Hazards, 68 (2), 569–585.
- Thieken, A.H., et al., 2005. Flood damage and influencing factors: new insights from the August 2002 flood in Germany. Water Resources Research, 41 (12), 1–16.
- Thomas, R.B., 1988. Monitoring baseline suspended sediment in forested basins: the effects of sampling on suspended sediment rating curves. Hydrological Sciences Journal, 33 (5), 499–514.
- Vargas, L.G., 1982. Reciprocal matrices with random coefficients. Mathematical Modelling, 3 (1), 69–81.
- Verkade, J.S. and Werner, M.G.F., 2011. Estimating the benefits of single value and probability forecasting for flood warning. Hydrology and Earth System Sciences, 15 (12), 3751–3765.
- Vose, D., 2008. Risk analysis: a quantitative guide. 3rd ed. Chichester, England: John Wiley & Sons.
- Werner, M.G.F., Schellekens, J., and Kwadijk, J.C.J., 2006. Flood early warning systems for hydrological (sub) catchments. In: M.G. Anderson and J.J. McDonnell, eds. Encyclopedia of hydrological sciences. Chichester, UK: Wiley, 1–15.
- Whitfield, P.H., 2012. Floods in future climates: a review. Journal of Flood Risk Management, 5 (4), 336–365.
- Winsemius, H.C., et al. 2013. A framework for global river flood risk assessments. Hydrology and Earth System Sciences, 17 (5), 1871–1892. doi:10.5194/hess-17-1871-2013.
- WMO, 2008. Guide to hydrological practices. Geneva, Switzerland: World Meteorological Organization.
- Zelenović Vasiljević, T., et al., 2012. GIS and the analytic hierarchy process for regional landfill site selection in transitional countries: a case study from serbia. Environmental Management, 49 (2), 445–458.