
 ?Mathematical formulae have been encoded as MathML and are displayed in this HTML version using MathJax in order to improve their display. Uncheck the box to turn MathJax off. This feature requires Javascript. Click on a formula to zoom.
ABSTRACT
This study assesses the climate change impact on rainfall and drought incidents across Nigeria. Linear regression, Mann-Kendall tests and lag-1 serial correlation were adopted to analyse the trends and variability of rainfall and drought at 18 synoptic stations. Analysis of annual precipitation series indicates an increase in rainfall amounts at all stations, except Minna, Gusau and Yola. Seventeen of the 18 stations recorded at least one main drought period, between 1983 and 1987. A decreasing trend for the standardized precipitation index SPI-12 series was seen at Yola station, while the other stations showed an increasing trend. Also, Nigeria witnessed more annual rainfall totals but with high variability within the rainy months of the year in the first 15 years of the 21st century compared to the 20th century. Such variability in rainfall may have a significant effect on groundwater resources and the hydrology of Nigeria.
Editor A. CastellarinAssociate editor I. Overton
1 Introduction
Drought is a critical event that has adversely affected water resource systems, ecosystems and, by extension, human life on Earth (Jahangir et al. Citation2013). Drought is a hydro-meteorological event on land, which is usually characterized by temporary and recurring water shortage that can range from a month to several years. The drought magnitude can be indicated by the extent to which precipitation, soil moisture or runoff falls below a baseline over a certain period of time (Morid et al. Citation2007). Drought is dynamic in nature; a region can witness wet and dry spells concurrently depending on the timescale considered. For instance, a region may experience dryness or wetness for a short duration, while in long run the opposite could be experienced (NCDC Citation2010). Drought intensity is the relationship of drought magnitude to its duration, while drought severity is the degree of precipitation deficit, or the level of impact resulting from the deficit (Wilhite Citation2005). Four types of drought, namely meteorological, agricultural, hydrological and socio-economic, are recognized (Gocic and Trajkovic Citation2013). Meteorological drought is usually defined on the basis of the degree of dryness (i.e. the period of below average monthly rainfall amount) and the duration of the dry period. Agricultural and hydrological drought focus, respectively, on the impact of precipitation shortage on the agriculture and water resources sectors (e.g. surface and groundwater). Socio-economic drought is associated with the supply and demand of some economic goods, which are influenced by the elements of the other types of drought. Understanding the different types of drought is helpful in the development or selection of an efficient index or indices for the proper characterization of drought in a region. Many studies have been undertaken on drought in virtually every continent on Earth (Moreira et al. Citation2008, Shahid Citation2008, Mishra and Singh Citation2010, Khalili et al. Citation2011, Tabari et al. Citation2012, Oguntunde et al. Citation2017) and several indices for characterizing drought have been developed (see Zargar et al. Citation2011). However, a combination of drought and precipitation analysis is essential for the reflection of the climate within a region, especially in the face of changing climate. Precipitation plays an important role, influencing trends in drought occurrence, frequency, or duration within a region (Hisdal et al. Citation2001).
An in-depth understanding of the historical and current trends and variation of rainfall is highly necessary in the hydrological and agricultural sectors of a region. The variability and trend in rainfall plays a major role in most developing countries, as rainfall is the primary source of water for agricultural production on which a good percentage of the economy may depend. Its study also provides a good background for carrying out drought-related studies. Up-to-date information on trends and variability of rainfall, temperature, drought and flooding is crucial for the future planning and sustainability of water resources of any area within the context of climate change, increasing population and economic growth (Cannarozzo et al. Citation2006, Oguntunde et al. Citation2011). Therefore, analysis of precipitation and drought data may provide crucial information on efficient water management strategies, environmental protection, agricultural production planning and its impact on the economic development of a country or region (Gocic and Trajkovic Citation2013), as this study aims to achieve.
Several studies have been carried out on the comparison and analysis of precipitation trends (Gemmer et al. Citation2004, Partal and Kahya Citation2006, Liu et al. Citation2008, Oguntunde et al. Citation2011, Tabari et al. Citation2012). Maidment et al. (Citation2015) observed the recent and simulated changes in precipitation over Africa and discovered that there has been an increase in annual rainfall in the Sahel, South Africa and Central Africa from 29 to 43, 32 to 41 and – 10 to +39 mm year−1 per decade, respectively, while there was an overall decrease in rainfall in the period March–May from – 14 to – 65 mm year−1 per decade. Fauchereau et al. (Citation2003) limited their work to the rainfall variability and changes in southern Africa during the 20th century under global warming. They discovered that some part of southern Africa experienced a shift toward more extreme rainfall events toward the end of the 20th century. Le Barbe et al. (Citation2002) worked on rainfall variability in West Africa between 1950 and 1990. The major finding from their work was that rainfall variation was small in amplitude but erratically distributed in the geographical space of the region.
Furthermore, Oguntunde et al. (Citation2011) analysed rainfall trends in Nigeria during the 20th century using model-simulated data and detected that about 90% of the entire region exhibited negative (i.e. decreasing) trends in rainfall. Ogungbenro and Morakinyo (Citation2014) investigated rainfall distribution and change detection across various climatic zones in Nigeria. Their results indicated similar change points and transitions from dry to wet in all the climatic zones. In northern Nigeria, Tarhule and Woo (Citation1998) analysed the changes in rainfall characteristics using the Pettitt and Mann-Kendall tests and concluded that an abrupt change occurred in both the time series of annual rainfall and the number of rainy days in the region between 1993 and 1996. A study by Akinsanola and Ogunjobi (Citation2014), who observed the rainfall and temperature variability over Nigeria between 1971 and 2000, indicated an increase in precipitation and air temperature in most parts of Nigeria, especially during the last decade (1991–2000) of the study period.
Judging from the available studies on precipitation trends and drought analysis in the West African region, less attention has been given to other climatic zones when compared to the Sahelian zone (Owusu and Waylen Citation2009). However, this has led to a deficiency in the holistic description of the climatology of the region of which Nigeria is integral. This study intends to give a comprehensive analysis of rainfall and drought over Nigeria in the transition period between the 20th and 21st centuries, which has not been done in previous studies. In Nigeria, over 70% of the populace engage in rain-fed agriculture, thereby making rainfall the most important climatic variable to be studied for agricultural purposes. Thus, the need for continuous rainfall studies cannot be over-stressed for long-term water resources development (Oguntunde et al. Citation2011).
In this study, ground observation data used by Akinsanola and Ogunjobi (Citation2014), which was limited to the year 2000, is extended to the year 2015. Secondly, the statistical approach employed is different and more robust. Also, the satellite data used by Oguntunde et al. (Citation2011) in their study of rainfall variability over Nigeria between 1900 and 2000 is replaced in this study with ground-observed data. The objectives of this study are: (i) to study the rainfall variability and trends at monthly, seasonal and annual time scales using the Mann-Kendall test and linear regression methods; (ii) to consider the impact of auto-correlation on detecting patterns; and (iii) to analyse some drought characteristics in Nigeria between 1981 and 2015.
2 Methodology
2.1 Study area
Nigeria is located between latitudes 4–14ºN and longitudes 2–15ºE on the western coast of Africa. It is bounded by Cameroon, the Niger Republic and the Republic of Benin in the east, north and west, respectively, while the southern part is bounded by the Gulf of Guinea (Akinsanola and Ogunjobi Citation2014). It has a total land mass area of 925, 796 km2 and is divided into the major climatic zones of Sahel, Savanna and Guinea (Ogungbenro and Morakinyo Citation2014). The climate of Nigeria varies markedly from south to north. The south generally receives more annual rainfall, which usually spreads across 8 months (March–October) having its peak in July, while the northern part experiences a shorter rainfall period (May–September). Nigeria is a tropical country with two major distinct seasons: dry and wet. The dry season lasts from November to March and is characterized by low humidity and high temperatures (up to 42ºC in the northern part of the country), because of warm winds from the Sahara Desert, while the wet season is dominated by high humidity and low temperatures (<30ºC), especially during the day time. The strategic location of Nigeria in West Africa gives the country a wide variation in the climate from the coast to the Sahel region in the north.
2.2 Data collection and analysis
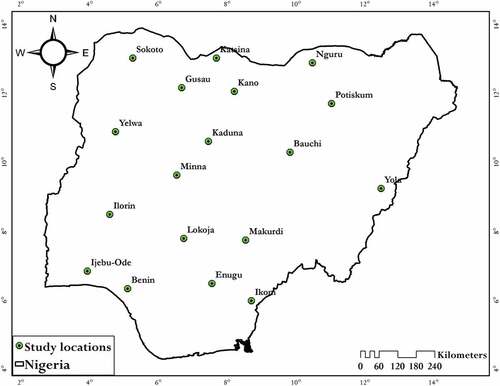
Monthly series of precipitation data (1981–2015) for 18 synoptic stations in Nigeria () were obtained from the Nigeria Meteorological Agency (NIMET). The geographical description of the selected meteorological stations is presented in . The rainfall datasets were tested for homogeneity and randomness before the analysis was done. The quality of precipitation data was controlled using double- mass curve analysis (Kohler Citation1949).
Table 1. List of the meteorological stations used in this study.
Figure 1. Spatial distribution in Nigeria of the 18 synoptic stations studied.
2.2.1 Rainfall variability index
Rainfall variability is usually estimated as an index of the normalized precipitation departure from the mean. It helps to separate the rainfall time series into different climatic regimes, such as extreme dry, dry, normal and wet climatic years. The rainfall variability index (δ) is computed as follows:
where δi is the rainfall variability index for year i; Pi is the annual rainfall for year i; and μ and σ are, respectively, the mean annual rainfall and standard deviation for the period under consideration. The classification of different climatic regimes was done as follows (Gocic and Trajkovic Citation2013):
2.2.2 Aridity index
Gocic and Trajkovic (Citation2013) defined the aridity index as an indicator of the degree of dryness of the climate in a given location. In this work, the UNEP index (UNEP Citation1992) was adopted. According to the proportion of precipitation (P) and potential evapotranspiration (PET), the locations are classified from Hyper-arid to Humid (). The PET was calculated using the FAO-56 Penman-Monteith equation (FAO-56 PM; Allen et al. Citation1998), which is the standard equation for estimating reference evapotranspiration. The following formula was adopted (Allen et al. Citation1998):
Table 2. Aridity classification. P: precipitation; PET: potential evapotranspiration.
where Rn is the net radiation; G is the soil heat flux; (es – ea) represents the vapour pressure deficit of the air; is the mean air density at constant pressure;
is the psychrometric constant; cp is the specific heat of the air;
represents the slope of the saturation vapour pressure–temperature relationship; and rs and ra are, respectively, the (bulk) surface and aerodynamic resistance. The full description of each parameter can be found in Allen et al. (Citation1998) and the aridity classification is shown in .
2.2.3 Standardized precipitation index (SPI)
This study employed the gamma distribution to fit the long-term (1981–2015) rainfall record. The gamma distribution is defined by its probability density function:
where α and β are the shape and scale parameters, respectively; x is the rainfall amount; and Γ(α) is the gamma function.
The resulting parameters are then utilized to derive the cumulative probability for non-zero rainfalls using:
The cumulative probability is changed into a standardized normal distribution so that the SPI mean and variance are zero and one respectively. The approximate transformations proposed by Abramowitz and Stegun (Citation1965) to transform the cumulative probability distribution into a standardized normal distribution are adopted, as follows:
where c0 = 2.515517, c1 = 0.802853, c2 = 0.010328, d1 = 1.432788, d2 = 0.189269 and d3 = 0.001308.
The SPI values are computed for only the 12-month timescale and the SPI threshold ranges used to define drought conditions are described in (McKee et al. Citation1993).
Table 3. Classification of standardized precipitation index, SPI.
2.3 Trend analysis
2.3.1 Mann-Kendall trend test
In this study, the non-parametric rank-based Mann-Kendall (MK) test was used to determine the monotonic trends in rainfall and the SPI dataset. The condition that must be met before the MK test can be conducted is given by:
where is a continuous monotonic increasing or decreasing function of time. The residual,
, can be assumed to be from the same distribution with zero mean. The MK test statistic, S is calculated by:
where n is the length of the time series xi, …, .xn; sgn(∙) is a sign function; and xj and xk are values in year j and k, respectively. The variance of the expected value of S equals zero (E[S] = 0) for series without trend and is given by:
where q is the number of groups tied and tp is the number of data values in group p. Since, in a non-parametric test, no assumption as to the underlying distribution of data is important, the test statistic Z is then calculated as:
The Z statistic is used to test the null hypothesis, H0, that the data is randomly ordered in time, with the alternate hypothesis, H1, indicating an increasing or decreasing monotonic trend. The trend analysis is done on a monthly (April–October) and a seasonal (MAM: March, April and May; JJA: June, July and August; SON: September, October and November) basis.
2.3.2 Autocorrelation/serial correlation analysis
Autocorrelation analysis correlates time series dataset (rainfall and SPI-12) at different time lags (Phillips et al. Citation2008). It is used for checking randomness and finding repeating patterns in a dataset (Oguntunde et al. Citation2011). In this study, the autocorrelation coefficient at lag-1 is computed by:
where Ch is the autocovariance function and is given by:
and C0 is the variance function, which is given by:
where N is the sample size and h is the time lag.
The values of autocorrelation coefficient Rh, which varies between – 1.0 and +1.0 for a dataset, are used to divide the dataset into sections. If the values exhibit a sequence of alternating positive and negative signs and do not reduce to zero, the dataset has a primary sinusoidal (periodic) signal. The more the value tends towards +1.0 or – 1.0, the higher the significance.
2.3.3 Linear regression method
Regression analysis is an important statistical method for analysing hydrological data and has been used in several studies (e.g. Oguntunde et al. Citation2011, Gocic and Trajkovic Citation2013). It enables the identification and characterization of a relationship in single or among multiple factors. Linear regression is the simplest type of regression, which is used for trend analysis (e.g. Oguntunde et al. Citation2011, Gocic and Trajkovic Citation2013). It can be used to estimate the slope of a particular trend which represents the mean temporal change of the variable under consideration. Positive values of the slope indicate an increasing trend, while negative values mean a decreasing trend. In order to estimate the temporal changes in rainfall, the following equation is adopted:
where y is the dependent variable, a is a constant, b is the regression coefficients, x is the independent variable and ε is the error term.
3 Results and discussion
3.1 Summary of descriptive statistics
The descriptive statistics of rainfall for all the 18 synoptic stations are presented in . The rainfall ranged from 417.11 mm year−1 around Nguru in the northeast to over 2722.90 mm year−1 in Ikom in the southern part of Nigeria. Rainfall decreased with increasing latitude, while the coefficient of variation (CV) increased with increasing latitude (). This is due to the fact that rainfall amount and latitude have a negative linear correlation, suggesting that precipitation possesses latitudinal zonality (Liu et al. Citation2008, Oguntunde et al. Citation2011). This observation is similar to that in several published works on rainfall variability in the West African region (Odekunle Citation2004, Logah et al. Citation2013, Akinsanola and Ogunjobi Citation2014, Nnaji et al. Citation2014, Oguntunde et al. Citation2014).
Table 4. Descriptive statistics of yearly precipitation time series at 18 synoptic stations for the period 1981–2015. SD: standard deviation; CV: coefficient of variation.
General observation shows that the CV of rainfall values recorded in the north (Kano: 35.60%, Nguru: 26.37%, Bauchi: 27.87%) are higher than those recorded in the south (Enugu: 14.94%, Ijebu: 16.72% and Ikom: 10.33%). Precipitation varied mostly in Katsina (CV: 36.44%), with precipitation in the range 259.80–1310.20 mm year−1 (mean: 562.47 ± 204.96 mm year−1), while the least variability was observed in Ikom (CV: 10.33%), with precipitation in the range 1783.10–2722 mm year−1 (mean: 2257.23 ± 233.16 mm year−1). The CV increased from about 10% in the southernmost part of Nigeria to over 30% in the northeastern part. The trends observed in this study are similar to the findings of Oguntunde et al. (Citation2011), but negate the findings of Nnaji et al. (Citation2014), who used cluster analysis to study rainfall variability across Nigeria. They discovered that, CV varies more widely in the southern part of the country than in the northern part, which they attributed to the large variation in the annual volume of rainfall recorded. Similar variations apply in other West African countries, such as Ghana, The Gambia and Senegal (Djomou et al. Citation2009, Manzanas et al. Citation2014, Amuzu et al. Citation2018).
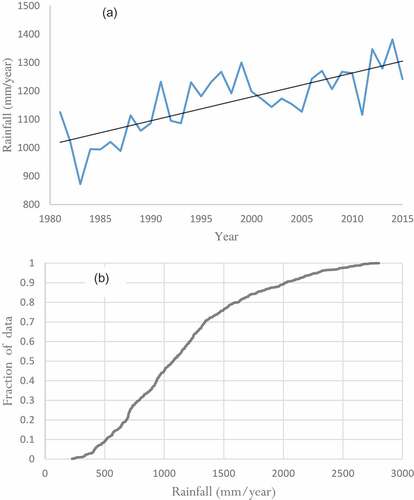
illustrates the temporal distribution and spatial averages of the 35 years (1981–2015) of rainfall assessments plotted as cumulative distribution function (cdf) for rainfall in Nigeria. The temporal pattern shows an increasing trend in rainfall over Nigeria in the last three decades. This is in line with the projection of the Intergovernmental Panel on Climate Change (IPCC Citation2007) that coastal areas (south) will experience more rainfall in the 21st century, which might lead to flooding, while the Sahel region will have more drought occurrences. The cdf is very helpful in setting threshold values below or above occurrence of certain rainfall events. ) shows that about 10% of the entire study locations usually had less than 1000 mm year−1 of rainfall, about 80% of the study area experience between 1000 and 1300 mm year−1, while only 10% (mostly in the south) experienced very heavy rainfall events in excess of 2000 mm year−1.
Figure 2. Distribution of (a) spatial and (b) temporal averages plotted as the cumulative distribution function of 1981–2015 annual rainfall for Nigeria.
3.2 Analysis of precipitation
3.2.1 Annual precipitation time series
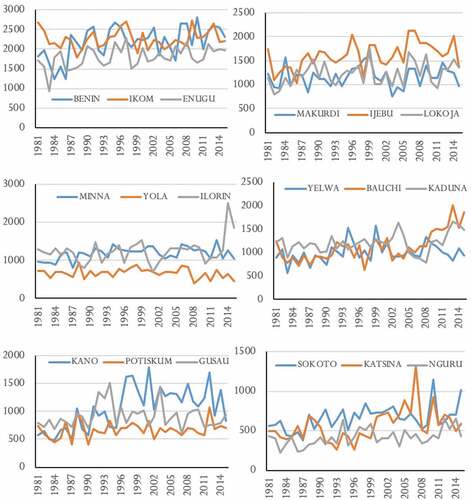
illustrates the time series information of the 18 stations considered in this study. The time series gives simple but first-hand information about each station. It shows clearly the pattern of rainfall on a yearly basis between 1981 and 2015. The results indicate an increasing trend in almost all the stations in the south (Benin, Ijebu and Ikom), while the northern stations (Yola, Bauchi, Nguru etc.) are characterized by a stationary trend. The graphs also show a sharp increase and decrease in rainfall amount in all the stations within some years. For example, at Kano there was a sharp increase from 706 to 1628 mm between 1996 and 1997, and a decrease from 1789 to 1033 mm between 2001 and 2002. This sudden fall and rise in rainfall values usually makes farming activities in Nigeria a difficult task, as most farmers depends on precipitation particularly in the south. Further information indicates dry spells occurring in all the stations. This observation is similar to the findings of other researchers on rainfall studies in Nigeria (e.g. Bibi et al. Citation2014, Ogungbenro and Morakinyo Citation2014, Salau et al. Citation2016). There has always been a connection or association between La Niña and high rainfall in the Sahel/Sudan regions. For instance, Nicholson et al. (Citation1999) gave an overview of West African rainfall conditions as affected by the 1997 El Niño and 1998 La Niña years. The study indicates that the West African climate is characterized by fluctuations; for example, in 1998 the central Sahel had a relatively good rainy season, primarily in Niger, while other regions in the Sahel had relatively dry conditions.
Figure 3. Annual precipitation time series at the 18 synoptic stations studied.
3.2.2 Monthly precipitation trends
The results of the Mann-Kendall test (Zs) on precipitation trends and the coefficient of linear regression at the 5% significance level for April–October between 1981 and 2015 are presented in . Positively significant trends in precipitation were observed in Kano, Bauchi, Katsina, Enugu and Sokoto, while only Yola had a negatively significant trend in July. Kano recorded significantly positive rainfall in July, August and September, with a regression slope (b) value of 6.30, 9.29 and 12.57 mm year−1, respectively. These trends indicate that there are fluctuations in the precipitation pattern all over Nigeria. Most of the changes occurred in the months of April, June, August and September. Similar findings were documented by Oguntunde et al. (Citation2011) on rainfall trends in Nigeria; they noted that trends in the Sahelian region and regions south of 6ºN in the Niger Delta were significant at p < 0.05. Comparative analysis of Zs and b produced similar results in both magnitude and direction. This may partly be due to close lag-1 serial correlation values recorded for most of the stations, as well as the whole data series of Nigeria. Thus, any of the two methods is expected to yield satisfactorily reliable result in the study area.
Table 5. Results of the statistical tests on a monthly basis (April–October) over the period 1981–2015. Values in bold are statistically significant trends at p < 0.05.
3.2.3 Seasonal and annual precipitation trends
Seasonal and annual trends of precipitation using the Mann-Kendall test (Zs) and coefficient of linear regression (b) are presented in . A significantly increasing trend in annual precipitation series was detected in nine of the 18 stations studied (Benin, Yelwa, Kano, Nguru, Kastina, Enugu, Ijebu, Bauchi and Sokoto). On a seasonal basis, during MAM, a significantly increasing precipitation trend was noted in Benin, Lokoja, Yola and Sokoto stations. Only Kano and Nguru stations had a significant trend in precipitation for JJA, while 10 of the 18 stations had significant trend for SON.
Table 6. Statistical tests results on seasonal and annual basis over the period 1981–2015. MAM: March-April-May; JJA: June-July-August; SON: September-October-November. Values in bold are statistically significant trends at p < 0.05.
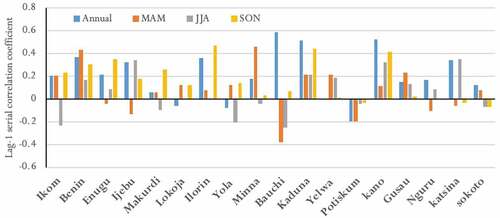
Serial correlation (autocorrelation) plots for the seasonal and annual precipitation at the 18 synoptic stations is presented in . On a seasonal basis, the only negative but significant value recorded is at Bauchi station during MAM. The significant positive values recorded for MAM are 0.43 and 0.46 at Benin and Minna, respectively. For JJA, the values are 0.34 and 0.35 at Ijebu and Katsina stations, respectively, while in SON 0.35, 0.47, 0.44 and 0.41 was recorded for Enugu, Ilorin, Kaduna and Kano, respectively. On an annual basis, significant positive values were recorded at Benin (0.37), Ilorin (0.36), Bauchi (0.59), Kaduna (0.51) and Katsina (0.34). The positive values indicate a correlation between the past and the present values of rainfall data at the stations. This means that present or future rainfall values may be predicted from the past recorded values. For the SON season, unlike during JJA, an insignificant contribution to annual precipitation was recorded in the Sahelian region, as indicated by Nguru, Katsina and Sokoto stations. In the Tropical and Guinean regions – Benin and Kaduna, respectively – the results for all seasons contribute to the prediction possibility of annual precipitation values. However, MAM and SON are predominant in Benin and Kaduna, respectively.
Figure 4. Lag-1 serial correlation for the annual and seasonal precipitation at the synoptic stations.
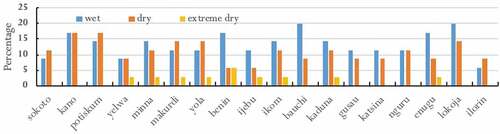
3.3 Rainfall variability
presents the annual rainfall variability indices for the 18 synoptic stations studied, while shows the percentage distribution of the extremely dry, dry and wet years for the period 1981–2015. In agreement with the findings of other researchers (e.g. Oguntunde et al. Citation2011, Bibi et al. Citation2014), rainfall variability in Nigeria is characterized by many fluctuations and could be categorized into phases/periods. Even though this study only considered a climatic age (35 years), it is evident that all the stations had a mixture of both dry and wet years, but the first two decades (1981–2000) witnessed more negative index (δ) values (–0.5 to – 2.5).
Figure 5. Annual rainfall variability indices for the 18 synoptic stations studied.
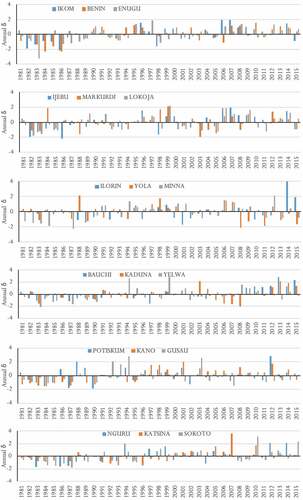
Figure 6. Distribution (%) of extremely dry, dry and wet years for the 18 synoptic stations studied, for the period 1981–2015.
Some major works have identified the role of different climatological and dynamical features of West Africa as being responsible for the drastic changes in rainfall distribution and variability (Omotosho Citation2008, Oluleye Citation2009, Ogungbenro and Morakinyo Citation2014). The dynamics of major factors causing dry periods over the Sahelian zone have also been ascertained in many studies (Nicholson Citation1986, Omotosho Citation2008, Oluleye Citation2009). The role played by the latitudinal location of the African Easterly Jets in the Sahelian zone rainfall production mechanism was also pointed out (Grist and Nicholson Citation2001, Omotosho Citation2008). Rainfall variability in western equatorial Africa have always been linked to the Pacific El Niño and the western Indian Ocean early in the year, but to the Atlantic during the summer or high sunny months (Balas et al. Citation2007).
However, in the remaining one and a half decades (2001–2015), more positive δ values (0–4) were recorded for all the stations. This increase in the wet period may have contributed immensely to some flood occurrences witnessed in the early 21st century (Ogundebi Citation2004, Ikhile Citation2007, Nwafor Citation2007, Umoh Citation2007, Odjugo Citation2010). Some stations, mostly in the Sahel region, e.g. Sokoto, Potiskum, Yelwa and Ilorin, had fairly distributed rainfall variability within the period considered, although some outliers were recorded. Kano experienced a decreasing rainfall trend in the first 15 years (1981–1995) and an increasing trend in most of the remaining two decades (1996–2015). The wettest year recorded is 2014 at Ilorin, while the driest year is 1983 at Enugu station. Further information in shows that all the stations have almost the same dry and wet years. This negates the opinion that only northern Nigeria is susceptible to drought effects (Omonigbo and Okogbue Citation2014).
The percentage of normal years recorded varied from 65% to 86% within the 18 synoptic stations studied. This is an indication that the variability of rainfall within the period considered can be tagged to be normal. However, it does not mean that some extreme climate events, e.g. flood and droughts, will not occur in the near future. The dry years varied from 8.6% to 14.3%, with the peak recorded at both Makurdi and Yola, while the wet years ranged from 5.7% to 20% and the peak (20%) is recorded for Bauchi and Lokoja. The extreme dry period is recorded in Enugu, Kaduna, Benin, Yola, Ikom, Ijebu, Makurdi, Minna and Yelwa but with less than 6% rainfall.
The justification for this variability is not only because we have many climatic zones, with different rainfall amount and a number of rainy days, but also that the rainfall frequency, duration and amount are directed naturally by the movement of the Intertropical Discontinuity (ITD) (Ayanlade et al. Citation2018). The ITD is known as the borderline between two air streams: tropical continental (cT) and tropical maritime (mT). The cT generally has a cool, dry and stable air mass, while mT is characterized with warm and moist air mass. The implications of the ITD movement on the rainfall and drought pattern in Nigeria and West Africa in general have been identified in many studies (Ilesanmi Citation1971, Odekunle et al. Citation2005, Odekunle Citation2006, Ayanlade Citation2009, Abatan et al. Citation2016, Fuwape et al. Citation2017). The spatial and temporal movement of the ITD performs a major role in the spatial variability of rainfall over Nigeria, as well as in other parts of West Africa, with rainfall decreasing from the regions of lower latitude to those of higher latitude. Other mechanisms that influences long-term rainfall variability in West Africa and particularly Nigeria have been linked to the tropical easterly jet (TEJ), the sea-surface temperature anomaly (SSTA), the biogeophysical feedback mechanism, and the El Niño Southern Oscillation (ENSO), making both tropical and extra-tropical factors the overall cause of rainfall irregularity in Nigeria (Bello Citation1998, Olaniran Citation2002, Oguntunde et al. Citation2011).
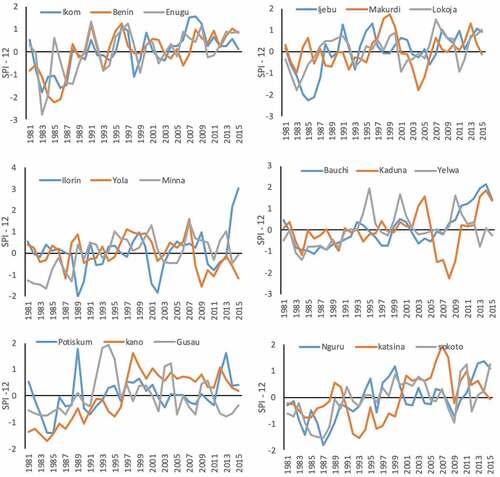
3.4 Drought potential and occurrences in Nigeria
shows the time series of SPI-12 for the 18 synoptic stations for the period 1981–2015. The characteristics of drought at the 12-month time scale is presented in . All the stations recorded a classified type of drought at one or more times for all the stations, with the exception of Gusau. All the severe drought recorded for the 18 stations occurred during the 1980s, with the exception of Makurdi, Yola, Gusau and Kastina, where it occurred in 2004, 2009, 2013 and 1993, respectively. These findings support the work of many researchers who have identified drought periods in Nigeria in the past (Adefolalu Citation1986, Oladipo Citation1993, Olaniran Citation2002, Aremu Citation2011, Akinsanola and Ogunjobi Citation2014). Extreme drought (–2.79) occurred in 1983 at Enugu, while severe droughts were also noticed at Benin and Kaduna stations. The highest number of severe droughts was recorded for Benin, while the highest number of droughts in the broad sense is recorded for Kano. The highest occurrence of Moderate drought (6) was recorded for Kano and the Very Dry drought condition was limited to Ijebu and Ikom. Further analysis shows that, at one time or the other, all the climatic zones in Nigeria experienced drought between 1981 and 2015, which had a drastic effect on the agricultural and water supply sectors.
Table 7. Drought characteristics at 12-month time scale using SPI.
Figure 7. Time series of SPI-12 at the 18 synoptic stations.
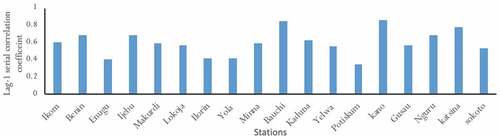
The lag-1 serial correlation coefficient for the SPI-12 across the 18 synoptic stations is presented in . There is no negative lag-1 serial correlation recorded at any station among the 18 stations studied. The highest significantly positive serial correlation coefficient of 0.86 was recorded in Kano. Results for all the stations considered for SPI-12 were significant, unlike similar analysis done on the precipitation dataset. Therefore, historical SPI-12 values for a station can be used for predicting future SPI-12 values.
Figure 8. Lag-1 serial correlation coefficient for the SPI-12 at the 18 synoptic stations.
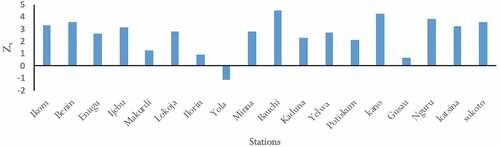
The results of the Mann-Kendall tests for the SPI-12 series are shown in . A decreasing trend was observed at Yola station, while all the other stations experienced an increasing trend. Fourteen (14) stations show a significantly (p ≤ 0.05) increasing trend, unlike the remaining four stations (Gusau, Makurdi, Ilorin and Yola). Stations with significant trends are more likely to witness moderate to severe drought. Hence, government and other stakeholders in the agricultural and water resources sectors are expected to put measures in place in order to mitigate the effects of long-term drought. Measures such as proper sensitization of vulnerable communities, provision of irrigation facilities for farmers, construction of water retention facilities available, e.g. dams, underground storage tanks and maximization of surface water (rivers and streams) should be harnessed.
Figure 9. Mann–Kendall test (ZS) test for the SPI-12 series.
3.5 Aridity index
The aridity index for the 18 synoptic stations is presented in . The results show that the aridity index ranged from 0.18 at Nguru to 2.10 at Ikom. Hence, Nguru is classified Arid, while Ikom falls into Humid classification. This was influenced by the precipitation and ETo values recorded at the two stations. The least ETo (2.94 mm d−1) was recorded in Ikom, while the highest was in Nguru (6.43 mm d−1). All the stations in the south are classified Humid, while the northern stations are categorized into Arid, Semi-arid, Sub-humid and Humid in the ratio of 1:6:3:3, respectively. The ratio shows that northern Nigeria can be regarded as a semi-arid region. Nguru is classified as Arid because of its higher ETo, lower annual rainfall and higher variation in temperature. In line with the general perspective, the ETo for locations in northern Nigeria is higher than in the south. The reason for this is fairly clear: northern Nigeria is usually characterized with high temperatures, wind speed and low relative humidity, especially during the dry season (Ilesanmi et al. Citation2012). The classification of the aridity index shows that northern Nigeria, especially the Sahelian region, will be more prone to drought, while the other climatic zones may be exposed to other extremes, such as flooding.
Table 8. Mean annual precipitation, reference evapotranspiration and aridity index for all 18 synoptic stations.
4 Summary and conclusion
Analysis of the monthly, seasonal and annual precipitation trends, and the variability of aridity and long-term drought behaviour over Nigeria between 1981 and 2015 has been conducted in this study. The drought characteristics of the 18 synoptic stations indicate a major drought episode occurred between 1983 and 1987 and that 1983 and 1984 were dry years. The periods identified fall within the drought episodes recorded by Abubakar and Yamusa (Citation2013) and the Emergency Events Database (EM-DAT). Monthly analysis of precipitation series suggests that all the stations in the south and some in the north experienced increasing trend in rainfall, while stations such as Gusau and Nguru were stationary; however, in general, Nigeria experienced an increasing trend in rainfall amount. This could be attributed to the increase in rainfall amount recorded in the first 15 years (2001–2015) of the 21st century as against the decreased rainfall amount recorded in the last two decades of the 20th century. On the seasonal scale, significant increasing trends were found with Zs in 10, four and two stations for SON, MAM and JJA, respectively, while on the annual time scale, only nine of the 18 stations showed a significant trend. Generally, a significant trend was detected in the SPI-12 series at the 5% significance level for 14 of the 18 stations. The lowest SPI-12 index was detected in 1983 at Enugu.
Previous studies on the analysis of variability and trends of rainfall series show that the country of Nigeria has been drying since the 1970s, with the driest decades in the 20th century between 1970 and 1990. This study shows that the trend has changed drastically, with many stations now witnessing greater annual rainfall in the first 15 years of the 21st century, but with high variability within the rainy months of the year. This may be attributed to the effect of climate change on the climatology of Nigeria. The study by Ayanlade et al. (Citation2018) on rainfall variability and drought characteristics in two agro-climatic zones in Nigeria clearly support this finding.
The change in the pattern of rainfall has led to widespread extreme events, such as drought – recorded in the southern and in north-central parts of Nigeria – and a reduction in the length of the growing season across the country. Such prolonged variability in rainfall may have a significant effect on the groundwater resources and the hydrology of Nigeria. Therefore, it is recommended that farmers should adopt crops that are drought resistant and early maturing especially in the northern region of the country. This can be achieved by improving and developing agricultural technologies that are environmental and drought sensitive. Other adaptive measures for climate include users adjusting their farming calendars for irrigated agriculture according to the changing rainfall period. It is believed that these recommendations among others could help avert the impending food insecurity in Nigeria, particularly as the population has been predicted to double by the year 2050.
However, there is a need to further this research in the aspect of spatial variation of precipitation trends and the integration of climate change to drought analysis. Furthermore, efforts should be geared to developing an information system for monitoring and early detection of drought in Nigeria.
Acknowledgements
The authors express gratitude to Nigerian Meteorological Agency (NIMET) for assisting this research with datasets. We are also indebted to the associate editor, Dr Ian Overton, and the anonymous reviewers for their comments which significantly improved the quality of the manuscript.
Disclosure statement
No potential conflict of interest was reported by the authors.
References
- Abatan, A.A., et al., 2016. Trends in extreme temperature over Nigeria from percentile‐based threshold indices. International Journal of Climatology, 36 (6), 2527–2540. doi:10.1002/joc.4510
- Abramowitz, M. and Stegun, I.A., 1965. Handbook of mathematical functions. Washington, DC: National Bureau of Standards.
- Abubakar, I.U. and Yamusa, M.A., 2013. Recurrence of drought in Nigeria: causes, effects and mitigation. International Journal of Agriculture and Food Science Technology, 4 (3), 169–180.
- Adefolalu, D.O., 1986. Further aspects of Sahelian drought as evidence from rainfall regime of Nigeria. Archives for Meteorology Geophysics Bioclimatology Series B, 36 (3–4), 277–295. doi:10.1007/BF02263134
- Akinsanola, A.A. and Ogunjobi, K.O., 2014. Analysis of rainfall and temperature variability over Nigeria. Global Journal of Human-Social Science: B Geography, Geo-Sciences, Environmental Disaster Management, 14 (3), 1–17.
- Allen, R.G., et al., 1998. Crop evapotranspiration. Guidelines for computing crop water requirements. Irrigation and Drainage Paper 56. Rome, Italy: Food and Agriculture Organization of the United Nations.
- Amuzu, J., et al., 2018. The climate change vulnerability and risk management matrix for the coastal zone of the Gambia. Hydrology Journal, 5 (14). doi:10.3390/hydrology5010014
- Aremu, J.K., 2011. Combating and mitigating drought and desertification in Northern Nigeria. JEHETR Journal of Environment and Earth Sciences, 1 (2), 1–6.
- Ayanlade, A., 2009. Seasonal rainfall variability in Guinea savanna part of Nigeria: a GIS approach. International Journal of Climate Change and Strategies Management, 1 (3), 282–296. doi:10.1108/17568690910977492
- Ayanlade, A., et al., 2018. Rainfall variability and drought characteristics in two agro-climatic zones: an assessment of climate change challenges in Africa. Science of the Total Environment, 630 (2018), 728–737. doi:10.1016/j.scitotenv.2018.02.196
- Balas, N., Nicholson, S.E., and Klotter, D., 2007. The relationship of rainfall variability in west central Africa to sea-surface temperature fluctuations. International Journal of Climatology, 27 (10), 1335–1349. doi:10.1002/(ISSN)1097-0088
- Bello, N.J., 1998. A study of evidence of climate change based on rainfall seasonality and the reliability of rainfall regime in Nigeria. Proceedings Sustained Africa, 4, 30–32.
- Bibi, U.M., Kaduk, J., and Balzter, H., 2014. Spatial-temporal variation and prediction of rainfall in northeastern Nigeria. Climate, 2, 206–222. doi:10.3390/cli2030206
- Cannarozzo, M., Noto, L.V., and Viola, F., 2006. Spatial distribution of rainfall trends in Sicily (1921–2000). Physics and Chemistry of the Earth, 31 (18), 1201–1211. doi:10.1016/j.pce.2006.03.022
- Djomou, Z.Y., Monkam, D., and Lenouo, A., 2009. Spatial variability of rainfall regions in West Africa during the 20th century. Journal of the Royal Meteorological Society - Atmospheric Science Letters, 10, 9–13.
- Fauchereau, N., et al., 2003. Rainfall variability and changes in southern Africa during the 20th century in the global warming context. Natural Hazards, 29, 139–154. doi:10.1023/A:1023630924100
- Fuwape, I., et al., 2017. Spatial variation of deterministic chaos in mean daily temperature and rainfall over Nigeria. Theoretical and Applied Climatology, 130 (1), 119–132.. doi:10.1007/s00704-016-1867-x
- Gemmer, M., Becker, S., and Jiang, T., 2004. Observed monthly precipitation trends in China 1951–2002. Theoretical and Applied Climatology, 77 (1–2), 39–45. doi:10.1007/s00704-003-0018-3
- Gocic, M. and Trajkovic, S., 2013. Analysis of changes in meteorological variables using Mann-Kendall and Sen’s slope estimator statistical tests in Serbia. Global Planetary Change, 100 (100), 172–182. doi:10.1016/j.gloplacha.2012.10.014
- Grist, J.B. and Nicholson, S.E., 2001. A study of dynamic factors influencing the inter-annual variability of rainfall in the West Africa Sahelian zone. Journal of Climate, 14 (7), 1337–1359. doi:10.1175/1520-0442(2001)014<1337:ASOTDF>2.0.CO;2
- Hisdal, H., et al., 2001. Have streamflow droughts in Europe become more severe or frequent? International. Journal of Climatology, 21 (3), 317–333. doi:10.1002/joc.619
- Ikhile, C.I., 2007. Impacts of climate variability and change on the hydrology and water resources of the Benin-Owena River Basin. Thesis (PhD) submitted to the Department of Geography and Regional Planning. University of Benin, Benin City, Nigeria.
- Ilesanmi, O.A., Oguntunde, P.G., and Olufayo, A.A., 2012. Re-examination of the BMN model for estimating evapotranspiration. International Journal of Agriculture and Forestry, 2 (6), 268–272. doi:10.5923/j.ijaf.20120206.01
- Ilesanmi, O.O., 1971. An empirical formulation of an ITD rainfall model for the tropics: a case study of Nigeria. Journal of Applied Meteorology, 10 (5), 882–891. doi:10.1175/1520-0450(1971)010<0882:AEFOAI>2.0.CO;2
- IPCC (Intergovernmental Panel on Climate Change), 2007. Climate change and world food security: a new assessment. Global Environmental Change, 9, S51–S67.
- Jahangir, A.T.M., Sayedur, R.M., and Saadat, A.H.M., 2013. Gamma distribution and its application of spatially monitoring meteorological drought in Barind, Bangladesh. International Journal of Geomatics and Geosciences, 3, 511–524.
- Khalili, D., et al., 2011. Comparability analyses of the SPI and RDI meteorological drought indices in different climatic zones. Water Resource Management, 25 (6), 1737–1757. doi:10.1007/s11269-010-9772-z
- Kohler, M.A., 1949. Double-mass analysis for testing the consistency of records and for making adjustments. Bulletin of the American Meteorological Society, 30 (5), 188–189. doi:10.1175/1520-0477-30.5.188
- Le Barbe, L., Lebel, T., and Tapsoba, D., 2002. Rainfall variability in West Africa during the years 1950–90. Journal of Climate, 15, 187–202. doi:10.1175/1520-0442(2002)015<0187:RVIWAD>2.0.CO;2
- Liu, Q., Yang, Z., and Cui, B., 2008. Spatial and temporal variability of annual precipitation during 1961–2006 in Yellow River Basin, China. Journal of Hydrology, 361 (3–4), 330–338. doi:10.1016/j.jhydrol.2008.08.002
- Logah, F.Y., et al., 2013. Analysis of rainfall variability in Ghana. International Journal of Latest Research in Engineering and Computing (IJLREC), 1 (1), 1–8.
- Maidment, R.I., Allan, R.P., and Black, E., 2015. Recent observed and simulated changes in precipitation over Africa. Geophysical Research Letters, 42, 8155–8164. doi:10.1002/2015GL065765
- Manzanas, R., et al., 2014. Precipitation variability and trends in Ghana: an intercomparison of observational and reanalysis products. Climatic Change, 124, 805–819. doi:10.1007/s10584-014-1100-9
- McKee, T.B., Doesken, N.J., and Kleist, J., 1993. The relationship of drought frequency and duration to time scales. In: 8th Conference on Applied Climatology, 17–22 January Anaheim, California, 179–184.
- Mishra, A.K. and Singh, V.P., 2010. A review of drought concepts. Journal of Hydrology, 354 (1–2), 202–216. doi:10.1016/j.jhydrol.2010.07.012
- Moreira, E.E., et al., 2008. SPI-based drought category prediction using loglinear models. Journal of Hydrology, 354, 116–130. doi:10.1016/j.jhydrol.2008.03.002
- Morid, S., Smakhtin, V., and Bagherzadeh, K., 2007. Drought forecasting using artificial neural networks and networks and time series of drought indices. International Journal of Climatology, 27, 2103–2111. doi:10.1002/joc.1498
- NCDC (National Climatic Data Center), 2010. Global surface summary of the day (GSOD). Washington, DC: NESDIS, NOAA, US Department of Commerce. Available from: http://www.data.gov/geodata/g600037
- Nicholson, S.E., 1986. The spatial coherence of African rainfall anomalies: inter-hemispheric teleconnections. Journal of Climatology and Applied Meteorology, 25, 1365–1381. doi:10.1175/1520-0450(1986)025<1365:TSCOAR>2.0.CO;2
- Nicholson, S.E., Some, B., and Kone, B., 1999. An analysis of recent rainfall conditions in West Africa, including the rainy seasons of the 1997 El Niño and the 1998 La Niña years. Journal of Climate, 13, 2628–2640. doi:10.1175/1520-0442(2000)013<2628:AAORRC>2.0.CO;2
- Nnaji, C.C., Mama, C.N., and Ukpabi, O., 2014. Hierarchical analysis of rainfall variability across Nigeria. Theoretical and Applied Climatology, 123, 171–184. doi:10.1007/s00704-014-1348-z
- Nwafor, J.C., 2007. Global climate change: the driver of multiple causes of flood intensity in Sub-Saharan Africa. In: Paper presented at the International Conference on Climate Change and Economic Sustainability held at Nnamdi Azikiwe University, 12–14 June 2007 Enugu, Nigeria.
- Odekunle, T., Balogun, E., and Ogunkoya, O., 2005. On the prediction of rainfall onset and retreat dates in Nigeria. Theoretical and Applied Climatology, 81, 101–112. doi:10.1007/s00704-004-0108-x
- Odekunle, T.O., 2004. Rainfall and the length of the growing season in Nigeria. International Journal of Climatology, 24, 467–479. doi:10.1002/(ISSN)1097-0088
- Odekunle, T.O., 2006. Determining rainy season onset and retreat over Nigeria from precipitation amount and number of rainy days. Theoretical and Applied Climatology, 83, 193–201. doi:10.1007/s00704-005-0166-8
- Odjugo, P.A., 2010. General overview of climate change impacts in Nigeria. Journal of Human Ecology, 29 (1), 47–55. doi:10.1080/09709274.2010.11906248
- Ogundebi, A.O., 2004. Socio-economic impacts of flooding in Lagos State. Environmental Impact Analysis, 12 (1), 16–30.
- Ogungbenro, S.B. and Morakinyo, T.E., 2014. Rainfall distribution and change detection across climatic zones in Nigeria. Journal of Weather and Climate Extremes, 5–6 (2014), 1–6. doi:10.1016/j.wace.2014.10.002
- Oguntunde, P.G., et al., 2014. Analysis of spatial and temporal patterns in onset, cessation and length of growing season in Nigeria. Agric for Meteorol, 194, 77–87. doi:10.1016/j.agrformet.2014.03.017
- Oguntunde, P.G., Abiodun, B.J., and Lischeid, G., 2011. Rainfall trends in Nigeria, 1901–2000. Journal of Hydrology, 411 (3–4), 207–218. doi:10.1016/j.jhydrol.2011.09.037
- Oguntunde, P.G., Lischeid, G., and Abiodun, B.J., 2017. Impact of climate variability and change on drought characteristics in the Niger River Basin, West Africa. Journal of Stochastic Environmental Research and Risk Assessment. doi:10.1007/s00477-017-1484-y
- Oladipo, E., 1993. Drought in Northern Nigeria: an indication of abrupt climatic change? Weather and Climate, 13, 34–39. doi:10.2307/44279847
- Olaniran, O.J. 2002. Rainfall Anomalies in Nigeria: the contemporary understanding. The 55th Inaugural Lecture. Nigeria: University of Ilorin, 55. (Unpublished).
- Oluleye, A., 2009. Change detection in rainfall anomalies across climatic zones in Nigeria. Journal of Meteorology and Climate Science, 7, 6–10.
- Omonigbo, T.O. and Okogbue, E.C., 2014. Trend analysis of drought in the Guinea and Sudano-Sahelian climatic zones of Northern Nigeria (1907–2006). Atmospheric and Climate Sciences, 2014 (4), 483–507. doi:10.4236/acs.2014.44045
- Omotosho, J.B., 2008. Pre‐rainy season moisture build‐up and storm precipitation delivery in the West African Sahel. International Journal of Climatology, 28 (7), 937–946. doi:10.1002/(ISSN)1097-0088
- Owusu, K. and Waylen, P., 2009. Trends in spatio-temporal variability in annual rainfall in Ghana (1951–2000). Weather, 64 (5), 115–120. doi:10.1002/wea.255
- Partal, T. and Kahya, E., 2006. Trend analysis in Turkish precipitation data. Hydrological Processes, 20 (9), 2011–2026. doi:10.1002/(ISSN)1099-1085
- Phillips, C.L., Parr, J.M., and Riskin, E.A., 2008. Signals, systems and transforms. 4th ed. Upper Saddle River, NJ: Prentice-Hall.
- Salau, O.R., et al., 2016. Effects of changes in ENSO on seasonal mean temperature and rainfall in Nigeria. Climate, 4 (1), 5. doi:10.3390/cli4010005
- Shahid, S., 2008. Spatial and temporal characteristics of droughts in the western part of Bangladesh. Hydrological Processes, 22 (13), 2235–2247. doi:10.1002/(ISSN)1099-1085
- Tabari, H., et al., 2012. Temporal trends and spatial characteristics of drought and rainfall in arid and semiarid regions of Iran. Hydrological Processes, 26 (22), 3351–3361. doi:10.1002/hyp.8460
- Tarhule, A. and Woo, K., 1998. changes in rainfall characteristics in northern Nigeria. International Journal of Climatology, 18, 1261–1271. doi:10.1002/(ISSN)1097-0088
- Umoh, E., 2007. Flooding problems in Rivers state. Journal of Environmental Science, 4 (2), 44–60.
- UNEP (United Nations Environmental Programme), 1992. World atlas of desertification. New York, NY: United Nations.
- Wilhite, D.A., 2005. Drought policy and preparedness: the Australian experience in an international context. In: L.C. Botterill and D. Wilhite, eds. From disaster response to risk management: Australia’s national drought policy. Dordrecht, The Netherlands: Springer, 157–176.
- Zargar, A., et al., 2011. A review of drought indices. Environmental Review, 19, 333–349. doi:10.1139/A11-013