
 ?Mathematical formulae have been encoded as MathML and are displayed in this HTML version using MathJax in order to improve their display. Uncheck the box to turn MathJax off. This feature requires Javascript. Click on a formula to zoom.
ABSTRACT
A forecasting model is developed using a hybrid approach of artificial neural network (ANN) and multiple regression analysis (MRA) to predict the total typhoon rainfall and groundwater-level change in the Zhuoshui River basin. We used information from the raingauge stations in eastern Taiwan and open source typhoon data to build the ANN model for forecasting the total rainfall and the groundwater level during a typhoon event; then we revised the predictive values using MRA. As a result, the average accuracy improved up to 80% when the hybrid model of ANN and MRA was applied, even where insufficient data were available for model training. The outcome of this research can be applied to forecasts of total rainfall and groundwater-level change before a typhoon event reaches the Zhuoshui River basin once the typhoon has made landfall on the east coast of Taiwan.
Editor S. Archfield; Associate Editor F.-J. Chang
1 Introduction
Although the annual rainfall in Taiwan is 2.6-fold higher than the world’s average, the steep slopes and jet streams created by the varied terrain, as well as the uneven spatio-temporal rainfall distribution over the island, have led to water storage issues in Taiwan. Moreover, the high population density in Taiwan significantly decreases the available water usage per person. In fact, the average water usage per person per year is only one seventh of the world’s average. Consequently, Taiwan is still listed as a water shortage area by the United Nation (UN), even with its abundant rainfall.
The rainfall in central and southern Taiwan concentrates only during the typhoon season from May to October each year, and thus is the most severe water shortage area in Taiwan. Although the typhoons usually relieve the water shortage issues, such events could also be disastrous. Summing up, building a typhoon rainfall and groundwater-level forecasting model allows predictions of the total rainfall and groundwater level before the typhoon invasion, and thus helps in disaster risk analysis and better utilization of groundwater resources.
Research applying artificial neural networks (ANN) have flourished in recent years. Many hydrological factors that were hard to predict can be forecast today using ANNs. For instance, forecasts of the rainfall–runoff process using ANNs has been presented in previous studies: Minns and Hall (Citation1996) developed a rainfall–runoff forecasting ANN model using a back-propagation neural network (BPNN); Sarkar and Kumar (Citation2012) applied an ANN to event-based rainfall–runoff modelling and the result indicated that ANN models are able to represent an event-based rainfall–runoff process with sufficient reliability; Mishra et al. (Citation2014) examined various approaches of ANN for hydrological modelling, and suggested that BPNN is suitable to use in hydrological forecasting ANN models; and Gupta et al. (Citation2008) carried out time series data mining in rainfall forecasting using ANN, and proposed that the two-hidden layer model was optimum to forecast the next year rainfall data using the current rainfall and discharge data as inputs.
In Taiwan, forecasting of hydrological factors using ANNs has been focused on typhoon events. For example, ANNs have been applied to building a forecasting model using meteorological information and data collected by a tide station to estimate tidal variation during typhoon events (Tseng et al. Citation2007, Chen Citation2010) and compare the performance of a static-feedforward and a dynamic-feedback neural network for rainfall–runoff modelling (Chiang et al. Citation2004). For typhoon rainfall estimation, many studies on building real-time forecasting models with ANNs applied the BPNN approach (e.g. Wang Citation2007a). Most of the studies combine two different types of ANN: either the self-organizing map (SOM) and multiple perceptron network (Lin and Wu Citation2009), or the multi-objective genetic algorithm and support vector machine (Jhong and Lin Citation2013), to optimize the forecasting models. However, some researchers compared the output values of the next hour precipitation from the same model under three scenarios, which used the typhoon data, the raingauge station data and the typhoon and raingauge station data as the inputs, respectively (Cheng et al. Citation2013).
Among the reviewed studies, only one research work was found on typhoon total rainfall forecasting using the advance direction, the wind direction, the strength, and the location of the typhoon event to predict the typhoon rainfall with case-based reasoning of the Euclidean distance and weight similarity (Chen et al. Citation2006); this study then compares the results with the historical typhoon data and uses regression analysis to infer rainfall with the atmospheric pressure. The results of the rainfall forecast reach 70–75% accuracy.
Groundwater modelling is another well-known ANN application due to its ability to solve highly nonlinear problems of this technique. Daliakopoulos et al. (Citation2005) investigated the model prediction efficiency and accuracy in groundwater-level forecasting of seven different types of network structure and training algorithms in ANN models. Consequently, a standard feedforward neural network trained with the Levenberg-Marquardt algorithm provided the best results of accurate groundwater-level predictions for up to 18-month-ahead forecasts (Daliakopoulos et al. Citation2005). Yang et al. (Citation2008) applied the ANN model with BPNN for groundwater-level prediction using a case study in western Jilin Province, China, where groundwater levels have declined significantly due to overexploitation. Lin (Citation2008) combined BPNN and SOM to build a groundwater-level forecasting model and then used the data of a groundwater-level gauge station in the affected area, chosen by the kriging semi-variogram theory, as the input data. Hsu et al. (Citation2009) compared the predictive accuracy of three different types of ANN model, including BPNN, the radial basis function neural network (RBFNN) and the recurrent neural network (RNN). Mayilvaganan and Naidu (Citation2011) and Chitsazan et al. (Citation2015) applied feedforward ANN models to predict groundwater level in a hard rock region and a plain, respectively. The results in both studies show groundwater prediction with satisfactory, high accuracy.
In this study, we built an ANN forecasting model with the BPNN technique and used information from raingauge stations in eastern Taiwan, as well as the accessible typhoon data collected by Central Weather Bureau, in order to forecast the total rainfall and the groundwater-level change during a typhoon event. Then we selected the forecast target stations, the input factors and carried out the model training, validation and testing procedures for the rainfall and groundwater-level ANN models, respectively. Afterwards, we applied revision of the predictive values using the multiple regression analysis technique and improved the model performance in predictive accuracy (). The application of multiple regression analysis (MRA) to revise the results from BPNN has not been adopted in typhoon impact forecasting in a real-time mode that may predict the total rainfall and groundwater-level change before a typhoon event reaches the target station after the typhoon has landed on the east coast. This study shows that the proposed hybrid approach combing BPNN and MRA can significantly increase the accuracy of the BPNN, especially when insufficient data are available for model training, and thus forecast the impacts on rainfall and groundwater-level change brought by a typhoon event.
Figure 1. Flowchart of model development procedure.
2 Methodology
2.1 Back-Propagation Neural Network (BPNN)
The BPNN is generally considered to be the neural network with multiple perceptron as the structure and error back-propagation as the learning algorithm. The network is a multi-layer feedforward network, which can be divided into an input layer, a hidden layer and an output layer. Data are transported from the input layer, weighted by the links and neurons and then produce predictive values in the output layer. During the training period, the forward-propagated signal and the back-propagated error help the network revise the weight and the threshold value, in order to make the error between the actual value and predictive value get close to the training purpose.
In the BPNN, the input value of neuron j in layer n is the output value of the neurons in layer n – 1; the nonlinear function can be shown as (McClelland and Rumelhart Citation1986):
where is the output value of the neuron j in layer n,
is the activation function,
is the weight in the link between the neuron j in layer n and neuron i in layer n – 1 and
is the weight accumulation value in layer n – 1, which is given by:
where is the threshold value of the neuron j in layer n. Because BPNNs belong to supervised learning, the learning purpose is to reduce the error between the predictive value and the actual value; then, the error function is defined as:
where is the target value of neuron k and
is the output value of neuron k.
2.2 Multiple regression analysis (MRA)
The multiple linear regression model describes the relationship between the dependent variable (y) and several independent variables ; the basic form of a general multiple linear regression model is shown as:
From Equation (4), y is viewed as a linear function of x. The error is assumed as the independent random error with the normal distribution of zero mean and standard deviation
, i.e.
, which shows the disparity between the estimated y value and the real y value for each trial i.
3 Application
The typhoons that invade Taiwan are usually classified into nine groups depending on their invasion path. In , the nine types of typhoon invasion path are indicated by arrows with the corresponding path number. By considering the effects of the Central Mountain Range on typhoons, we initially took the typhoons that invade and land on Taiwan Island via east-to-west paths, i.e. invasion paths 2, 3 and 4, and discussed their impacts on the precipitation and groundwater level in the Zhuoshui River basin. However, typhoons with Path 4 were found to contribute greatly to precipitation in the river basins in southern Taiwan rather than to the Zhuoshui River basin. In other words, Path 4 typhoons did not affect the Zhuoshui River basin significantly. Consequently, in this study, data for Path 2 and 3 typhoons () for the period 1990–2012 are collected. The input data were picked up manually by referencing previous studies, including Wang (Citation2007b) and Lin and Hsu (Citation1988). Then, we built an ANN model for each of the target stations, which are six raingauge stations and 17 groundwater-level gauge stations, to predict, respectively, the total rainfall depth (the accumulated rainfall from beginning to end of a typhoon) and the groundwater level, which was chosen as the maximum level recorded within 5 days after the landing of a typhoon event, during a typhoon event along the Zhuoshui River. Afterwards, we revised the predicted values with MRA and proposed a hybrid approach of artificial neural network and multiple regression to forecast the total rainfall and groundwater level during typhoon events ().
Figure 2. Nine invasion paths of typhoons that invade Taiwan.
3.1 Study area
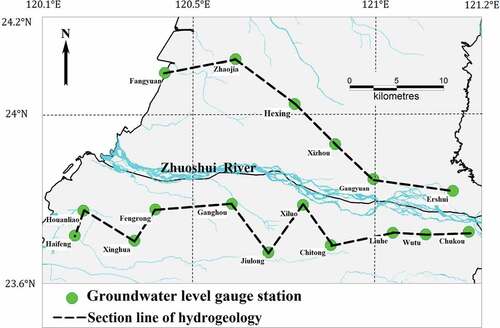
The Zhuoshui River is located in the central and southern part of Taiwan with a drainage area about 3156 km2. The total length of Zhuoshui River is about 186.6 km and the average annual runoff is 6095 × 106 m3. The Zhuoshui River basin has a rugged topography, with slope decreasing from east to west; thus the annual rainfall decreases from 4000 to 1500 mm from the eastern mountain area to the western plain. In addition to the uneven spatial distribution, the rainfall distribution shows a strong seasonal trend in the drainage basin. Specifically, the rainfall from May to October accounts for 75% of rainfall for the whole year. For data collection, we selected 23 raingauge stations and 17 groundwater-level gauge stations. The raingauge stations are located in the Zhuoshui River basin below 100 m a.s.l. elevation () and the groundwater-level gauge stations are located along two section lines of hydrogeology near the Zhuoshui River, as shown in .
Figure 3. Raingauge stations in the Zhuoshui River basin.
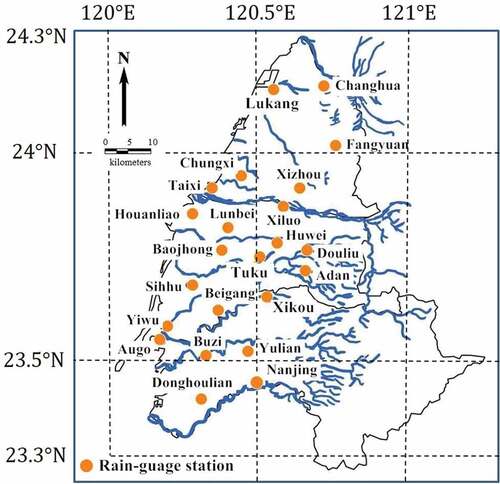
Figure 4. Groundwater-level gauge stations and the hydrogeological section lines in the Zhuoshui River basin.
3.2 Typhoon rainfall forecasting model
3.2.1 Data collection, forecast target and input variable selection
We collected the necessary data from the website of the Central Weather BureauFootnote1 and classified it into two types: typhoon characteristic data and raingauge station characteristic data. For typhoon characteristic data, monitored information of 23 typhoon events: nine Path 2 and 14 Path 3 typhoon events for the period 1990–2012, was collected. As shown in , the collected information includes the typhoon name, path, central pressure, wind speed at the typhoon centre, radius of the 7th-grade storm, radius of the 10th-grade storm, moving speed and strength before landing, as well as rainfall in the eastern raingauge station, which is the total rainfall from the announcement of offshore typhoon warning to landing of the typhoon event.
Table 1. Typhoon characteristic data.
For raingauge station characteristic data, we collected monitored data from 23 raingauge stations, 17 of which are located in the Zhuoshui River basin and six in Chiayi County. The forecast targets of the typhoon rainfall ANN models are six raingauge stations selected from the 23 stations because they are located near the river; these are Taixi, Chungxi, Xichou, Houanliao, Lunbei and Xiluo stations. shows the coordinates and elevation of the target stations.
Table 2. Location and elevation of the target raingauge stations.
Because the proposed model was presumed as a “real-time forecast model”, the potential input variables were first considered from the literature (Lin and Hsu Citation1988, Wang Citation2007b) and then selected based on the availability of the measurement when a typhoon passes the gauge station. Since our forecast target is the total rainfall depth during a typhoon event for each target station, many of the characteristic data of raingauge stations that only affect short-time rainfall properties used by Wang (Citation2007b) are not applicable. In addition, variables that fluctuate too much or too little during a typhoon event, such as wind speed and wind direction both at high altitude and above the ground and temperature and pressure, were excluded in the selected input variables based on preliminary results. Consequently, a total of nine input variables were selected for the input factors of the typhoon rainfall ANN model; seven of them belong to the typhoon characteristic data () and two of them are the raingauge station characteristic data. The typhoon characteristic input variables include central pressure, wind speed at typhoon centre, radius of the 7th-grade storm, radius of the 10th-grade storm, moving speed and strength before landing and rainfall in the eastern raingauge station. The data of rainfall in the eastern raingauge station was collected from Wuta station in Yilan County for typhoon Path 2 and from Beibu station in Hualien County for Path 3. Two factors related to raingauge stations were selected as the raingauge characteristic input variables, which are the elevation of the station and the distance between the station and the typhoon eye before the landing of the typhoon (Tseng et al. Citation2007).
3.2.2 ANN model development
Since the six target stations chosen for the typhoon rainfall forecasting model are located along the Zhuoshui River and below 100 m, we used data from the gauge stations below 100 m to build the model. The numbers of the neural nodes in the first and second hidden layers and the numbers of the training, validation and testing data for each of the ANN rainfall forecasting models corresponding to a specific target station are summarized in . Because the available data are limited, the data used for model training, validation and testing are from the same dataset as the 23 typhoon events recorded at the 23 raingauge stations. However, the available data were first grouped into training, validation and testing datasets, so that the data use was not duplicated.
Table 3. Numbers of hidden layer neural nodes and data used for construction of the ANN rainfall forecasting models.
For model training, we used the characteristic data of the 23 typhoon events of paths 2 and 3 from 1990–2012 recorded at the raingauge stations located in Chunghua, Yulin and Chiayi County. Specifically, the training data are composed of: (a) the 23 typhoon event data collected at the 17 non-target gauge stations; and (b) the data of the typhoon events with less than 100 mm rainfall collected at the six target gauge stations. To develop the ANN model, the choice of ANN parameter sets was determined based on the constructive algorithm (Kwok and Yeung Citation1997) in which each of the potential parameter sets was tested and the one that gave the best performance was selected. As a result, we used the iteration number of 1000, maximum training trials of 20000; then applied the training algorithm of “transig” from the input layer to the hidden layer and “purelin” from the hidden layer to the output layer and the training function of “trainlm”. The optimal ANN structure for each target station was determined by trial-and-error method with limited neural nodes in the hidden layers to prevent overtraining. Specifically, for each target station, the corresponding ANN structure includes nine neural nodes of input variables and two hidden layers.
The validation data for the six target stations were selected as the six non-target stations located in Chiayi County (Xikou, Augo, Yulian, Buzi, Donghouliao and Nanjing) during four typhoon events, which are Sinlaku, Jangmi, Morakot and Saola. The two typhoon events Sinlaku and Jangmi were selected randomly for model validation from different rainfall depth levels, and are Type A and Type B typhoons, respectively. The selection of Morakot and Saola typhoons was based on the significant disaster impacts of the two events to Taiwan. For model testing, the data were selected randomly from the typhoon events of the three different rainfall levels (rainfall depth of Type A: 100–200 mm, Type B: 200–300 mm and Type C: >300 mm) for each of the six target stations.
3.2.3 Model revision using multiple regression analysis
Revision of the predictive values was applied using the MRA technique. Through MRA, a linear equation can be built to describe the statistical relationship between the dependent variable and its affecting factors, which are usually set as independent variables. In this study, the dependent variable was the measured total rainfall in typhoon events and the independent variables were chosen as the output rainfall value of the ANN model, eastern rainfall, moving speed and distance between typhoon and the station. That is to say, the revision of the ANN model was done by using the predicted values from the ANN model as one of the input factors (independent variables) in the MR model, along with other input factors, in order to generate the forecasted total rainfall in typhoon events with a higher accuracy. Therefore the predicted rainfall from the ANN model can be revised by the MR model.
3.3 Groundwater-level forecasting model
3.3.1 Forecast target and input variable selection
The main purpose for groundwater-level forecast model is to predict the impact of a typhoon event on the groundwater-level change in the Zhuoshui River basin once the typhoon lands on the east coast of Taiwan. We built the corresponding ANN model for each groundwater-level gauge station chosen as the forecast target and forecasted the groundwater-level change during a typhoon event using the typhoon and raingauge characteristic data collected before the typhoon landing. A total of 17 groundwater-level gauge stations along the two hydrogeological section lines were used as the forecast targets. In , the groundwater-level gauge stations are classified into two types. Specifically, Zhaojia, Fangyuan, Fengrong, Houanliao and Haifeng belong to the second aquifer of the Zhuoshui River basin, which is a confined aquifer; the other gauge stations belong to the first aquifer of the basin, which is an unconfined aquifer. Following the same procedure as the rainfall forecasting model construction and revision, we predicted the groundwater level after a typhoon event with the ANN model and then revised the forecasting results using the multiple regression analysis.
For the input variables, we followed the selection principles that were used in the typhoon rainfall model; however, the rainfall in the eastern raingauge station was replaced by the measured groundwater level before the typhoons landing. Therefore the input variables for the groundwater-level forecasting ANN model are typhoon characteristic data (central pressure, wind speed at typhoon centre, radius of the 7th-grade and 10th-grade storms, and moving speed, strength and the measured groundwater level before landing of typhoons) and raingauge characteristic data (station elevation and distance between station and typhoon eye before the its landing).
3.3.2 Training, validation and revision of the model
The numbers of the neural nodes in the first and second hidden layers and the numbers of the training, validating and testing data for each of the ANN groundwater-level forecasting models corresponding to a specific target station are summarized in . For each of the groundwater-level ANN models with a selected target station, the data from the groundwater-level gauge stations other than the target station were used for training. The training results show that there are, respectively, 16–17 and three neural nodes in the first and second hidden layers for the groundwater-level ANN models. For the validation data, the groundwater-level gauge stations defined by the two hydrogeological section lines and belonging to the first aquifer, i.e. Shiliu and Tiazhong, were applied.
Table 4. Numbers of hidden layer neural nodes and data used for construction of the ANN groundwater-level forecasting models.
The revision of the groundwater-level forecasting ANN model was done by the MRA, which finds out the statistical relationship between the dependent and independent variables and shows as a regression model. In the regression model, we chose the measured groundwater level after the typhoon events as the dependent variable and the output groundwater-level value of the ANN model, rainfall in the eastern raingauge station, the typhoon’s moving speed and the distance between a typhoon and the station as the independent variables. Therefore the predicted groundwater-level data by the ANN model would be revised by the multiple regression model.
4 Results and discussion
4.1 Rainfall forecasting
The ANN rainfall forecasting model was tested by using the data of the target gauge stations for which the rainfall measurements exceeded 100 mm during the typhoon events. The results of the forecasting model are shown in . To show the accuracy, effectiveness and error analysis of the forecasting model built with ANN (BPNN) and the model revised with MRA, we adopted two evaluating criteria as shown in the following. The accuracy of the predicted rainfall values () were calculated as:
Table 5. Results of rainfall forecasting. M: measured rainfall; F: forecast rainfall; Rev.: rainfall after revision.
where is the error of rainfall prediction,
is the predicted rainfall and
is the measured rainfall. shows the accuracy of the rainfall forecasting model before and after the revision for each type of typhoon event.
Table 6. Accuracy of the rainfall forecasting before and after revision of the model.
From , a smaller number of typhoon events was classified as Type C in each target raingauge station. The results show that no matter whether the forecasting was overestimated or underestimated, the deviations of the forecasting in cases of Type C were higher than those for the other typhoon types. Specifically, if the rainfall was more than 350 mm, the ANN model tended to underestimate the rainfall, which could be improved by the multiple regression revision.
From , the accuracy for Type A cases before the revision are generally lower than those of the other two cases while Type B and Type C cases have similar overall accuracy before the revision. For all of the three typhoon types, most of the accuracy of the forecasted rainfall values were decreased following model revision by MRA. Among these, Type A events show the most significant improvement in accuracy, with the maximum improved percentage of 29% (Xiluo station). Overall, the model accuracy after revision is similar among different types of cases and typhoons and the highest accuracy after revision, 93%, occurs in the Type B cases in Xiluo station. The highest accuracy after revision for Type C events, which belong to extreme typhoon events, reached 92% in Houanliao station.
4.2 Groundwater-level forecasting
The two hydrogeological section lines () are defined as Line 1 and Line 2 and are located on the northern and southern sides of the Zhuoshui River, respectively. The errors in groundwater-level forecasting before and after revision at the stations in Line 1 are shown in and the results for Line 2 are in ; and show the results of the groundwater-level forecasting for the stations in lines 1 and 2, respectively. From the results, errors from most of the first aquifer (Line 1) gauge stations – Xizhou, Hexing, Wutu, Xiluo and Jiulong – were less than 10 cm, while for Ershui and Chukou, the errors between the measured and forecasted groundwater level were less than 30 cm. Since Ershui and Chukou are located in the upstream of the Zhuoshui River, a few data showed that the groundwater level did not increase but decreased after a typhoon event. The model could not simulate this decreasing trend which resulted in the error of groundwater-level forecasting. Although the same phenomenon was not seen for Chukou station, the model could not result in an accurate forecast in this station. Overall, errors from Ershui and Chukou stations were 54 cm and 60 cm, respectively, which is larger than those for most of the stations belonging to the second aquifer (Line 2), whose errors ranged from 25 to 55 cm.
Table 7. Errors in groundwater-level forecasting before and after revision at stations in Line 1.
Table 8. Errors in groundwater-level forecasting before and after revision at stations in Line 2.
Figure 5. Results of groundwater level forecasting at stations in Line 1: (a) Ershui, (b) Gangyuan, (c) Xizhou, (d) Hexing, (e) Zhaojia and (f) Fangyuan.
Figure 6. Results of groundwater level forecasting at stations in Line 2: (a) Chukou, (b) Wutu, (c) Liuhe, (d) Chitong, (e) Xiluo, (f) Jiulong, (g) Ganghou, (h) Fengrong, (i) Xinghua, (j) Houanliao and (k) Haifeng.
In the unconfined aquifer, when the stations had groundwater levels higher than 30 m, the ANN model could not simulate the trend of groundwater level accurately; the accuracy was inversely proportional to the groundwater level. However, as the groundwater level decreased progressively to 30 m, the ANN models could simulate the trend of groundwater level accurately. In addition, revision by MRA improved the accuracy of forecasting. Through the revision, the forecasting model could simulate the trend in groundwater level more accurately in the stations with groundwater levels between 30 and 40 m. If the groundwater level was higher than 40 m, the forecasting model was not guaranteed to give an accurate forecast.
In summary, the stations with groundwater-level errors less than 10 cm belonged to the first aquifer (Line 1) and had groundwater levels lower than 30 m (except for Wutu station). Obviously, the accuracy of the ANN groundwater-level forecasting model was affected by the aquifer type and the groundwater level of the input data.
5 Conclusions
In this study, ANN forecasting models were built for rainfall and groundwater-level prediction during typhoon events, based on data in the Zhuoshui River basin collected from Path 2 and Path 3 typhoons for the period 1990–2012. Then the forecasted results were revised using the multiple regression analysis (MRA) technique. Consequently, a hybrid approach combining the ANN and MRA techniques was proposed to forecast the total typhoon rainfall and the groundwater-level change during typhoon events. The major advance of this study in rainfall forecasting lies in the application of MRA to revise the output values from the BPNN. This methodology can be applied to improve the prediction accuracy of a BPNN under conditions of insufficient training data available for constructing the ANN model. In addition, the developed model is able to forecast the rainfall of a typhoon event a couple hours before it reaches the target gauge station in western Taiwan, depending on the advancing speed and path type of the typhoon after making landfall. From the results and discussion of this research, the conclusions are as follows:
The accuracy of forecasting from the ANN model can be improved significantly by the multiple regression model;
Combining ANN and MRA techniques, the rainfall forecasting model gives an accurate and stable forecast when the rainfall is less than 300 mm;
If insufficient data of extreme rainfall are available for the training procedure of the ANN model, the model may result in lower accuracy for a typhoon event with >300 mm total rainfall, compared to the accuracy for cases with 200–300 mm total rainfall. However, the predicted total rainfall for typhoon events with extreme values (>300 mm) may still be taken as a reference in flood warning analysis; and
The groundwater-level forecasting model can only result in an accurate forecast (error < 10 cm) when the groundwater level is between 5 and 30 m in an unconfined aquifer.
The high forecasting accuracy of the proposed model is limited to total rainfall of less than 300 mm and thus the forecasting results of extreme typhoon events may not be as satisfactory as that for events with rainfall between 200 and 300 mm. However, the limitations may be improved by having more input data from extreme typhoon events and by accounting for the effects of topographic factors, such as whether a gauge station is on the windward or leeward side of the island and the probability of orographic rain occurring.
Disclosure statement
No potential conflict of interest was reported by the authors.
Notes
References
- Chen, C.H., 2010. Typhoon surge forecasting by artificial neural network in consideration of different tracks. Thesis (Master). Department of Land Management and Development, Chang Jung Christian University.
- Chen, C.S., et al., 2006. Early phase of typhoon rainfall forecast. Journal of Chinese Soil and Water Conservation, 37 (2), 201–208.
- Cheng, Y.C., et al., 2013. Application of neural network to typhoon rainfall forecasting using visual programming. In: The 21st Hydraulic Engineering Conference, 25–26 October 2013. Yilan County, Taiwan.
- Chiang, Y.M., Chang, L.C., and Chang, F.J., 2004. Comparison of static- feedforward and dynamic-feedback neural networks for rainfall–runoff modeling. Journal of Hydrology, 290, 297–311. doi:10.1016/j.jhydrol.2003.12.033
- Chitsazan, M., Rahmani, G., and Neyamadpour, A., 2015. Forecasting groundwater level by artificial neural networks as an alternative approach to groundwater modeling. Journal of the Geological Society of India, 85, 98–106. doi:10.1007/s12594-015-0197-4
- Daliakopoulos, I.N., Coulibaly, P., and Tsanis, I.K., 2005. Groundwater level forecasting using artificial neural networks. Journal of Hydrology, 309, 229–240. doi:10.1016/j.jhydrol.2004.12.001
- Gupta, P., Mishra, S., and Pandey, S.K., 2008. Time series data mining in rainfall forecasting using artificial neural network. International Journal of Scientific Engineering and Technology, 3 (8), 1060–1065.
- Hsu, N.S., Lin, W.T., and Chen, C.W., 2009. Study on groundwater level forecasting in Chuo Shui creek alluvial fan using artificial neural network approaches. Journal of Chinese Institute of Civil and Hydraulic Engineering, 21 (03), 285–293.
- Jhong, B.C. and Lin, G.F., 2013. Effective meteorological variables and their effects on hourly typhoon rainfall forecasting. In: 21st Hydraulic Engineering Conference, National Ilan University, Yilan, Taiwan.
- Kwok, T.Y. and Yeung, D.Y., 1997. Constructive algorithms for structure learning in feedforward neural network for regression problems. IEEE Transactions on Neural Networks, 8 (3), 630–645.
- Lin, D.W., 2008. A ground water level forecasting by combining the self-organizing map and the back-propagation neural network. Thesis (Master). National Chiayi University, Chiayi, Taiwan.
- Lin, G.F. and Wu, M.C., 2009. A hybrid neural network model for typhoon-rainfall forecasting. Journal of Hydrology, 375, 450–458. doi:10.1016/j.jhydrol.2009.06.047
- Lin, Y.W. and Hsu, C.H., 1988. On the rainfall distribution of the typhoons that hit Taiwan. Meteorological Bulletin, 34 (3), 196–214.
- Mayilvaganan, M.K. and Naidu, K.B., 2011. Application of artificial neural network for the prediction of groundwater level in hard rock region. Berlin, Germany: Springer.
- McClelland, T.L. and Rumelhart, D.E., 1986. Parallel distributed processing. Cambridge, MA: MIT Press and PDP Research Group.
- Minns, A.W. and Hall, M.J., 1996. Artificial neural networks as rainfall–runoff models. Hydrological Sciences Journal, 41 (3), 399–417. doi:10.1080/02626669609491511
- Mishra, S., et al., 2014. An efficient approach of artificial neural network in runoff forecasting. International Journal of Computer Applications, 92 (5), 9–15. doi:10.5120/16003-4991
- Sarkar, A. and Kumar, R., 2012. Artificial neural networks for event-based rainfall–runoff modeling. Journal of Water Resource and Protection, 4 (10), 891–897. doi:10.4236/jwarp.2012.410105
- Tseng, C.M., et al., 2007. Application of artificial neural networks in typhoon surge forecasting. Ocean Engineering, 34, 1757–1768. doi:10.1016/j.oceaneng.2006.09.005
- Wang, C.K., 2007a. Simulate typhoon rainfall with artificial neural network. Department of hydraulic and ocean engineering. Thesis (Master). National Cheng Kung University, Tainan, Taiwan.
- Wang, J.G., 2007b. Simulating typhoon rainfall with artificial neural network. Department of hydraulic and ocean engineering. Thesis (Master). National Cheng Kung University, Tainan, Taiwan.
- Yang, Z., et al., 2008. Application of back-propagation artificial neural network models for prediction of groundwater levels: case study in Western Jilin Province, China. In: 2008 2nd International Conference on Bioinformatics and Biomedical Engineering. IEEE, 3203–3206. 978-1-4244-1748-3.