
 ?Mathematical formulae have been encoded as MathML and are displayed in this HTML version using MathJax in order to improve their display. Uncheck the box to turn MathJax off. This feature requires Javascript. Click on a formula to zoom.
ABSTRACT
Water indicators and indices are useful tools to assess river basin performance, that is, to measure whether the basin operates satisfactorily under a wide range of possible future demands and hydrological conditions. Spanish regulations assess the performance of water demands by using reliability indicators (RIs), established by law in 2008. This article raises the possibility of updating RIs by comparing them with sustainability indicators (SIs). SIs are widely used for the assessment of river basin performance and several policy scenarios. We applied a water allocation model to the Guadiana River basin in Spain to compare indicators under three scenarios. The study was framed within the science of socio-hydrology, combining the physical environment of a water system with its influence on social aspects. SIs gave better results than RIs when comparing future scenarios. We also propose the introduction of a vulnerability indicator into Spanish regulations.
Editor S. Archfield Associate editor G. Garcia-Santos
1 Introduction
The science of socio-hydrology aims to understand the dynamics and co-evolution of coupled human–water systems, with a focus on the understanding, interpretation and scenario development of the flows and water resources in the human–modified water cycle, at multiple scales (Sivapalan et al. Citation2012, Citation2014, Troy et al. Citation2015). According to Evers et al. (Citation2017) and Sivapalan et al. (Citation2014), the theoretical framework of any socio-hydrological system is the relationships among three aspects: (a) multiscale water system structures and dynamics; (b) water-related human outcomes; and (c) normative goals and values of individuals and societies with respect to water use, conservation, and sustainability.
The word sustainability has been widely used in recent years for a variety of water management proposals, as well as in socio-hydrological studies (EC Citation2000, Sandoval-Solis et al. Citation2011, Sivapalan Citation2018). The American Society of Civil Engineers (ASCE Citation2019) stated that a water system is sustainable when it is designed and managed to fully contribute to the objectives of society, now and in the future, while maintaining ecological, environmental, and hydrological integrity. Loucks (Citation1997) studied the sustainability of a river basin and proposed the sustainability index as the aggregation of reliability (Rel), resilience (Res) and vulnerability (Vul) indicators, i.e. the sustainability indicators (SIs). Sandoval-Solis et al. (Citation2011) made an improvement by including other indicators and assessing the sustainability of different river basin management policies. These Rel, Res and Vul indicators were first developed by Hashimoto et al. (Citation1982), who proposed them to capture water system performance, i.e. to measure the ability of a water resource system to operate satisfactorily under changing demands or hydrological conditions. Many authors have studied the performance of water systems by using these and others indicators and indices (Sarang et al. Citation2008, Sandoval-Solis et al. Citation2011, Pedro-Monzonís Citation2014, Loucks and Van Beek Citation2017, Goharian et al. Citation2018). Water indicators and indices are useful tools for water managers and policymakers to develop effective policies for sustainable water system management. Indices are defined as aggregations of indicators, whereas indicators are aggregations of variables and reflect the characteristics of water resources systems (Lama-Pedrosa Citation2011) (). River basin performance indicators measure the behavioral responses of hydraulic systems, as well as different management alternatives, as used in policymaking (Hashimoto et al. Citation1982, Pedro-Monzonís et al. Citation2015).
Figure 1. Differences between variables, indicators and index. Source: Pedro-Monzonís (Citation2016).
Performance indicators have been broadly used in the literature and were recently reviewed by Pedro-Monzonís et al. (Citation2015); some are listed below:
A sustainability index was proposed by Loucks (Citation1997) to quantify the sustainability of water resources systems. This index is based on Res, Rel and Vul indicators (Loucks Citation1997, Sandoval-Solis et al. Citation2011, Goharian et al. Citation2018).
To assess the capacity of water resources to meet current and future water demands, Milano et al. (Citation2015) used a water allocation index. This index is obtained by using water supply and water demand variables for each year of a given period.
The reliability of annual firm yield (FY) measures the capacity of a part of the water system to supply water each year in the planning period, under a given monthly distribution and to ensure the supply with a defined reliability (Srdjevic and Srdjevic Citation2017).
The reliability indicator (RI) was established in the Spanish guidelines of water planning (IPH by its Spanish acronym) (BOE Citation2008). It indicates that the water supply to urban or agricultural sectors is considered satisfied when the frequency of occurrence of a specified deficit is less than a predetermined level.
The measurement of the reliability of a water supply has been at the forefront of water system design and operation since the early 20th century (Gheisi et al. Citation2016). Gheisi et al. (Citation2016) divided the study of the reliability of water distribution systems into three groups: hydraulic failure, mechanical failure and failure in water quality. However, in this study, we approached reliability from the perspective of reliability of supply of a volume of water. Reliability values using this perspective will depend on the way failures of the water system are quantified (Estrada Lorenzo Citation1993, Lama-Pedrosa Citation2011). Thus, there are criteria that represent the failure’s volume, duration and sequence and other criteria that represent combinations of these. The RI measures a combination of volume and duration of failure, while the Rel indicator measures the duration of failure. The Spanish RI for agricultural demands (ADRIx) was first approached by Lall and Miller (Citation1988), who applied it the Utah Department of Water Resources. Meanwhile, SIs were applied, among others, to the Rio Grande (USA–Mexico) River basin.
Water management in Spain is implemented through River Basin Management Plans (RBMPs), which define the scope of the water balance in a basin for the purpose of water resources studies, demands and management rules. The most popular water balance software used in the Spanish RBMP is AQUATOOL (Andreu et al. Citation1996). River Basin Management Plans are currently being updated for the next management cycle in 2021–2026 and are being revised in the light of experience acquired since their first publication in 2000. This presents an opportunity to propose a new indicator system for water resources. The example of the California Water Plan is noteworthy (Shilling and Shilling Citation2014) with respect to the use of performance indicators. The Water SIs Framework in California grew out of regional projects developing indicators for water and watershed conditions. River basin authorities decided to incorporate SIs into the 2013 Water Plan and developed an indicator catalogue, called the Sustainability Indicators Framework, to facilitate the use of indicators to measure progress toward water sustainability. Similarly, in Europe, the Water Framework Directive (WFD) (EU Citation2000) established the basis for the protection of all water bodies with a sustainable use of water resources in RBMPs. It requires water management to be carried out at the river basin scale, particularly when this involves transboundary management. Some examples of the application of sustainable river basin management have been made in countries with similar climate characteristics as Spain, including Italy and Greece (EC Citation2015). In Italy, water balance studies are applied by the River Basin Authorities to their territory to establish a volumetric reliability of the water supply (EC Citation2015). In an example of the application of such an approach in Ali–Efenti River Basin, Greece, the reliability of the system in supplying the requested demand was examined by assessing the results of a water allocation model. Both the Italian and Greek examples used WEAP software as a distributed water resources management model to calculate a detailed water budget.
Climate change scenarios were first applied to water policy in Spain during the elaboration of the National Plan for Adaptation to Climate Change in 2006 and involved the main coordinating bodies on climate change in Spain. In 2011 the Spanish Centre of Studies and Experimentation in Civil Engineering (CEDEX by its Spanish acronym) published the first national report on Climate Change forecasts (CEDEX Citation2011). Climate change scenarios were considered in the RBMP of the planning cycle from 2009–2015 and 2015–2021. In 2017 they published a report on the impact of climate change on water resources and droughts in Spain (CEDEX Citation2017). The reduction in water supplies in every RBMP were published by CEDEX and applied in this study to determine the responses of indicators to climate change under different scenarios. In addition, demographic changes in river basins affect, and are affected by, water distribution. Rural–urban migration has been a common process throughout Europe, including Spain, in recent decades. Today, this process continues to cause major territorial imbalances because it leads to the progressive abandonment of rural areas and massive growth of cities (Confederación Hidrográfica del Guadiana Citation2015a).
The RI quantifies the reliability of water systems based on the occurrence of failures and is the most widespread method used to measure reliability (Lama-Pedrosa Citation2011). The RBMPs are being revised for 2021 and therefore we undertook a review of the current indicators used in water resource management in Spain. The sustainable management of river basins is being widely applied in the regulations of different countries, and the use of indicators and water allocation models are the main tools. The studies of Sandoval-Solis (Citation2011) and Loucks (Citation1997) suggest that the computation of sustainability indices allows the assessment of river basin performance and comparisons to be made of different planning policies. Other authors have compared different sustainability indicators (Kefayati et al. Citation2018, Ortega-Gómez et al. Citation2018), with the performance indices and indicators proposed herein sharing the same variables for their computation. Moreover, an assessment of performance indicators under different scenarios was conducted in this study and has been applied in the studies of Sandoval-Solis (Citation2011) and Hernández-Bedolla et al. (Citation2017), who compared SIs among different climate change and policy scenarios.
In this study, we propose the application of performance indices and indicators to the water demands of the Guadiana River Basin (GRB) to compare SIs and RIs. We examined the information these indicators provide under the reference scenario and their behaviours when comparing two future scenarios. We framed the study into the three aspects of socio-hydrology: (a) to present a multi-scale water system model (i.e. the GRB); (b) to study the water-related human outcomes of the GRB through the assessment of its water demands and future scenarios; and (c) to link the results with current water management regulations.
2 Study area
The Guadiana River Basin (GRB) is among the most complex river basins in Europe. It is prone to water scarcity, there is a strong competition among users for water and surface and groundwater bodies are highly regulated and overexploited.
The GRB is the fourth largest basin in the Iberian Peninsula (). It lies in the southwestern Iberian Peninsula and occupies an area of 67 139 km2, of which 55 528 km2 lies within Spain and 11 611 km2 within Portugal (CHGn Citation2015a). For this reason, the Albufeira treaty was signed by both countries (BOE Citation2010) as they must coordinate for its management (EU Citation2000). The basin is characterized by a Mediterranean-continental climate with a well-defined dry season and marked seasonal oscillations in temperature, which together generate scarce summer rainfall and high summer temperatures that entail severe, low-water levels. The GRB periodically experiences droughts that challenge water managers in their regulation of water demands. Drought periods in the basin from 1980 were recorded in the periods 1980–1983, 1991–1995, 1999–2000 and 2005–2009 (CHGn Citation2018).
Figure 2. Location of the Guadiana River Basin in the Iberian Peninsula.
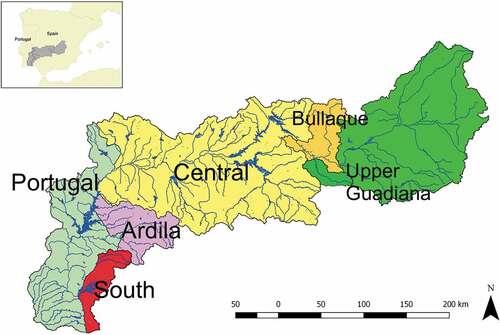
The average altitude of the basin is approximately 550 m a.m.s.l. In the middle area of La Mancha plain, the low slope favours the existence of wetlands, located within Las Tablas de Daimiel National Park (PNT-Daimiel). The abundance of large karstic systems in the upper part of the basin favours the formation of aquifers that give rise to complex relationships between surface and sub-surface waters. The aquifer of La Mancha Occidental (MO-aquifer) is, by far, the most valuable water resource in the upper part of the basin. This aquifer is recognized as being overexploited (EU Citation2000). In the Spanish part of the basin, mean precipitation is 496.41 mm/year (1980/81–2011/12) with minimum and maximum rainfalls of 267.17 and 808.01 mm, respectively. Annual mean potential evapotranspiration (ETP) is 996.2 mm. Temperatures vary seasonally between 6.5 and 26°C. In the Portuguese part, the mean annual precipitation is 566 mm, mean temperature is 16.3°C and maximum and minimum temperatures are 22.4 and 10.3°C, respectively. In Portugal, the mean ETP is 835.3 mm, with minimum and maximum values of 758.1 and 956.3 mm, respectively. The Guadiana River is 852 km long (mean flow: 107 m3/s) and gives its name to the basin. The basin is divided into six watersheds or sub-basins with different characteristics ().
The Spanish part of the basin has a population of 1.5 million, who mainly work in the agricultural sector. Most (95%) of the municipalities in the basin are rural, according to the Eurostat criterion. The agricultural part of the GRB occupies an area of 26 000 km2, or approximately 47% of the total territory. In the Portuguese part of the basin, 55.1% of the lands are arable (4213 km2), 36.3% are pastures (2573 km2) and 11.3% are permanent crops (8650 km2) (CHGn Citation2015b).
3 Methodology
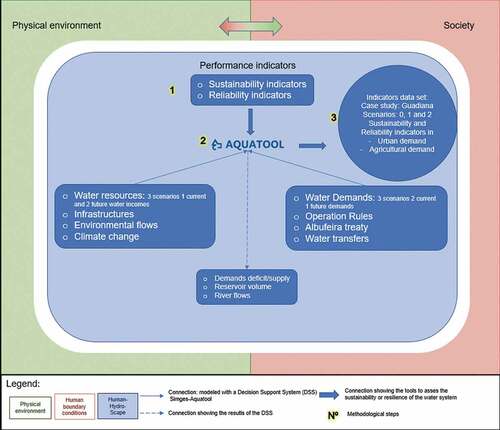
In this study, we compare the results of two performance indicators, SI and RI, using the results of a decision support system (DSS) model under different scenarios. The DSS employed is the AQUATOOL-SIMGES module (Andreu et al. Citation1996, Citation2007) that provides information about water management in the basin, including supply/deficit, reserves, returns, river flows and other variables. We use a socio-hydrology framework based on Evers et al. (Citation2017) to integrate all the aspects in the case study of the GRB ().
Figure 3. Conceptual model within socio-hydrology using the pluralistic water research framework of Evers et al. (Citation2017). Steps of the methodology are numbered as follows: 1 – selection of the water demand reliability indicators; 2 – modelling of the Guadiana River Basin system with the AQUATOOL decision support system; and 3 – comparison of the behaviour of the indicators using the proposed dataset.
3.1 Reliability indicators (RI)
The IPH established that a reliability indicator (RI) for a water supply should be considered in the water balance models in every RBMP. The RIs for urban (UD) and agricultural demands (AD) are computed differently from each other. Here, we calculate RIs for urban (UDRIx) and agricultural (ADRIx) demands. Both indices are binary (complies/does not comply) and assess the reliability of the water resource system.
We define the deficit of water supply when it does not meet the water demand in a certain period. The UDRIx is calculated from two indicators: (a) the monthly failure indicator (MF), which establishes that the supply of a UD fails when the deficit of water supply in one month exceeds 10% of the corresponding monthly demand (Equation 1); and (b) the annual failure indicator (AF), which deems that the supply fails to meet the UD when in 10 consecutive years, the sum of all deficits exceeds 8% of the annual demand (Equation 2).
where i represents months and t represents years. Similarly, the ADRIx must fulfil three specifications, or indicators, that are summarized as follows: A-RI – the water supply deficit in one year cannot exceed 50% of annual demand; B-RI – the sum of water supply deficit of two consecutive years cannot exceed 75% of annual water demand; and C-RI – the sum of deficits in the water supply of 10 consecutive years cannot exceed 100% of annual demand. For data analysis, the number of annual failures in the time series is calculated as:
where, if n = 1, m = 50, if n = 2, m = 75 and if n = 10, m = 100.
3.2 Sustainability indicators (SIs)
There are numerous successful applications of SIs for the analysis of the sustainability of river basins (Sandoval-Solis et al. Citation2011, Ashofteh et al. Citation2017, Gohari et al. Citation2017, Hernández-Bedolla et al. Citation2017). The SIs used in this study are Rel, Res and Vul (see Section 1). It is necessary to compute these SIs to compute the sustainability index proposed by Loucks (Citation1997) and Sandoval-Solis et al. (Citation2011). To obtain these indicators, we first defined the failure threshold, depending on the use of the demand, and established that UD fails when >10% of the demand is not supplied and AD fails when >25% of the demand is not supplied. We summarize below the Rel, Res and Vul computations and principles.
3.2.1 Reliability indicator (Rel)
The supply of water is reliable when the probability of the available water supply meets the demand during the simulation period (Hashimoto et al. Citation1982). Time-based Rel (Reli) is defined (Loucks Citation1997) as the portion of time that the water demand is fully met when in a fixed time period, n – in this case study, the number of months (Equation 4). For each time period t, a deficit (
) appears when demand exceeds supply
>
) for a specified water user i. If the water supplied is equal to the water demand (
), deficits are zero (i.e.
). Values of this index vary between one and zero, where one represents the best performance and zero the minimum reliability (Equation 5).
3.2.2 Resilience indicator (Res)
The resilience indicator (Res) is a statistic that assesses the adaptability of water management (WHO Citation2009). Resi is the probability that a successful period (i.e. a period with full water supply to meet the demand) follows a failure period (i.e. a period when there are deficits in the supply of water with respect to the demand). Values of Res vary between one and zero, where one represents the best performance and zero is the poorest. The resiliency of a demand is calculated as:
3.2.3 Vulnerability indicator (Vul)
The vulnerability indicator (Vul) is a measure of the likely value of deficits, if they occur (Hashimoto et al. Citation1982). The vulnerability of a demand is the sum of its deficits, divided by the number of times deficits has occurred. The dimensionless Vul is calculated by dividing the average annual deficit by the annual water demand, for water user i (Equation 7). The inverse of Vul is used in this study to allow for better data analysis. This index varies between one and zero, where one represents the best performance, meaning demand has low vulnerability, and zero means that demand is very vulnerable to stress.
3.2.4 Sustainability index (SusInd)
To calculate the sustainability index, the geometric average of M performance criteria (i.e. SIs in this study) is used – () for water user i (Sandoval-Solis et al. Citation2011). To obtain the sustainability index for water user i, three criteria (M = 3) are thus taken into account:
and
(Equation 8). The application of this methodology allows the scaling of the sustainability index. The higher the value of the index, the better the condition of the watershed with regards to supply and demand. The sustainability index is classified in five categories as: Very High (1–0.81), High (0.8–0.61), Moderate (0.6–0.41), Low (0.4–0.21) and Very Low (0.21–0).
3.2.5 Sustainability of different water exploitation sub-basins (SG)
The values of the reliability indicators (i.e. Rel, Res and Vul) for each water demand of the same sub-basin are aggregated, as shown in Equation (9), to show the results of the indicators per sub-basin. The objective of this computation is to apply the methodology to large river basins having broad exploitation subsystems. A computational method using Matlab (https://es.mathworks.com/) is used to obtain the SIs by sub-basin. The relative importance of each demand is reflected in the weight W assigned to each water demand (Equation 10), with the indices being weighted by annual water demand in our case study.
where C is either Rel, Res or Vul, K is the sub-basin and i is one demand (, and
Sustainability by group (SG) is the weighted average of sustainability indices (Loucks Citation1997). It is calculated to compare a group of water users (i.e. a group of water demands in the same sub-basin) k, with water users i to j belonging to this group, where Wi is a relative weight for the ith water user, ranging from zero to one:
3.3 Performance indicators
To compute reliability and sustainability indicators, we use the aggregation of the deficits in water supply of the water system demands. Thus, it is possible to compare the number of years or months that exhibited failure in supply with the values of Rel, Res and Vul. We also considered that SusInd and the indices ADRIx and UDRIx have similar meanings and come from comparable indicators that are related. If the supply of a water demand shows high or low sustainability, its compliance (or not) can be compared using ADRIx and UDRIx. shows the main differences and similarities among these indices and indicators.
Table 1. Details of the water demand performance indicators used in the methodology. RI: reliability indicators; SI: sustainability indicators.
3.4 Water allocation model
Once indicators have been selected, they must be supplied with numerical data. In this study, numerical values are simulated with a water allocation model. The GRB water system was modelled using AQUATOOL-SIMGES (Andreu et al. Citation1996) software and three different scenarios of water resources and demands in the basin were examined ().
Figure 4. Water allocation model of Guadiana River Basin with the AQUATOOL-SIMGES graphical interface.
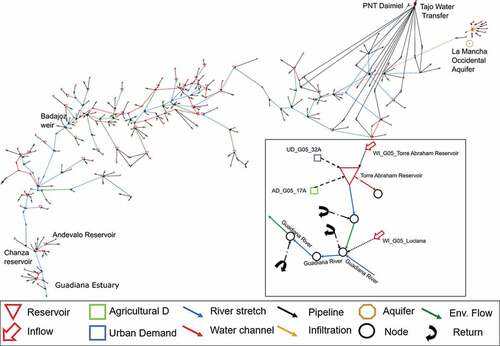
The model of the GRB is based on a firm understanding of the basin, including demands within the basin. The characteristics of the model are summarized in . To examine the GRB, we established an aggregation of the different water elements, depending on their location in each watershed or sub-basin. Each element in the model was positioned over a geographical map to locate elements across the basin. The required data, including characteristics of surface water resources, aquifers, reservoirs volumes and management and water demands and uses, were collected from the GRB management plan (GRBMP). These data were input into the AQUATOOL-SIMGES model, which was used to simulate 32 years (October 1980 to September 2012; 384 months). This period of analysis contains multiple historical droughts across the basin. Water inputs come from the hydrological model – the integral system for the modelling of precipitation and inflow – Sistema Integrado para la Modelación del proceso Precipitación (SIMPA). Groundwater flows within the model were solved using an eigenvalues method for the MO-aquifer (see Section 2). There are 20 demands in the Upper Guadiana that pump water from this aquifer. Priority is given to UD, followed by AD, while other demands (OD) were assigned the lowest priority. These OD were not considered in the computation of the indicators. The model has 43 water reservoirs of more than 2 hm3 capacity; smaller capacity reservoirs were considered as nodes in the model and were not regulated. Environmental flows were determined from the 10th percentile on the curve of classified monthly flows (i.e. they are not considered as a demand, but as criteria to follow in some channels). Water transfers in the model were considered from the Tajo and Guadalquivir river basins. A transfer of 50 hm3 from the Tajo River (Trasvase Tajo-Segura, ATS) was activated when a failure in the UD appeared, with 30 hm3 destined to UD and 20 hm3 supplied to PNT-Daimiel. The water transfer from the Guadalquivir basin was 7.17 hm3/year. The PNT-Daimiel is in the Upper Guadiana sub-basin and was considered as an environmental flow channel with a minimum required flow. In the model, it is supplied by the water that flows from the aquifer into the Guadiana River and the ATS. The estuary of the Guadiana River was also considered to be an ecological flow in the model. The Albufeira treaty was modelled by adding two operational rules for the weir at Badajoz. This weir affects 6 reservoirs in the basin, depending on monthly pluviometry and is located at the border between the Central and Portuguese sub-basins.
Table 2. AQUATOOL-SIMGES model characteristics of the GRB by sub-basin. Average annual values in hm3. Data used in the reference scenario series 1980/81–2011/12. Sub-basins: 1 – Upper Guadiana; 2 – Bullaque; 3 – Central; 4 – Ardila; 5 – South; 6 – Portugal.
3.5 Future scenarios in the GRB
To evaluate the possible effects of climate change on the Guadiana basin, we modelled two additional scenarios, as summarized in . Scenario 1 consists of a 6% reduction in water supply. Climate change reduction data were extracted from the CEDEX (Citation2017) report, which recommended this percentage reduction as a general approach when working with future projections for the Iberian Peninsula. Under Scenario 2, we applied the 6% reduction in water supply, but also changes in water demands (). Increased and decreased water demands were applied because the Guadiana water authorities have estimated that changes will occur in UDs and ADs in the future planning cycles in the GRBMP arising from population movements into urban areas through to 2033 (CHGn Citation2015a).
Table 3. Summary of the differences between scenarios 1 and 2 in the water allocation model. Values in hm3/year. UD: urban demand, AD: agricultural demand. Sub-basins: 1: Upper Guadiana; 2: Bullaque; 3: Central; 4: Ardila; 5: South; 6: Portugal.
4 Results and discussion
The results are divided into four sections: (1) analysis of the results obtained from the reference scenario in the GRB; (2) comparative analyses of performance indicators under the reference scenario; (3) analysis of the results under scenarios 2 and 3; and (4) comments on the integration of social aspects in the study.
The results of the AQUATOOL-SIMGES model demonstrate that 29.4% of the UDs in the basin show water deficits across the time series. The model has 40 ADs, with a total requirement of 1923.44 hm3 and 77.5% of all ADs exhibited deficits. Analysis of the indicators demonstrated that nine ADs had SIs lower than one.
4.1 Comparing SIs and RIs
The general differences and similarities in the two types of indicators are that different formulae were used for the RIs, depending on the type of demand examined, while for the SIs we used the same formulae for all types of demand. The RIs of UD examine the deficit at two timescales, monthly and annual, whereas the SIs examine deficits at a monthly time step. Calculations of ADRIx used annual deficits, while the SI used monthly time steps. The results of the indicators across different demands and scenarios are discussed below.
4.1.1 Analysis of urban demands in the reference scenario
Values of SI less than one were recorded in 10 UD locations (). Three behavioral trends were detected among low values of SI demands:
Table 4. Results of sustainability and reliability indicators and indices for urban demands with deficit values in the temporal series under Scenario 0.
Demands that present low and very low values of Res with high and very high Rel and Vul (62B, 68B, 43B, 56B, 60B). This behaviour was due to consecutive deficit periods that were the consequence of droughts in the historical series. This behaviour highlights that the regulation of the system was not able to adapt to low water availability. Low Res and low Vul indicate that when failures occurred, the deficit of the demand was very high.
Demands with moderate values of Rel, very low Res and low or very low Vul. In these cases, the model did not supply sufficient water to satisfy the demands because of structural deficits. Demands 20B and 71P, despite being regulated by large reservoirs, did not supply water to the UD. However, Vul performance values indicate that the failures did not correspond to the whole volume of the demand. Demand 63B presents very low Rel due to long periods of failure.
Demands with high or very high Vul (25B, 70P). These indicate that supply failures did not correspond to the volume of demand. Moderate and low Res values demonstrated their poor adaptation to episodes of failure. UDs that do not comply with UDRIx exhibited SI values that were less than one.
The Rel indicator and the MF indicator showed similarities at a theoretical level (). Rel indicates the number of months with deficits, while MF indicates poor system performance when, in one month, the deficit exceeds 10% of the demand. Both indicators reflect the water supplied by the system to meet the demand. Whereas Rel gives the relative number of failures in the time series, the MF indicates the number of months with failures. However, we observed that when we subtract the number of monthly failures of MF from the number of months of the time series (n) and divide the value by n, the values obtained were similar to those of Rel. Therefore, both indices are mathematically related (see last column of ).
Figure 5. Comparison between the reliability indicator (Rel) and the monthly failure indicator (MF) for those urban demands (UD) that fail in the model under Scenario 0.
The indicator Res indicates the number of times a failure period begins and it can be compared to the AF (). Mathematically, AF is the sum of deficits in a 10-year period and differs from the Res formula. However, both indicators show an almost direct proportionality, with very low and low values of Res (0.15–0.0) having an AF between 32 and 24 and moderate values of Res (0.19–0.49) having an AF between 16 and 20.
Figure 6. Comparison between the resilience indicator (Res) and the annual failure indicator (AF) for the urban demands (UD) that fail in the model under Scenario 0.
At a theoretical level, Vul measures the number of times a failure occurs with respect to the volume of the water demand. Reliability indicators for UDs do not consider the volume of water demand when calculating the fulfilment of the UD. Moreover, the results did not show any similarities of the UD with either MF or AF. Vul also shows the failure severity of the demand and this should be an indicator used in the calculation of UDRIx. It is important to know the amount of the failure in the UD. Therefore, the Vul indicator should be incorporated into the study of UD in Spanish regulations.
The results of the UD reliability indicators are not directly related to SIs, although high values of AF and MF tend to be associated with low values of SIs. The SIs results reflect the performance of the demand in a more accurate way and they can be scaled across different ranges to improve the analyses. When compared, the conclusions derived from both indicators are similar, namely, that demand was not fully met. However, if the indices are compared, UDRIx demonstrated that demand 25B was not met, despite the sustainability index having good values with respect to that demand (SusInd: 0.71). The SusInd determines not only whether bad performance is happening, but also why.
4.1.2 Agricultural demand in the reference scenario
A comparison of Rel with A-RI and B-RI demonstrated that they are very different at a theoretical level. No failures in AD in the C-RI indicator were found in the model. Consequently, we do not discuss this indicator any further.
The Rel indicates the number of months with deficits; in contrast, the timescale of A-RI is annual and measures the number of years annual deficit exceeded 50% of the annual demand. Values of Rel between 0.73 and 0.26 demonstrated failures from 21 to 32 years ( and ). A-RI values were directly related when detecting the failures of the water supply to a demand. The Rel indicator shows the supply to the demand while A-RI shows the intensity of the failures. B-RI works at a bi-annual scale and is less strict than Rel because it does not comply when bi-annual deficit exceeds 75% of the annual demand. Thus, when Rel is 0.74, the B criterion shows nine years when the AD was not satisfied. Values of Rel from 0.61 to 0.26 show annual fails in B-RI of between 23 and 31.
Table 5. Results of sustainability and reliability indicators and indices for agricultural demands with deficit values in the temporal series under Scenario 0.
Figure 7. Comparison between the sustainability indicators (SIs) and the A and B indicators for the reliability of the agricultural demands (AD) that fail in the model under Scenario 0.
The indicator Res shows the number of times a failure period begins, whereas B-RI measures failure when deficit exceeds 75% of the demand during two consecutive years. However, no numerical relationship was found between the two indicators.
The indicator Vul measures the number of times a failure occurs with respect to the volume of water demand, while RI determines that a demand is not satisfied when the sum of deficits exceeds 50% of annual (A-RI) or 75% of bi-annual demand (B-RI). High and very high values of Vul (>0.50 and >0.83, respectively) show good performance in A and B-RI, but Vul values between 0 and 0.26 are associated with failures in A-RI of between 21 and 32 months and those between 31 and 9, fails for B-RI. Because the Vul indicator assesses the severity of failure in demand and A and B-RI measure the intensity and magnitude of the failure, the relationship between these results is expected.
The SI values were almost directly related to compliance of the ADRIx. When SI exceeded 0.4 the ADRIx was compliant, whereas when SI was smaller than 0.4 (e.g. AD 35B, 2A, 17A,1C, 52P, 68P and Sotavento), the ADRIx was not compliant ().
Figure 8. Comparison between the sustainability index (SusInd) and the agricultural demands reliability index (ADRIx) for the agricultural demands (AD) that fail in the model under Scenario 0.
4.2 Impacts of climate change in the GRB
4.2.1 Urban demands in future scenarios
The results of the application of the indicators under two future scenarios in the AQUATOOL-SIMGES model are shown in and discussed below. The general state of the GRB, regarding sustainability of UD, was not as affected by the reduction of water incomes (Scenario 1) as it was by the change in water uses in Scenario 2. The Rel and Res indicators demonstrated how the performance of the basin was worsened in future scenarios 1 and 2. Because of the changes in water use, very high values of Vul were manifest in both future scenarios. The performance in each sub-basin is discussed below. With respect to Rel, remarkable impacts were detected in UD in the Central and Portuguese sub-basins under Scenario 2 due to a 10% and 0.3% increase in demand, respectively. The Central subsystem was less vulnerable under Scenario 2 because 100% of the UD experienced a supply deficit, but these deficits were lower than the value of the demand. The Upper Guadiana subsystem was also expected to increase its demand by 12.5%. However, the MO-aquifer and the ATS supply water to UD, thereby making this subsystem less vulnerable to failures. The Res indicator performed in two different ways. First, the South and Ardila subsystems were not affected by reductions in water supply nor by changes in UD. Second, the remaining subsystems were negatively affected by the reduction in water inflows, as well as by changes in demand. The Vul results demonstrated that the South subsystem exhibited very high Vul, as observed in the Upper Guadiana. The Ardila subsystem was not affected by changes in future scenarios. The Bullaque subsystem was highly influenced by reductions in water supplies and was highly vulnerable in both future scenarios. These results demonstrate that Central, Bullaque and Portugal are the most adversely impacted subsystems under future scenarios.
Figure 9. Results (in %) of the sustainability index by group under the different scenarios: (a) urban demands and (b) agricultural demands.
We compared demands that have low sustainability for all three proposed scenarios (reference Scenario 0, and scenarios 1 and 2). Under the reference scenario, nine demands out of 34 exhibited an SI lower than 0.4. However, under Scenario 1, 16 UDs and, under Scenario 2, 23 demands were associated with SusInd lower than 0.4. A reduction in water demand by the Ardila subsystem benefited UD under Scenario 2, the Central subsystem increased its monthly fails due to increased water demands and the Portuguese subsystem was affected by reductions in water supplies as well as by increased volume of UDs.
Finally, the behaviour of the RI and SIs for the UDs under the different scenarios was analysed. Compared to MF, the Rel of the UDs did not change much under each scenario. An exception was observed under Scenario 2, where Rel values of demands were reduced, even though MF did not exhibit this behaviour of unequal supply. The AF indicator exhibited variances in certain demands under Scenario 2 because the number of failures increased. Sustainability indicators were found to be a better system to show variability across the scenarios. The Res results varied across the scenarios, while AF results did not show this variation. The results across different scenarios demonstrated that, whereas Vul exhibited a change in some demands of Scenario 2, MF and AF did not reflect this variation. Finally, the comparison of the sustainability index with the UDRIx demonstrated that UDRIx did not reflect changes in the behaviour of the demands, but SI did exhibit some changes among demands.
4.2.2 Agricultural demand in future scenarios
The ADs were highly affected by climate change in the GRB. ) shows how the GRB system performed according to the SIs under the different scenarios. The Central system exhibited low Rel and Res due to the 12.5% increase in AD under Scenario 2. In comparison to the reference scenario, a reduction in water supplies did not affect the Rel and Res of the subsystem under Scenario 1 and the same applied to the Bullaque and Portuguese subsystems. The SIs demonstrated that the Central and South subsystems were the most affected under Scenario 2 due to the expected increase in ADs. Upper Guadiana was not as affected due to the availability of groundwater. The reference scenario presented eight fails in ADRIx and SIs that were smaller than 0.4 among 40 ADs in the model. Under Scenario 1, the number of fails did not change; however, under Scenario 2, 33 ADs had SIs smaller than 0.4 and 32 demands failed in ADRIx. A comparison of SIs and RIs demonstrated that demands that did not accomplish ADRIx as the three scenarios all had the same number of fails. This means that RIs are not able to show differences in the performance state of the basin across scenarios. In contrast, SI results under Scenario 2 exhibited important differences compared to the reference scenario and Scenario 1.
4.3 Integration of the social aspects in the study
The management of water systems is influenced both by physical and social aspects, including hydrology, climate, technological advances, economy and politics (García-Santos et al. Citation2018). Our paper examined all three aspects of socio-hydrology. It presents a multi-scale water system model that links with the present water management regulations and it examines the water-related human outcomes through the assessment of water demands and future scenarios. The methodology followed in the study is similar to that applied in the Spanish RBMP, consisting of the use of DDS models to allow water managers to shape and manage a complex water resources system in an optimal way. In this method, the inclusion of social aspects must be interpreted by the planner and is something that the DSS does not consider. Even though the RBMP and WFD establish the importance of applying economic and social issues in the RBMP, these policies are hard to implement and scarce in the literature.
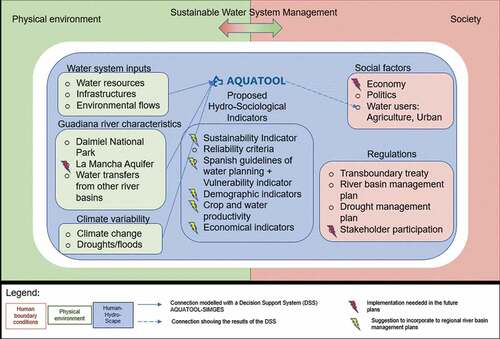
We observed that hydrology and social science use different languages. Hydrologists emphasize the importance of using mathematical models to quantify water dynamics, while social scientists highlight the role of social processes, structures and governance in decision making, accompanied by a need for knowledge translation to decision makers and end users. Thus, we reiterate here the comment by Xu et al. (Citation2018) and propose an interdisciplinary collaboration between both fields. A new approach should include water-related human outcomes (well-being), analysis of the economic costs of water deficits in the system, as well as the economic costs of climate change scenarios. In Spain, the RBMP brings water management closer to the user. Therefore, the use of indicators is proposed as an efficient way to share information among both parties. Both the reliability and sustainability indices can be compared with socio-hydrological indicators, as, for example, demographic indicators and crop and water productivities. presents a schematic outline of a conceptual model, including the reflections and suggestions of the authors of this paper to the Spanish authorities.
Figure 10. Conceptual model with our suggestions to the Spanish authorities within the socio-hydrological framework based on Evers et al. (Citation2017).
The case study presented herein was approached from the perspective of hydrology. The social factors affecting the study basin were considered to a minor extent. However, we included demographic information regarding indicators of a decrease in population in some parts of the basin. The depopulation of the countryside and the concomitant movement of people to the cities were included in Scenario 2. These data were taken from the RBMP and the Spanish National Statistics Institute (INE Citation2019). Other environmental problems that have hydrological and social factors include: the maintenance of a healthy ecological status of the PNT-Daimiel, the transfer of water from the River Tagus and the exploitation of the MO-aquifer. Aguilera et al. (Citation2013) and Yustres et al. (Citation2013) studied the influence of surface water–groundwater interactions in the PNT-Daimiel using conceptual hydrological modelling. These were considered in the physical aspects of the basin. However, it is proposed that there is a need to study their societal effects. As for the study of water demands for irrigation and urban requirements, these have been studied through the use of indicators, while Ruiz-Pulpón (Citation2006) studied the irrigation and sustainable use of water in the GRB from a social perspective. Finally, because it is a transboundary basin, the Albufeira treaty that regulates the transboundary waters between Spain and Portugal was considered in the modelling, although its direct influence on society requires study in the future. Finally, the use of indicators is proposed as an efficient and easy way to share information amongst all interested parties.
5 Summary and conclusions
This study represents a step toward a better understanding of indicators and indices applicable at a river basin level to improve the management of water supply to the meet the demands at a river basin level in Spain. We applied a water allocation model to the GRB and studied the behaviour of water demands under the current and two future scenarios. Finally, we integrated the social aspects into the study by proposing new sociological indicators and studying the effects of our results in the socio-hydrological context in the GRB. The study of water demands should be approached from the perspective of the availability of water resources, not only from the perspective of whether the RI is met. Understanding the link between sustainability and water demands is essential for water managers. Therefore, the sustainability indicators are a good option when it comes to studying the sustainability of demand, because they are based on its performance.
The most important findings of this study are as follows:
Direct similarities among Rel and MF were found with respect to UD, and the AF indicator exhibited a direct relationship with the Res indicator.
The Vul indicator demonstrated the severity of failures of the supply. Because this is not measured by RI of UD, this should be included in RI as it is important to know the amount of failure in the UD supply. Therefore, we propose the inclusion of a vulnerability indicator in the study of UD in Spanish regulations.
The A-RI and B-RI indicators are both related to Rel with respect to AD. Both study the behaviour of the demand according to supply. However, agricultural RI criteria are stricter than urban ones. There was a relationship between A-RI and B-RI indicators for low values of Vul.
As noted by Goharian et al. (Citation2018), one of the main challenges concerning SIs is that multiple combinations of Rel, Res and Vul can lead to the same value. However, this was not observed in the RI indicators studied here. Therefore, SIs are not capable of delivering unique information about specific systems. However, RI indices measure the behaviour of the demands in terms of magnitude and frequency of failures and evaluate them for different time periods and conditions.
Overall, SIs allow analysis of the cause of poor performance of UD and this allows the application of solutions. This fact may play an important role because, for example, if Res is low, water reservoir construction or regulation must be considered. If Vul of the demands is high, adaptation to low water supplies by reducing water demands, improving efficiencies or new water sources, could be proposed.
The application of the indices and indicators used in this study to climate change scenarios demonstrated that the use of RI to evaluate different policies or climate change conditions has the drawback that the results hardly varied between scenarios, making it impossible to observe changes in trends. However, the SIs allowed comparisons to be made among different scenarios and these have already been applied to different scenarios, with good results (Sandoval-Solis et al. Citation2011, Collet et al. Citation2015).
Regarding the application of these SIs for the assessment of the performance of river basins, the authors suggest the following. On the one hand, due to the long tradition in the implementation of RIs in Spanish models and the good results so far (CHGn Citation2015a), their continued use is recommended. On the other hand, new European and United States policies aim to evaluate the sustainability of river basins, so it would be advisable to introduce SIs into Spanish RBMPs. Therefore, the application of SIs in water management policies would be advisable, as has been done, for example, in the California Water Plan (State of California Citation2019).
As noted in Pedro-Monzonís (Citation2016), and as is also apparent from our results, the authors suggest that new water policies in Europe should provide the methodology to determine water availability in a river basin and also the way that the results are assessed. Indicators used with the results of the water balance models should give an idea of the management needs of water in the basin and be sustainable with the environment.
There should be no deficit on the demands if water management systems are properly designed and exploited and demands are kept within reasonable limits, according to the climatic characteristics of the region (Lama-Pedrosa Citation2011). Therefore, river basin management plans should take into account climate change adaptation within agricultural production to reduce water demands in this economic sector (Alarcón et al. Citation2016).
As stated by Gunda et al. (Citation2018), this study could inspire and trigger future research that relates community dynamics with the responses of the water system and sustainable management of water with clear guidance on what socio-hydrology and coupled human-water system studies in general can do next.
Acknowledgements
The authors thank the Spanish Research Agency (MINECO) for the financial support to the ERAS project [CTM2016-77804-P], including EU-FEDER funds. Additionally, we value the support provided by the European Community in financing the project IMPREX [H2020-WATER-2014-2015, 641811].
Disclosure statement
No potential conflict of interest was reported by the authors.
References
- Aguilera, H., et al., 2013. Model of hydrological behaviour of the anthropized semiarid wetland of Las Tablas de Daimiel National Park (Spain) based on surface water-groundwater interactions. Hydrogeology Journal, 21 (3), 623–641. doi:10.1007/s10040-012-0950-3
- Alarcón, J., Garrido, A., and Juana, L., 2016. Modernization of irrigation systems in Spain: review and analysis for decision making. International Journal of Water Resources Development, 32 (3), 442–458. doi:10.1080/07900627.2015.1123142
- Andreu, J., Capilla, J., and Sanchís, E., 1996. AQUATOOL, a generalized decision-support system for water-resources planning and operational management. Journal of Hydrology, 177 (3–4), 269–291. doi:10.1016/0022-1694(95)02963-X
- Andreu, J., et al., 2007. Modelo SIMGES para simulación de cuencas. Manual de usuario v3. 00. Valencia, Spain: Universitat Politècnica de València.
- ASCE (American Society of Civil Engineers), 2019. Policy statement 418—the role of the civil engineer in sustainable development [online]. Available from: https://www.asce.org/issues-and-advocacy/public-policy/policy-statement-418—the-role-of-the-civil-engineer-in-sustainable-development/ [Accessed 2 May 2019].
- Ashofteh, P.-S., Rajaee, T., and Golfam, P., 2017. Assessment of water resources development projects under conditions of climate change using Efficiency Indexes (EIs). Water Resources Management, 31 (12), 3723–3744. doi:10.1007/s11269-017-1701-y
- BOE (Boletín Oficial del Estado), 2008. ORDEN ARM/2656/2008, de 10 de septiembre, por la que se aprueba la instrucción de planificación hidrológica. BOE. 229 de 22 de septiembre 2008, 38472–38582. https://www.boe.es/buscar/doc.php?id=BOE-A-2008-15340.
- BOE (Boletín Oficial del Estado), 2010. Protocolo de Revision del Convenio Sobre Cooperación Para La Protección y el Aprovechamiento Sostenible de Las Aguas de las Cuencas Hidrográficas Hispano-Portuguesas y el Protocolo adicional. Albufeira, Portugal, 30 de Noviembre de 1998. BOE. 14, de 16 de enero de 2010, 3425–3432
- CEDEX (Centro de Estudios y Experimentación de Obras Públicas), 2011. Evaluación del Impacto del Cambio Climático en los recursos hídricos en régimen natural. Encomienda de gestión de la Dirección General del Agua (MARM) para el estudio del cambio climático en los recursos hídricos y las masas de agua. Madrid, Spain: Centro de Publicaciones, Secretaría General Técnica del Ministerio de Fomento.
- CEDEX (Centro de Estudios y Experimentación de Obras Públicas), 2017. Evaluación del impacto del Cambio Climático en los recursos hídricos y sequías en España. Madrid, Spain: Centro de Estudios Hidrográficos.
- CHGn (Confederación Hidrográfica del Guadiana), 2015a. Plan Hidrológico de la parte española de la Demarcación Hidrográfica del Guadiana. Badajoz: Confederación Hidrográfica del Guadiana, Ministerio de Medio Ambiente, Spain.
- CHGn (Confederación Hidrográfica del Guadiana), 2015b. Plano hidrológico da região hidrográfica do guadiana (ciclo 2015–2021) e plano de gestão do risco de inundação. Badajoz: Confederación Hidrográfica del Guadiana, Ministerio de Medio Ambiente, Spain.
- CHGn (Confederación Hidrográfica del Guadiana), 2018. Plan especial de sequía de la Cuenca del Guadiana. Badajoz: Confederación Hidrográfica del Guadiana, Spain.
- Collet, L., et al., 2015. Water supply sustainability and adaptation strategies under anthropogenic and climatic changes of a meso-scale Mediterranean catchment. Science of the Total Environment, 536 (January 2016), 589–602. doi:10.1016/j.scitotenv.2015.07.093
- EC (European Commission), 2000. Directive 2000/60/EC of the European parliament and of the council of 23 October 2000 establishing a framework for community action in the field of water policy. Official Journal of the European Communities, L327, 1–82. doi:10.1039/ap9842100196
- EC (European Commission), 2015. Guidance document on the application of water bal- ances for supporting the implementation of the WFD. Final — Version 6.1–18/05/2015. Brussels: Publications Office of the European Union.
- Estrada Lorenzo, F., 1993. La garantía en los sistemas de explotación de recursos hidráulicos. Thesis (PhD). Universidad Politécnica de Madrid.
- Evers, M., et al., 2017. The pluralistic water research concept: A new human-water system research approach. Water (Switzerland), 9 (12), 1–12.
- García-Santos, G., et al., 2018. Methodology to explore emergent behaviours of the interactions between water resources and ecosystem under a pluralistic approach. Proceedings of the International Association of Hydrological Sciences, 379, 83–87. doi:10.5194/piahs-379-83-2018
- Gheisi, A., Forsyth, M., and Naser, G., 2016. Water distribution systems reliability: a review of research literature. Journal of Water Resources Planning and Management, 142 (11), 04016047. doi:10.1061/(ASCE)WR.1943-5452.0000690
- Gohari, A., Mirchi, A., and Madani, K., 2017. System dynamics evaluation of climate change adaptation strategies for water resources management in central Iran. Water Resources Management, 31 (5), 1413–1434. doi:10.1007/s11269-017-1575-z
- Goharian, E., Burian, S.J., and Karamouz, M., 2018. Using joint probability distribution of reliability and vulnerability to develop a water system performance index. Journal of Water Resources Planning and Management, 144 (2), 04017081. doi:10.1061/(ASCE)WR.1943-5452.0000869
- Gunda, T., Turner, B.L., and Tidwell, V.C., 2018. The influential role of sociocultural feedbacks on community-managed irrigation system behaviors during times of water stress. Water Resources Research, 54 (4), 2697–2714. doi:10.1002/wrcr.v54.4
- Hashimoto, T., Stedinger, J.R., and Loucks, D.P., 1982. Reliability, resiliency, and vulnerability criteria for water resource system performance evaluation. Water Resources Research, 18 (1), 14–20. doi:10.1029/WR018i001p00014
- Hernández-Bedolla, J., et al., 2017. The assessment of sustainability indexes and climate change impacts on integrated water resource management. Water, 9 (3), 213. doi:10.3390/w9030213
- INE (Instituto Nacional de Estadística), 2019. Spanish national statistics institute [online]. Available from: https://www.ine.es/ [Accessed 11 October 2019].
- Kefayati, M., et al., 2018. Empirical evaluation of river basin sustainability affected by inter-basin water transfer using composite indicators. Water and Environment Journal, 32, 104–111. doi:10.1111/wej.2018.32.issue-1
- Lall, U. and Miller, C.W., 1988. An optimization model for screening multipurpose reservoir systems. Water Resources Research, 24 (7), 953–968. doi:10.1029/WR024i007p00953
- Lama-Pedrosa, B., 2011. Metodología de evaluación e identificación de políticas de adaptación al cambio climático en la gestión de recursos hídricos. Department of Civil Engineering, Higher Technical School of Civil Engineering (ETSICCP). Madrid, Spain: Technical University of Madrid (UPM).
- Loucks, D.P., 1997. Quantifying trends in system sustainability. Hydrological Sciences Journal, 42 (4), 513–530. doi:10.1080/02626669709492051
- Loucks, D.P. and Van Beek, E., 2017. Water resource systems planning and management: an introduction to methods, models, and applications. Cham, Switzerland: Springer. Available from: https://doi.org/10.1007/978-3-319-44234-1
- Milano, M., et al., 2015. Climatic and anthropogenic changes in Western Switzerland: impacts on water stress. Science of the Total Environment, 536, 12–24. doi:10.1016/j.scitotenv.2015.07.049
- Ortega-Gómez, T., Pérez-Martín, M.A., and Estrela, T., 2018. Improvement of the drought indicators system in the Júcar River Basin, Spain. Science of the Total Environment, 610–611, 276–290. doi:10.1016/j.scitotenv.2017.07.250
- Pedro Monzonís, M., 2014. Análisis de metodologías de balances hídricos en sistemas complejos en el contexto europeo de la Planificación hidrológica. Aplicación a la cuenca del Júcar. Thesis (MS). Universitat Politècnica de València.
- Pedro-Monzonís, M., 2016. Assessment of water exploitation indexes based on water accounting. Thesis (PhD). Universitat Politècnica de València.
- Pedro-Monzonís, M., et al., 2015. A review of water scarcity and drought indexes in water resources planning and management. Journal of Hydrology, 527, 482–493. doi:10.1016/j.jhydrol.2015.05.003
- Ruiz-Pulpón, Á.R., 2006. Regadíos y Gestión Sostenible de los recursos hídricos en la cuenca del Guadiana: propuesta Territorial previa a la toma de decisiones. Investigaciones Geográfi cas, 40, 183–199. doi:10.14198/INGEO2006.40.09
- Sandoval-Solis, S., 2011. Water planning and management for large scale River Basins case of study: the Rio Grande/Rio Bravo transboundary basin. Technical (Online) Report. The University of Texas at Austin, 11 (2), 1–204.
- Sandoval-Solis, S., McKinney, D.C., and Loucks, D.P., 2011. Sustainability index for water resources planning and management. Water Resources Planning and Management, 137 (September/october), 381–390. doi:10.1061/(ASCE)WR.1943-5452.0000134
- Sarang, A., Vahedi, A., and Shamsai, A., 2008. How to quantify sustainable development: A risk-based approach to water quality management. Environmental Management, 41 (2), 200–220. doi:10.1007/s00267-007-9047-5
- Shilling, F. and Shilling, F., 2014. California Water Sustainability Indicators Framework : Assessment at State and Region Scales Final Report California Water Sustainability Indicators Framework : Assessment at State and Region Scale. California, USA: California Department of Water Resources.
- Sivapalan, M., 2018. From engineering hydrology to Earth system science: milestones in the transformation of hydrologic science. Hydrology and Earth System Sciences, 22, 1665–1693. doi:10.5194/hess-22-1665-2018
- Sivapalan, M., et al., 2014. Socio-hydrology: use-inspired water sustainability science for the Anthropocene. Earth’s Future, 2 (4), 225–230. doi:10.1002/2013EF000164
- Sivapalan, M., Savenije, H.H.G., and Blöschl, G., 2012. Socio-hydrology: A new science of people and water. Hydrological Processes, 26 (8), 1270–1276. doi:10.1002/hyp.8426
- Srdjevic, Z. and Srdjevic, B., 2017. An extension of the sustainability index definition in water resources planning and management. Water Resources Management, 31 (5), 1695–1712. doi:10.1007/s11269-017-1609-6
- State of California, 2019. California water plan [online]. Available from: https://water.ca.gov/ [Accessed 28 March 2019].
- Troy, T.J., Pavao-Zuckerman, M., and Evans, T.P., 2015. Debates-perspectives on socio-hydrology: socio-hydrologic modeling: tradeoffs, hypothesis testing, and validation. Water Resources Research, 51 (6), 4806–4814. doi:10.1002/2015WR017046
- WHO (World Health Organization), 2009. Summary and policy implications vision 2030: the resilience of water supply and sanitation in the face of climate change. France: WHO Library Cataloguing-in-Publication Data.
- Xu, L., et al., 2018. Reframing socio-hydrological research to include a social science perspective. Journal of Hydrology, 563 (May), 76–83. doi:10.1016/j.jhydrol.2018.05.061
- Yustres, Á., et al., 2013. Groundwater resources in the Upper Guadiana Basin (Spain): a regional modelling analysis. Hydrogeology Journal, 21 (5), 1129–1146. doi:10.1007/s10040-013-0987-y