
 ?Mathematical formulae have been encoded as MathML and are displayed in this HTML version using MathJax in order to improve their display. Uncheck the box to turn MathJax off. This feature requires Javascript. Click on a formula to zoom.
ABSTRACT
Accurate modelling of peat water contents (θ) is critical for wetland studies. We modified the Campbell and Van Genuchten soil water retention curves (SWRCs) by replacing their empirical parameters with measurable properties. Combining the water table depth (dWT) into SWRCs, we derived formulae for calculating volumetric θ from dWT, coded in a simple model to test our hypotheses that dWT is a reliable predictor of θ for peat of low and high water holding capacity at near-saturation. We compared our simulations with time-domain reflectometry θ measurements at Mer Bleue bog (Ontario, Canada) and the Western Peatland fen (Alberta, Canada). Constraining Campbell SWRC at extreme drying and waterlogging rather than wilting point and field capacity produced superior results. The Van Genuchten SWRC was approximated by hyperbolic and inverse hyperbolic segments. When simplified, its performance reconciles with that of the modified Campbell SWRC. Overall, our formulae performed well with generalized peat parameters.
Editor A. Fiori Associate editor L. Ruiz
1 Introduction
Northern peatlands store large amounts of carbon (C) over time; estimates of the current stock vary between 200 and 450 Pg globally (Gorham Citation1991, Roulet et al. Citation2007, Loisel et al. Citation2014). This vast C store is sensitive to peat hydrology (Clymo Citation1983, Lafleur et al. Citation2003). Peat water status is critical for C sequestration in plants and soil (Strack et al. Citation2006, Sulman et al. Citation2009), as it affects plant–water relations and productivity (Bubier et al. Citation2003a, 2003Citationb) and microbial activity along aerobic–anaerobic gradients in peat (Lafleur et al. Citation2005a, 2005Citationb). Thus, accurate quantification of soil water contents (θ) in peat and better understanding of their dynamics will improve our understanding of hydrological controls on peatland processes, including microbial respiration, bryophyte and vascular productivity and respiration, net ecosystem exchange of C, and peatland–atmosphere energy exchange (Peichl et al. Citation2014).
However, peatland hydrology is still not well understood largely due to the variability of peat properties and complexity of peat profiles, with sharp transitions between the poorly decomposed top peat with large air-filled porosity that facilitates water infiltration and more decomposed and heavily waterlogged deep peat that impedes drainage (Holden Citation2009, Weber et al. Citation2017a, 2017Citationb). Varying thicknesses of well-aerated peat on top and waterlogged peat below also play a role in the complexity of peatland hydrology. Furthermore, peat from different peatlands, or different zones of the same profile, can differ widely in its near-saturation water holding capacity (Mezbahuddin et al. Citation2016). Peat of low water holding capacity at near-saturation (Cai et al. Citation2010, Sulman et al. Citation2010) rapidly loses water with small water table (WT) drawdowns, while peat of high water holding capacity at near-saturation retains large amounts of water with similar WT fluctuations (Parmentier et al. Citation2009).
1.1 Overview of peat hydrological modelling
Ecohydrological models complement field observations for better understanding of peatland hydrology. Many of them simulate θ by solving the water balance of the ecosystem from incoming precipitation, outgoing evapotranspiration, and incoming and outgoing surface runoff, subsurface lateral and vertical drainage, and recharge. Examples of such models are the Deng and Wang model (Deng and Wang Citation2017), ECOSYS (Grant Citation2001), HYDRUS (Schwarzel et al. Citation2006), FLOCOPS (Kennedy and Price Citation2004), COUP (Jansson and Karlberg Citation2004), ECOUL (Garnier et al. Citation1997), Visual MODFLOW and MODFLOW (McDonald and Harbaugh Citation1988). Many of these models require data-intensive (hourly, daily) continuous meteorological inputs of precipitation, air temperature, relative humidity, and wind speed (Dimitrov et al. Citation2014a, 2014Citationb) that often are not taken at the modelled site, and thus subject to uncertainty. Also, these models require many hydrological and soil parameters, such as saturated hydraulic conductivities that may differ in vertical and lateral directions (Reeve et al. Citation2000), evapotranspiration forcing, aspects and terrain slopes, and largely unknown field boundary conditions (Grant Citation2001). Such parameter values may vary widely among peatlands or even within the same peatland (Fraser Citation1999).
All the above make model calibration of one- and three-dimensional (1D and 3D) ecohydrological models time- and effort-consuming. Furthermore, the empirical parameters that shape the soil water retention curves (SWRCs) (), i.e. the curve-fitting parameter in the hyperbolic Campbell SWRC, or the generally unknown pore distribution and shape parameters in the sigmoidal Van Genuchten SWRC, are derived from observations on specific sites or often as aggregated values from pooled records (Letts et al. Citation2000). These parameters are not measurable quantities, and when applied to other sites they introduce inevitable uncertainties.
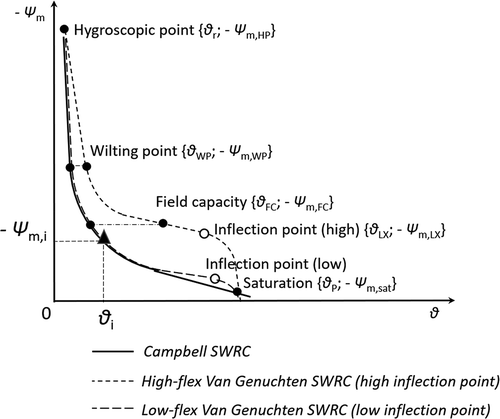
Figure 1. Generalized soil water retention curves (SWRC), hyperbolic Campbell SWRC and sigmoidal Van Genuchten SWRC with high and low inflection points. The Campbell SWRC and low-inflection sigmoidal Van Genuchten SWRC are characteristic for peat of low water retention at near-saturation, while the high-inflection sigmoidal Van Genuchten SWRC is characteristic for peat of high water retention at near-saturation. The key soil parameters that determine the SWRC curves are the pairs of {total porosity (θp); water potential at saturation (–Ψm,sat)}, {water-filled porosity at field capacity (θFC); water potential at field capacity (–Ψm,FC)}, {water-filled porosity at wilting point (θWP); water potential at wilting point (–Ψm,WP)}, {residual soil water content (θr); hydroscopic potential (–Ψm,HC, i.e. the soil matric potential in the air-dry condition)}, and only for Van Genuchten SWRC {water-filled porosity at the inflection point (θLX); water potential at the inflection point (–Ψm,LX)}
Simple ecohydrological models simulate ecosystem hydrology from site-measured water table depth (dWT) used as a model input (Kurbatovam et al. Citation2009, St-Hilaire et al. Citation2010). Peat θ values in these models are reported to be calculated from dWT, interpreted to be the soil matric water potential (Ψm) expressed as height above the WT using linear functions (Zhang et al. Citation2002, Barr et al. Citation2012) or via the Campbell SWRC (Frolking et al. Citation2002). A shortcoming is that these models do not explicitly simulate the dynamics of θ, as observed in the field. Also, such models rarely account for the macropore fraction in peat, which is reported to reach rather large volumetric values in the near-surface layers (Baird Citation1997, Schwarzel et al. Citation2002, Wallage and Holden Citation2011), thus, ultimately affecting the soil water retention and aeration.
1.2 Rationale for revisiting SWRC for peat
Relying upon a simplifying assumption that water in the unsaturated peat is always in equilibrium between gravitational and matric tension due to the high peat porosity, Frolking et al. (Citation2002) suggested a modified version of the original Campbell SWRC function, i.e.:
with
where the soil matric potential is expressed as the difference between dWT (m) and depth di (m) to a soil layer i, Ψm,sat is the air-entry matric potential (m), θi is volumetric soil water content (m3 m−3), θp is the soil total porosity (m3 m−3), and β is an empirical curve-fitting parameter (dimensionless). Their approach allows the calculation of θi directly from the SWRC, thereby avoiding the complexity of calculating water fluxes driven by water potential gradients, constrained by hydraulic conductivities, and subject to continuity of water flow. However, the disadvantages of EquationEquation (1)(1)
(1) are the empirical parameter β obtained by curve-fitting and the restricted applicability only to peat of low water holding capacity at near-saturation. Also, EquationEquation (1)
(1)
(1) does not account for the large peat macropore fractions θM (m3 m−3) declining in depth.
Some ecohydrological process-based models, such as ECOSYS (Grant Citation2001), use a log-transformed version of the Campbell SWRC function (), which allows for the substitution of the empirical β with physically measurable parameters. In particular, ECOSYS sets the log-transformed line of Campbell SWRC by solving for the line slope and intercept by water potentials and water contents at field capacity, Ψm,FC and θFC, and wilting point, Ψm,WP and θWP. The log-transformed Campbell SWRC worked well for peat of low water holding capacity at near-saturation (Dimitrov et al. Citation2010a). However, it was much less accurate for peat with high water holding capacity at near-saturation (Mezbahuddin et al. Citation2016). For this reason, Mezbahuddin et al. (Citation2016) modified ECOSYS to use Van Genuchten SWRC for peat with high water holding capacity while using Campbell SWRC for peat with low water holding capacity. Despite such accommodations, empirical parameters cannot be avoided in the original Van Genuchten SWRC, and setting the log-transformed line of Campbell SWRC between field capacity (Ψm,FC; θFC) and wilting point (Ψm,WP; θWP) proved challenging for peat (Dimitrov et al. Citation2010a). While applicable for mineral soils, where θ varies predominantly between θFC and θWP, θ in peat often varies outside that range, rapidly shifting between the extremes at near saturation and drying, Thus, calculating peat θ in the segments to the right of θFC and to the left of θWP () that are not well defined has greater uncertainty compared to the internal line segment between θFC and θWP.
1.3 Objectives and hypotheses
Our study had three objectives. The first is to develop formulae for simple calculation of peat θ from dWT by modifying the Campbell and Van Genuchten SWRCs to avoid their empirical parameters and replace them by quantifiable physical soil properties that could be measured on site or found in the literature as representative for a variety of site conditions. The second is to code these formulae in a newly developed simple model, named the Peat Hydrological Model (PHM), that reduces the complexity of peat hydrology simulations by calculating dynamic peat θ at any user-specified soil depth from dynamic dWT observations. The third is to test PHM for a variety of peat types and properties, and peatland microtopography forms within the same site and between peatland sites.
The main (conceptual) hypothesis of this study is that dWT, which is closely related to soil volumetric water content, can be a reliable predictor of peat θ at various soil depths, in peat of low and high water holding capacity at near-saturation. The modelling hypothesis implemented by the PHM model is that log-transformed Campbell and Van Genuchten SWRCs corrected for peat macroporosity and parameterized for peat type (i.e. fibric, hemic, and sapric) will improve simulations of peat θ at different depths predicted from daily dWT for a variety of peatland conditions. Therefore, we test the general validity of the simplifying assumption that highly porous unsaturated peat reaches equilibrium within a day (Frolking and Crill Citation1994, Frolking et al. Citation2002). We used PHM to address five specific research hypotheses:
The log-transformed line of the Campbell SWRC in peat of low water holding capacity at near-saturation should be determined by the pairs of soil hydrological parameters that confine its largest hyperbolic segment, i.e. {total porosity (θp); water potential at saturation (Ψm,sat)} and {residual soil water content (θr); hydroscopic potential (Ψm,HC – that is, the soil matric potential in the air-dry condition)} (). Our expectation was that {Ψm,sat; θp} and {Ψm,HC; θr} would determine the Campbell SWRC reasonably well, as these pairs are well constrained for peat θ variation in the curve segments around saturation and drying, as well as in between.
Alternatively, we expected that setting the log-transformed line of Campbell SWRC between field capacity (Ψm,FC; θFC) and wilting point (Ψm,WP; θWP) would be less accurate than setting it between {Ψm,sat; θp} and {Ψm,HC; θr} for peat subject to extreme drying and waterlogging.
The original sigmoidal Van Genuchten SWRC can be approximated by a series of hyperbolic (Campbell-type) segments, starting with an inverse hyperbolic segment confined between {θp; Ψm,sat} and {the water content θLX at the inflection point, i.e. the point at which the change in the direction of curvature occurs; the water potential Ψm,LX at the inflection point}, followed by Campbell-type segments between {θLX; Ψm,LX} and {θFC; Ψm,FC}, {θFC; Ψm,FC} and {θWP; Ψm,WP}, {θWP; Ψm,WP} and {θr; Ψm,HC} (, from right to left). Our expectation was that the modified Van Genuchten SWRC with a high inflection point (high-flex) () would perform well for peat of high water holding capacity at near-saturation.
The modified Van Genuchten SWRC can be further simplified for peat with low water holding capacity at near-saturation by approximation with only two hyperbolic segments, i.e. a relatively small inverse segment between {θp; Ψm,sat} and {θLX; Ψm,LX} on the right, and a relatively large segment to the left from {θLX; Ψm,LX} (). It was expected that both modified Campbell and Van Genuchten with low inflection point (low-flex) SWRCs () would perform well for peat of low water holding capacity at near-saturation.
Generalized peat properties of {θp; Ψm,sat} and {θr; Ψm,HC} for fibric, hemic, and sapric peat, aggregated for different peatlands and reported in independent studies, provide working parameter sets for both the modified Campbell and Van Genuchten SWRCs, which can be applied to different peatlands, peatland microtopographic forms (hummocks, hollows), and types of peat by degree of decomposition (fibric, hemic, sapric).
2 Materials and methods
2.1 Simulating soil water contents in peat
The newly developed formulae for calculating volumetric θi at any position i within the soil profile at a given depth di (m) below the soil surface are developed mathematically in the Supplementary material for this paper. Here we report only the relevant final equations involved in PHM simulations, where all θ, Ψ and d values are given in m3 m−3, MPa, and m, respectively. Following Frolking et al. (Citation2002) at a daily time step, originally based on Frolking and Crill (Citation1994):
Then the hyperbolical Campbell SWRC () was log-transformed and parameterized by {θp; Ψm,sat} and {θr; Ψm,HC}, thereby constrained between extreme drying and waterlogging:
which was modified for peat by plugging in EquationEquation (2)(2)
(2) . Also, the log-transformed hyperbolical Campbell SWRC was parameterized by {θFC; Ψm,FC} and {θWP; Ψm,WP}, and thereby constrained between field capacity and wilting point too:
which was modified for peat by plugging in EquationEquation (2)(2)
(2) .
Unlike the hyperbolical Campbell SWRC, the sigmoidal Van Genuchten SWRC cannot be log-transformed directly to avoid the unknown empirical parameters. Instead, we suggest that its curvature could be approximated by several different hyperbolic segments in the outlined solution below, i.e. between {θr; Ψm,HC} and {θWP; Ψm,WP}, {θWP; Ψm,WP} and {θFC; Ψm,FC}, {θFC; Ψm,FC} and {θLX; Ψm,LX}, and an inverse hyperbolic segment between {θLX; Ψm,LX} and {θp; Ψm,sat} to the right of the inflection point where the curvature changes (). Therefore:
when Ψi is between {θr; Ψm,HC} and {θWP; Ψm,WP}, {θWP; Ψm,WP} and {θFC; Ψm,FC}, {θFC; Ψm,FC} and {θLX; Ψm,LX}, and {θLX; Ψm,LX} and {θp; Ψm,sat}, respectively, which could be further adapted for peat by plugging in EquationEquation (2)(2)
(2) . This method provides an opportunity to reconcile the Campbell SWRC and Van Genuchten SWRC for soil substrate, such as peat of low water holding capacity at near-saturation. For this purpose, the segment confined between {θr; Ψm,HC} and {θLX; Ψm,LX} of the low-flex Van Genuchten SWRC () was approximated as a single hyperbolic segment, i.e.:
when Ψi is between {θr; Ψm,HC} and {θLX; Ψm,LX}, and {θLX; Ψm,LX} and {θp; Ψm,sat}, respectively, which was further adapted for peat by plugging in EquationEquation (2)(2)
(2) . EquationEquations (3
(3)
(3) –6) are all constrained by:
EquationEquations (2(2)
(2) –Equation7
(7)
(7) ) are the same as Equations (S3), (S4a), (S7a), (S9a), (S9b), (S9c), (S9d), (S10a), (S10b) and (S5) in the Supplementary material, respectively. Applying EquationEquations (2)
(2)
(2) , (Equation3
(3)
(3) ), (Equation4
(4)
(4) ), (6) and (Equation7
(7)
(7) ) for peat of low water-holding capacity at near-saturation, and EquationEquations (2)
(2)
(2) , (5) and (Equation7
(7)
(7) ) for peat of high water-holding capacity at near-saturation, θ at any depth is calculated from daily dWT (m). The calculations are computerized by coding these formulae into the simple model code of PHM, written in C++, which reads daily dWT values for periods of simulations and uses pairs of {θr; Ψm,HC}, {θWP; Ψm,WP}, {θFC; Ψm,FC}, {θp; Ψm,sat} and/or {θLX; Ψm,LX} measured on site or reported in the literature to produce output for daily θ at any user-specified depth di. The PHM accounts for θM too, if any macropore fraction occurs at the corresponding di.
2.2 Sites and measurements
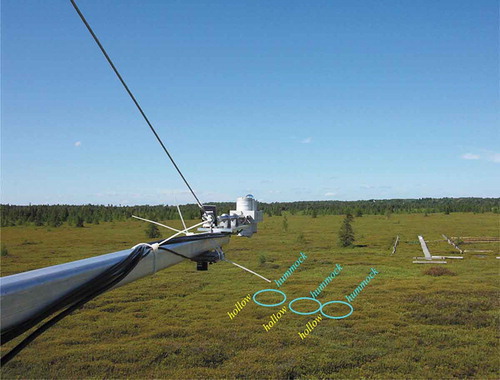
Two sites, Mer Bleue bog, with peat of low water retention at near-saturation (Lafleur et al. Citation2005a, 2005Citationb), and the Western Peatland fen (WPL), with peat of high water retention at near-saturation (Flanagan and Syed Citation2011), were chosen for this study. Mer Bleue bog, located near Ottawa, Ontario, Canada, is an ombrotrophic peatland. It is slightly domed, with peat depth varying from ~0.3 m along the periphery up to ~6 m towards the central part, with an average depth of ~4 m across most of the site. The bog surface has a pronounced hummock–hollow microtopography, with hummocks occupying ~70% and hollows ~30% of the surface area (). Based on Von Post degree of humification, the least decomposed and highly microporous, well-drained fibric peat occupies the upper ~0.35 m in hummocks, and the upper ~0.1 m in hollows. Below the fibric peat, a thin layer of transitional hemic peat spreads across hummocks and hollows between ~0.35 and ~0.45 m depth below the hummock surface. Farther below, the most decomposed, waterlogged sapric peat exists down to the contact with mineral soil.
Figure 2. The hummocky microtopography of Mer Bleue bog, Ontario, Canada. The hummocks of ~1 m mean diameter occupy about 70% of the surface area, alternating with the adjacent hollows which occupy the remaining ~30%, with average difference of ~0.25 m between the top of the hummock domes and the hollow surface
Daily WT was measured at Mer Bleue bog during the period 1998–2004 and varied from ~0.7 m to ~0.25 m below the hummock surface, and from ~0 m to ~0.5 m in hollows. The dWT referenced to the hummock surface was recorded continuously in wells, using a float and counterweight system attached to a potentiometer, and complemented by manual dWT measurements to verify the potentiometer readings (Lafleur et al. Citation2005a, 2005Citationb). The θ was measured continuously at 0.1 and 0.2 m (fibric peat, dry), 0.3 m (fibric peat, wet), 0.4 m (hemic peat) and 0.5 m (sapric peat) below the hummock surface, and 0.03 m (fibric peat) and 0.15 m (hemic peat) below the hollow surface using water content probes (model CS615, Campbell Scientific). The calibration and normalization of the probes for Mer Bleue bog are described in Lafleur et al. (Citation2001, Citation2003, Citation2005a).
The WPL fen is located in the boreal region of Alberta, Canada, about 80 km northeast of the town of Athabasca. Its richer nutrient status resulted in wide range of mosses, e.g. Sphagnum mosses, feather moss, and brown moss, which resulted in more decomposed and less microporous fibric peat, compared to that at Mer Bleue bog, occupying the top 20–30 cm of the hummock domes of ~2 m diameter. The peat depth around the location of the instruments is ~2 m, and daily WT below the average hummock surface was measured in a well using a custom float and counterweight system attached to a potentiometer. Peat θ at 0.075, 0.010 and 0.125 m below the peat surface were measured continuously with water content probes (model CS616, Campbell Scientific) that were previously calibrated in the lab in containers of commercial peat moss held at a range of water contents (Syed et al. Citation2006, Flanagan and Syed Citation2011).
2.3 Model tests and statistics
To address our hypotheses, several model runs were conducted using PHM, each at a daily time step and continuously through the entire time series of available data for Mer Bleue bog (1998–2004) and the WPL fen (2005–2007). A summary of the features of each PHM run is provided in , including the model run name, the type of SWRC and hydrological parameters to constrain it, the type of peat and the site where applied, and the specific hypotheses that each model run was designed to test.
Table 1. Summary of the features of different peat hydrological model (PHM) runs and the hypotheses that they address. SWRC: soil water retention curve, described by a specific equation; period: the entire time series in years throughout which each model run was accomplished continuously at a daily time step: LWHC: low water holding capacity at near-saturation; HWHC: high water holding capacity at near-saturation; Ψm,sat and θp: total porosity and water potential at saturation; Ψm,HC and θr: residual water content and hygroscopic potential; Ψm,FC and θFC: water content and water potential at field capacity; Ψm,WP and θWP: water content and water potential at wilting point; and Ψm,LX and θLX: water content and water potential at inflection point
2.3.1 Simulations for peat of low water holding capacity at near-saturation
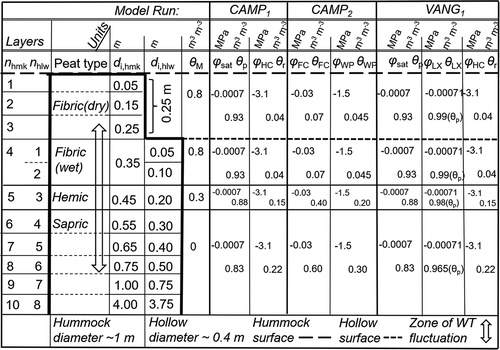
The model runs CAMP1, CAMP2 and VANG1, designed to test Hypotheses 1, 2 and 4 for peat of low water holding capacity at near saturation (), were parameterized, initialized, and run for the peat profiles of hummocks and hollows at Mer Bleue bog (). The hummock and hollow profiles consist of 10 and eight layers, respectively. The peat layers were selected to encompass the profile of the dry fibric peat (the top 25 cm in hummocks and the top 5 cm in hollows), the wet fibric peat (25–35 cm in hummocks, 5–20 cm in hollows), the transitional hemic peat (35–45 cm in hummocks, 10–20 cm in hollows), and the waterlogged sapric peat (below 45 cm in hummocks and below 20 cm in hollows), as well as to capture the zone of WT fluctuations during 1998–2004. For comparison purposes, the peat stratigraphy in was also set to be consistent with previous modelling studies at the same site (Dimitrov et al. Citation2010a, Citation2010b).
Figure 3. Schematic representation of Mer Bleue bog peat profile, with alternating hummocks (hmk) and hollows (hlw). nhmk and nhlw: numbers of soil layers in hummocks and hollows; di,hmk and di,hlw: depths to soil layer bottom (with respect to hummock and hollow surfaces); θM: volumetric macropore fraction; Ψm,sat: water potential at saturation; θp: total porosity; Ψm,HC: hydroscopic potential (i.e. the soil matric potential in the air-dry condition); θr: residual soil water content; Ψm,FC and θFC, and Ψm,WP and θWP: the water potentials and water contents at field capacity and wilting point, respectively; and Ψm,LX and θLX: water potential and water content at the inflection point (i.e. where change in the direction of curvature of the water retention curve occurs). The peat hydrological parameters are assigned accordingly to the model runs CAMP1 and CAMP2 (modified Campbell soil water retention curve), and VANG1 (modified Van Genuchten soil water retention curve)
The alternating wetter and drier years in the 1998–2004 period at Mer Bleue bog provided an opportunity to examine how well the PHM performed during a sequence of hydrologically diverse years, including the year 2000 with the highest average and minimum annual dWT of 0.36 and 0.45 m, respectively, then 2002 with the lowest average and minimum annual dWT of 0.46 and 0.74 m, respectively. The short-term model response to rainfall was tested against measured θ and dWT following an extreme rain event of 124.5 mm on 9 September 2004. Simulated θ by CAMP1, CAMP2 and VANG1 were compared with observed values at depths of 0.1, 0.2, 0.3, 0.4 and 0.5 m in hummocks, and 0.03 and 0.15 m in hollows. The model performance of VANG1 and CAMP2 was compared against that of CAMP1.
2.3.2 Simulations for peat of high water holding capacity at near-saturation
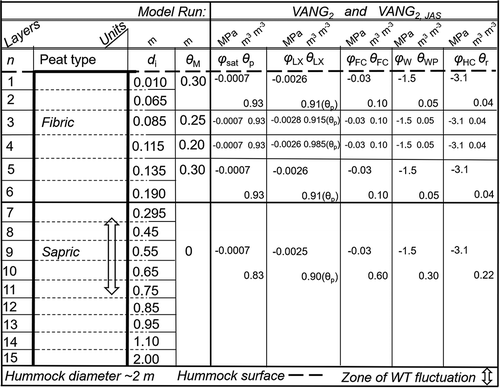
The model runs VANG2 and VANG2,JAS, i.e. the version of VANG2 only for the months of June, July and August to avoid the effects of spring thaw and/or fall freeze not currently handled by PHM, were designed to test Hypothesis 3 for peat of high water holding capacity at near saturation () and were parameterized, initialized, and run for peat (only hummock available) at the WPL fen (). The hummock peat profile (no available data for hollows) consists of 15 layers and was set to encompass the profile of the fibric peat (the top 19 cm), and the waterlogged sapric peat (below 45 cm in hummocks and below 20 cm in hollows), as well as to capture the zone of WT fluctuations during that period. The peat stratigraphy is consistent with previous studies conducted to simulate the hydrology of the same site (Mezbahuddin et al. Citation2016). The 2005–2007 period at the WPL fen provided an opportunity to examine PHM’s ability to simulate seasonal and inter-annual θ dynamics during a sequence starting with the wet year 2005 with the highest average and minimum annual dWT (0.34 m and 0.38 m), followed by the average year 2006 with moderate average and minimum annual dWT (0.42 m and 0.53 m), and then the dry year 2007 with low average and minimum annual dWT (0.53 m and 0.65 m). Simulated θ by VANG2 and VANG2,JAS were compared with observed values at depths of 0.075, 0.010 and 0.0125 m.
Figure 4. Schematic representation of Western Peatland fen peat profile (hummocks). n: number of soil layer; di: depth to soil layer bottom (with respect to hummock surface); θM: volumetric macropore fraction; Ψm,sat: water potential at saturation; θp: total porosity; Ψm,HC: hydroscopic potential (i.e. the soil matric potential in the air-dry condition); θr: residual soil water content; Ψm,FC and θFC, and Ψm,WP and θWP: the water potentials and water contents at field capacity and wilting point, respectively; and Ψm,LX and θLX: water potential and water content at the inflection point (i.e. where change in the direction of the curvature of the water retention curve occurs). The peat hydrological parameters are assigned accordingly to the model runs VANG2 and VANG2,JAS (modified Van Genuchten soil water retention curve)
2.3.3 Testing the validity of generalized sets of peat properties
Hypothesis 5 was tested with CAMP1, VANG1, VANG2 and VANG2,JAS model runs applied for different peatlands, microtopographic forms and types of peat using generalized values () aggregated from independent research on peat from different sites (). The θp and θr values for the fibric, hemic and sapric peat were taken from Letts et al. (Citation2000). The values of Ψm,sat were taken from the same literature source; however, they were slightly modified to reconcile Ψm,sat and Van Genuchten α values in fibric peat, where hydrological changes and θ measurements were most frequent, given that α = 1/Ψm,sat (Mezbahuddin et al. Citation2016). We paired to θr the general value of soil matric potential in the air-dry condition (hydroscopic coefficient) Ψm,HC (Thien and Graveel Citation2003). The other parameters in and were aligned with previous modelling studies on Mer Bleu bog (Dimitrov et al. Citation2010a, Citation2010b) and WPL fen (Mezbahuddin et al. Citation2016).
2.3.4 Statistics of model–data comparisons
To evaluate performance of each model run and to compare runs, linear regressions of simulated θ (y-axis) on observed θ (x-axis) and model accuracy statistics were obtained at depths of 0.1, 0.2, 0.3, 0.4 and 0.5 m in hummocks, and 0.03 and 0.15 m in hollows at Mer Bleue bog, and at depths of 0.075, 0.100 and 0.125 m in hummocks at WPL fen. The overall model accuracy was addressed by the root mean square error (RMSE) between simulations and observations and its systematic (RMSEs) and unsystematic (RMSEu) components (Willmott Citation1981). The RMSE is a measure of the average difference between observed and modelled values, expressed as follows (Ritter and Munoz-Carpena Citation2013):
where Pi and Oi represent the sample (of size n). The relative discrepancies between observations and simulations were evaluated by Willmott’s index of agreement d, which represents the relative model accuracy with respect to the magnitude of observed values, as follows (Willmott Citation1982):
where 0 ≤ d ≤ 1 and is the average of the observed values. In addition, the Nash-Sutcliffe efficiency coefficient was calculated to assess the model’s predictive power, as follows (Krause et al. Citation2005):
Further to the above, the 95% confidence intervals (CI95%) were evaluated for RMSE and NSE by applying the statistical hydrological software FITEVAL (Ritter and Munoz-Carpena, Citation2013, 2020).
Model runs CAMP1, VANG1 and CAMP2 for Mer Bleue bog were evaluated for their individual performance and then compared with each other. Also, the model runs VANG2 and VANG2,JAS (only for the months of July, August, September) for the WPL fen were evaluated for their performance and compared with each other, to avoid the complicating effects of spring thawing on θ in the peat of high water holding capacity at near-saturation that are not currently handled by PHM.
3 Results
3.1 Modelling the hydrology of peat of low water holding capacity at near-saturation
3.1.1 Simulations by modified Campbell SWRC constrained at extreme drying and waterlogging (CAMP1), and simplified Van Genuchten SWRC (VANG1)
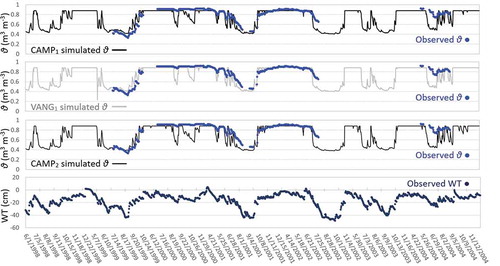
Both CAMP1 and VANG1 simulated closely seasonal and inter-annual dynamics of θ in hummocks at depth of 0.1, 0.2, 0.3, 0.4 and 0.5 m below the hummock surface () and in hollows at depth of 0.03 and 0.15 m below the hollow surface (), all of them reflecting the WT dynamics. Both runs captured changes in θ at 0.2 m () and its pronounced dynamics at 0.3 m (), with peaks between June and August 2000, April and May 2001, April, May and July 2002, May and June 2003, and to a lesser extent between April and June 2004 associated with large dWT fluctuations. Both CAMP1 and VANG1 followed closely the observed θ at 0.4 m, thereby capturing the magnitude and dynamics of θ with WT drawdown during the summer (). In addition, the model runs captured the magnitude of summer drop in θ at 0.5 m while maintaining conditions close to saturation in agreement with observations for most of the time series (). In addition, both CAMP1 and VANG1 captured θ dynamics in the upper dry hollow peat at the very top 0.03 m with pronounced peaks between June and July 2000, April and May 2001, April, May and July 2002, and May and June 2003 (). They also captured the θ dynamics in the deeper wet peat at 0.15 m with pronounced summer drawdowns (). Both runs performed better compared to previous modelling studies at the same site during the spring thaw and summer drought (see Dimitrov et al. Citation2010a, ).
Figure 5. Daily simulated and observed soil water contents (θ) at 10 cm depth in hummocks and daily observed water table (WT) depths referred to the hummock surface at Mer Bleue bog. Simulated θ by CAMP1, VANG1, and CAMP2 model runs were driven by the available observed daily WT records during the period 1998–2004
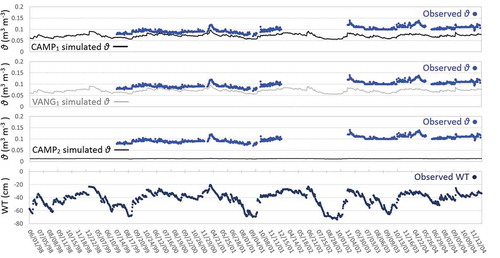
Figure 6. Daily simulated and observed soil water contents (θ) at 20 cm depth in hummocks and daily observed water table (WT) depths referred to the hummock surface at Mer Bleue bog. Simulated θ by CAMP1, VANG1, and CAMP2 model runs were driven by the available observed daily WT records during the period 1998–2004
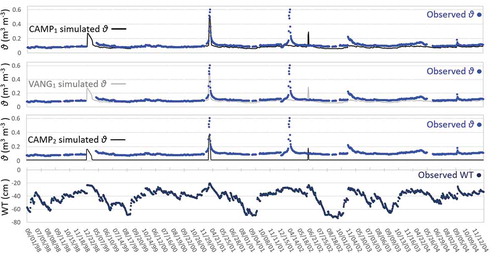
Figure 7. Daily simulated and observed soil water contents (θ) at 30 cm depth in hummocks and daily observed water table (WT) depths referred to the hummock surface at Mer Bleue bog. Simulated θ by CAMP1, VANG1, and CAMP2 model runs were driven by the available observed daily WT records during the period 1998–2004
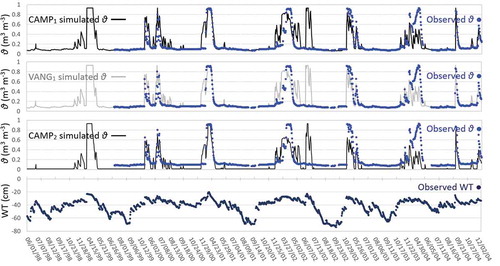
Figure 8. Daily simulated and observed soil water contents (θ) at 40 cm depth in hummocks and daily observed water table (WT) depths referred to the hummock surface at Mer Bleue bog. Simulated θ by CAMP1, VANG1, and CAMP2 model runs were driven by the available observed daily WT records during the period 1998–2004
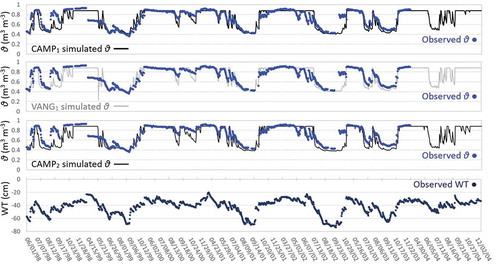
Figure 9. Daily simulated and observed soil water contents (θ) at 50 cm depth in hummocks and daily observed water table (WT) depths referred to the hummock surface at Mer Bleue bog. Simulated θ by CAMP1, VANG1, and CAMP2 model runs were driven by the available observed daily WT records during the period 1998–2004
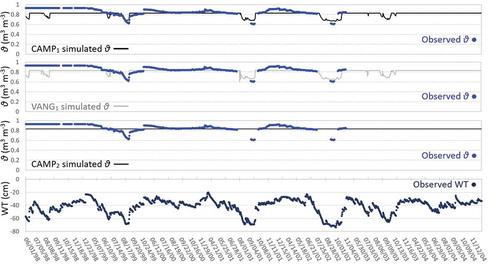
Figure 10. Daily simulated and observed soil water contents (θ) at 3 cm depth in hollows and daily observed water table (WT) depths referred to the hollow surface at Mer Bleue bog. Simulated θ by CAMP1, VANG1, and CAMP2 model runs were driven by the available observed daily WT records during the period 1998–2004
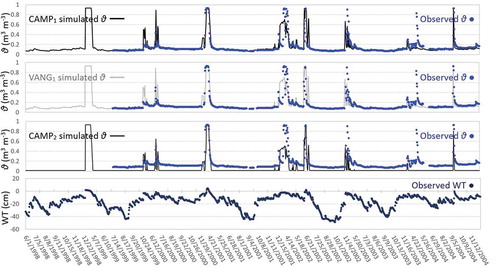
Figure 11. Daily simulated and observed soil water contents (θ) at 15 cm depth in hollows and daily observed water table (WT) depths referred to the hollow surface at Mer Bleue bog. Simulated θ by CAMP1, VANG1, and CAMP2 model runs were driven by the available observed daily WT records during the period 1998–2004
The most intensive rain event in the 1998–2004 period produced 124.5 mm over 24 h at Mer Bleue bog on September 9 in 2004. Consistent with observations, CAMP1 and VANG1 captured the timing and magnitude of θ changes at depth, i.e. the slight peak in hummock θ at 0.2 m () caused by the rainfall, and rapid waterlogging to full saturation at 0.3 m during and immediately after the rainfall (), which was coincident with an immediate rise and gradual decline of dWT. Faster drawdown of simulated θ at 0.3 m compared to observations was possibly due to slightly higher water retention in the field, which might be due to some peat hysteresis effects that PHM does not account for at present.
Various statistics for both CAMP1 and VANG1 of observed on modelled daily θ at 0.1 m, 0.2, 0.3, 0.4 and 0.5 m in hummocks, and 0.03 and 0.15 m in hollows are given in , along with their CI95% values. All linear regressions were significant at α = 0.05 with p < 2e-16 (). At 0.1 m depth in hummocks, R2 = 28% indicated that 28% of variation in θ observations was explained. The slope and intercept indicated that simulations matched the observations with no pronounced bias. Although the RMSE between 0.02 and 0.03 was low, the low values of θ in highly macroporous dry fibric peat resulted in relatively small differences between the average observed θ and observed and simulated values, which in turn resulted in a relatively smaller denominator with respect to the numerator in EquationEquation (8b)(8b)
(8b) , hence low d (0.31). Systematic underestimation of θ by both CAMP1 and VANG1 resulted in a large sum of squares, hence a large numerator and negative NSE values in EquationEquation (8c)
(8c)
(8c) . However, the relatively small RMSEu and higher RMSEs approaching RMSE indicated that model parameterization would need improvement rather than model formulae. At 0.2 m depth in hummocks, slopes and intercepts indicated that CAMP1 and VANG1 were unbiased and explained almost half of the variation of θ observations with R2 = 0.46. Compared to 0.1 m depth, greater d (0.71) indicated that both runs followed observations even more closely. The NSE become positive with the upper limits of its CI95% of 0.76, reaching the zone of satisfactory model performance (Moriasi et al. Citation2007, Ritter and Munoz-Carpena Citation2013). The relatively small values of RMSE between 0.02 and 0.06 and its systematic and unsystematic components indicated good model accuracy.
Table 2. Linear regressions of simulated values on measured daily volumetric soil water contents (m3 m−3), Willmott’s index of agreement (d), root mean square error (RMSE), its systematic and unsystematic components (RMSEs and RMSEu) and Nash-Sutcliffe efficiency (NSE) at depths of 0.1, 0.2, 0.3, 0.4 and 0.5 m in hummocks, and 0.03 and 0.15 m in hollows at Mer Bleue bog over the 1998–2004 period. All regressions are significant at α = 0.05 (p < 2e-16). CI95% indicates the 95% confidence interval. N: number; R2: coefficient of determination
In the zone of greatest WT fluctuations in wet fibric peat at 0.3 m in hummocks, both CAMP1 and VANG1 followed closely the observations explaining >50% of their variation (R2 = 0.51). While RMSE variation between 0.11 and 0.22 (CAMP1) or 0.23 (VANG1) was greatest at that depth, the d went up to 0.84, indicating improved model performance compared to 0.1 and 0.2 m depths above. Furthermore, NSE = 0.6 with its upper limits of CI95% of 0.78 (CAMP1) or 0.77 (VANG1) were > 0.5, thus indicating satisfactory model performance at that depth (Moriasi et al. Citation2007). At 0.4 m depth, the PHM performance improved further compared to the depths above, with lower RMSE and RMSEu, d > 0.9, and NSE > 0.65 with upper limits of CI95% > 0.8, thereby indicating good model performance (Ritter and Munoz-Carpena Citation2013). The CAMP1 and VANG1 explained ~75% of the variation of θ observations with R2 of 0.75 (CAMP1) or 0.74 (VANG1). Relatively large RMSEs for both runs implied the potential to improve the PHM performance at 0.3 m and 0.4 m in hummocks by improving the model parameterization, especially with {θLX; Ψm,LX} at inflection points (). The smaller WT variation in peat at 0.5 m in hummocks that is predominantly at near saturation resulted in lower R2, d, and NSE values, compared to those at 0.3 m and 0.4 m, although the slopes approached unity and intercepts were near zero for both model runs. Both CAMP1 and VANG1 performed comparatively well at hollows for fibric peat at 0.03 m and hemic peat at 0.15 m with R2 ≥ 0.65, d values of 0.89, and NSE values > 0.6 or 0.7, respectively, indicating satisfactory model performance (Moriasi et al. Citation2007, Ritter and Munoz-Carpena Citation2013).
3.1.2 Simulations by modified Campbell SWRC constrained at wilting point and field capacity (CAMP2)
The PHM run CAMP2 with Mer Bleue data was conducted to show the effects of parameterizing PHM with Ψ and θ at field capacity and wilting point in peat of low water holding capacity at near-saturation, instead of Ψ and θ at waterlogging and extreme drying used to parameterize PHM for CAMP1 (). During the entire period 1998–2004, CAMP2 underestimated θ of dry fibric peat at 0.1 and 0.2 m in hummocks () and at 0.03 m in hollows (), while maintaining permanently waterlogged conditions at 50 cm depth in hummocks (). However, CAMP2 performed well in the intermediate zone of wet fibric peat at 0.3 m in hummocks () and 0.15 m in hollows (), as well as in lower hemic peat at 0.4 m in hummocks (). For predominantly dry fibric peat at 0.1 m in hummocks and 0.03 m in hollows, and for predominantly waterlogged sapric peat at 0.5 m in hummocks, where θ often varied outside of the range between field capacity and wilting point, CAMP2 performed much worse than CAMP1. CAMP1 was also better able to capture the extremely low and high θ in both near-surface and deep peat. At 0.4 m in hummocks and 0.15 m in hollows, where θ usually varied between field capacity and wilting point, CAMP2 performed similarly to CAMP1.
Linear regressions suggested that CAMP2 performed comparably well to CAMP1 at 0.3 and 0.4 m in hummocks, as well as at 0.03 and 0.15 m in hollows, i.e. within the zone of pronounced WT fluctuations and θ varying greatly between the wilting point and field capacity (). However, the slopes and intercepts for CAMP2 showed strong biases for θ in hummocks at 0.1 and 0.2 m (underestimating observations), and at 0.5 m (overestimating observations). The corresponding RMSE and d values indicated low model accuracy at those depths. On the other hand, much higher RMSEs values compared to RMSEu (similar to RMSEu of CAMP1) indicated that the model–data misfit was mostly due to inappropriate model parameterization by {θWP; Ψm,WP} and {θFC; Ψm,FC}, instead of {θr; Ψm,HC} and {θp; Ψm,sat}, which worked well in CAMP1. The latter was confirmed by generally low NSE values that were <0.5, except at 0.4 m depth in hummocks, where NSE = 0.53, indicating unsatisfactory CAMP2 model performance (Moriasi et al. Citation2007, Ritter and Munoz-Carpena Citation2013).
3.2 Modelling hydrology of peat of high water holding capacity at near-saturation (VANG2 and VANG2,JAS)
The PHM runs VANG2 and its June, July and August version VANG2,JAS closely simulated the observed seasonal and inter-annual dynamics of θ in WPL hummocks at depths of 0.075, 0.1 and 0.125 m below the hummock surface and associated WT fluctuations during 2005–2007 (). Specifics of local peat properties at these depths () produced slightly more waterlogged conditions at 0.1 m than above (0.0075 m) and below (0.125 m), which was captured in simulations of θ at the corresponding depths. Inconsistencies in VANG2 performances were mainly associated with periods of spring thaw and excessive evapotranspiration with summer drying in the field, as currently PHM does not simulate freeze–thaw cycles or evapotranspiration. The lack of simulated freeze–thaw cycles was partially compensated by VANG2,JAS, which is a VANG2 version confined to June, July and August.
Figure 12. Daily simulated and observed soil water contents (θ) at different depths in hummocks and daily observed water table (WT) depths referred to the hummock surface at Western Peatland fen. (a) Simulated θ by VANG2 model run were driven by the available observed daily WT records during the period 2005–2007. (b) Simulated θ by VANG2,JAS model runs were driven by the available observed daily WT records only in June, July and August during the period 2005–2007
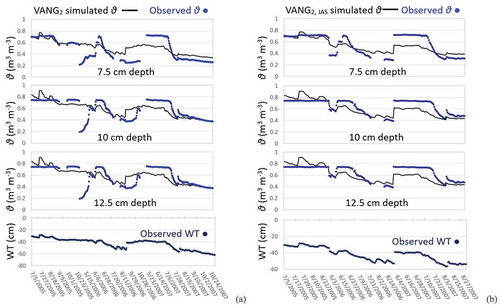
The linear regressions for VANG2 of observed on modelled daily θ at 0.075, 0.1 and 0.125 m were significant at α = 0.05, p < 2e-16 (). The R2, slope, and intercept at 0.0075 and 0.125 m indicated that the simulations were unbiased and explained >33% of variation in θ observations. The 0.1 m depth had a lower R2 and higher RMSEs, possibly a result of local peat stratigraphic inconsistencies (), which produced some uncertainty in model parameterization at that depth compared to the peat above and below. Eliminating the effects of spring thaw in VANG2.JAS resulted in pronounced improvement of model–observation statistics compared with VANG2. The d values increased from ~0.70 to ~0.80 and the RMSE and RMSEu decreased, indicating improved model accuracy. For VANG2, NSE was 0.42 (>0.4) at 0.075 m depth and 0.37 (>0.36) at 0.125 m depth, which according to some sources is acceptable (Ramanarayanan et al. Citation1997, Motovilov et al. Citation1999). However, the NSE values for all three soil depths improved for VANG2,JAS and were above the widely accepted threshold of 0.5 (Moriasi et al. Citation2007). Furthermore, their upper CI95% boundaries indicated PHM abilities for good (>0.8) and very good (>0.9) model performance (Ritter and Munoz-Carpena Citation2013).
Table 3. Linear regressions of simulated values on measured daily volumetric soil water contents (m3 m−3), Willmott’s index of agreement (d), root mean square error (RMSE), its systematic and unsystematic components (RMSEs and RMSEu) and Nash-Sutcliffe efficiency (NSE), at depths of 0.075, 0.100 and 0.125 m in hummocks at Western Peatland fen over the 2005–2007 period. All regressions are significant at α = 0.05 (p < 2e-16). CI95% indicates the 95% confidence interval. N: number; R2: coefficient of determination
4 Discussion
4.1 Comparison to previous modelling work
The PHM with modified Campbell and Van Genuchten SWRCs, parameterized at waterlogging and extreme drying (CAMP1 and VANG1), performed similarly to or better than ECOSYS’s 3D ecohydrological model previously tested at Mer Bleue bog hummocks for 1998–2004 ( in this paper vs in Dimitrov et al. Citation2010a); there were no reported statistics for the performance of ECOSYS in hollows. ECOSYS parameterized at field capacity and wilting point partially offset the excessive drying effects in near-surface peat by explicit modelling of the evapotranspiration drag, thereby maintaining higher θ within the top peat compared to PHM (CAMP2). Previous modelling studies on hydrology of the WPL fen employing ECOSYS (Mezbahuddin et al. Citation2016) did not explicitly report the statistics for model–data fit. Instead, R2, d and RMSE values were bar-plotted for each year in the 2005–2007 period, which makes direct comparison to PHM (VANG2) statistics impossible. However, R2, d, RMSE, and RMSEu values of VANG2 and especially VANG2,JAS () fit within the range of the corresponding ECOSYS statistics.
4.2 Implications for SWRC of organic and mineral soils
Our newly developed formulae for modified Campbell and Van Genuchten SWRCs avoid the shape parameters β in EquationEquation (3)(3)
(3) and α and n in Equations (5) and (6) by using pairs of measurable hydrological parameters, i.e. {Ψm,sat; θp}, {Ψm,LX; θLX},{Ψm,FC; θFC}, {Ψm,WP; θWP}, {Ψm,WP; θWP} and {Ψm,HC; θr}. Thus, our formulae avoid complicated curve fitting for other sites that adds uncertainties to θ calculations. The generality of EquationEquation (3)
(3)
(3) for the modified Campbell SWRC, and Equations (5) and (6) for the modified Van Genuchten SWRC and its simplified version, should be applicable for mineral soils too. The validity of EquationEquations (3)
(3)
(3) , (5) and (6) for mineral soils could be tested directly vs {Ψ; θ} observations. Our formulae can further be tested for modelling soil water retention in 1D or 3D hydrological schemes of process-based models. The modified Van Genuchten SWRC, i.e. Equation (5), provides a new perspective for describing more complex SWRCs by introducing more inflection points, thereby creating even smaller sections if field data suggests they are necessary. Alternating hyperbolic and reverse hyperbolic segments would describe a variety of SWRC shapes (Kutilek and Nielsen Citation1994). This also implies that there is potential to expand application of our modified SWRCs, i.e. EquationEquations (3)
(3)
(3) and (5), to non-homogeneous soil substrates, reclamation substrates that are often designed as mixtures of alternating organic and mineral soil layers (Daly et al. Citation2012, Wytrykush et al. Citation2012).
4.3 Advantages and uncertainties for peatland ecosystem modelling
The newly introduced PHM is a simple model for simulating peat water contents at any depth from field WT records, by applying either the Campbell or Van Genuchten SWRC, i.e. EquationEquations (3)(3)
(3) , (5) and (6). The PHM functions well with generalized and site-specific peat hydrological parameters () and could be a reasonable substitution for more complex 1D and 3D hydrological schemes in ecohydrological modelling of peatlands. Compared to these more complex models, PHM is less data-intensive and is computationally more efficient. These economies are achieved largely by omitting variable parameters, such as saturated hydraulic conductivities, that vary in vertical and horizontal directions; terrain slopes and aspects; and largely unknown lateral and vertical field boundary conditions. In addition, PHM does not require as many meteorological input drivers as the complex process-based models do. Instead, available dWT records and general peat parameters drive calculations of peat θ. Thus, PHM is applicable at large spatial scales and at many geographical locations, indicative of national and international wetland databases (Zoltai et al. Citation2000, Loisel et al. Citation2014) for which continuous (for dynamic simulations) or sporadic (for static estimations) WT records exist.
A limitation of PHM for large-scale spatial application is the lack of WT observations for many peatlands. However, the PHM could also be driven by dWT estimated from large-scale satellite or airborne imagery (Kalacska et al. Citation2018) or provided by open-source web-based collections. The simple data requirements of PHM warrant its potential to easily connect to big data sets provided by open application programming interface (API) sources, which makes the model suitable for large-scale scientific simulations that benefit from rapid development of new information technologies and web applications.
Other current limitations of PHM are the lack of explicit processes for evapotranspiration, freeze–thaw, and summer drying. Even though their effects are partially captured in declining and rising WT levels, there is clearly a need for special treatment of these processes, as well as to introduce peat hysteresis, elasticity, and plasticity, in the next stage of the model’s development. The PHM performance for the upper peat of low water holding capacity at near-saturation at Mer Bleue bog was relatively less sensitive to spring thaw and summer droughts, compared to the WPL. This difference could be attributed to the smaller water holding capacity per unit volume of Mer Bleue fibric peat, with its smaller matrix and larger macropore volumetric fractions, compared to the WPL peat (). An inherent uncertainty for all models is estimating peat macroporosity (Dimitrov et al. Citation2010a). Although peat macroporosities have been studied for open bogs (Blodau and Moore Citation2002), blanket peatlands (Holden Citation2009), and forested peatlands (Silins and Rothwell Citation1998), few studies report the macropore volumetric fractions distribution in fibric, hemic, and sapric peat. It has been shown that quantifying macropore fractions solely by size is rather arbitrary, while quantifying by water potential at preferential gravitational flow might be site-specific and generally uncertain (Skopp Citation1981, Baird Citation1997).
5 Conclusion
This study supported the main hypothesis that the WT level, as a focal point of all inputs and outputs of the hydrological balance, can be a reliable predictor of water contents at any depth in peats with low and high water holding capacity at near-saturation. The original Campbell and Van Genuchten SWRCs can be modified mathematically to avoid computationally expensive and site-specific curve-fitted parameters, which can be replaced by measurable hydrological properties reconciled for typical peat profiles. The modified Campbell SWRC constrained at excessive drying and waterlogging provided superior results when applied for peat of low water holding capacity at near-saturation (Hypothesis 1), compared to when constrained at field capacity and wilting point (Hypothesis 2). It was found that the field capacity and wilting point do not adequately constrain the Campbell SWRC hyperbola for the highly porous and dry fibric peat at near-surface and waterlogged sapric peat at depth. The sigmoidal Van Genuchten SWRC approximated by a series of inverse hyperbolic and hyperbolic segments was applicable to and performed well for peat of high water holding capacity at near-saturation (Hypothesis 3). When further simplified by means of only two segments, i.e. one small inverse hyperbolic to saturation and another large hyperbolic segment to excessive drying, the performance of the modified Van Genuchten SWRC for the peat of low water holding capacity at near-saturation was almost indiscernible from that of the Campbell SWRC (Hypothesis 4). New formulae for calculating peat water contents at any depth from WT depth have been developed and coded in a simple model for peat hydrology that works reasonably well for different types of peat and peatland sites. The new formulae performed well against independent field measurements for different peatland sites, when parameterized by generalized peat properties (Hypothesis 5), and may be applicable for large-scale simulations and soil substrate with diverse SWRC specifics.
Supplemental Material
Download PDF (379.3 KB)Acknowledgements
Data were collected with funding from Canadian Carbon Program and Fluxnet Canada Research Network (FCRN) through its major sponsors the Natural Sciences and Engineering Council of Canada (NSERC), Canadian Foundation for Climate and Atmospheric Sciences, and BIOCAP Canada. The authors are greatly thankful to Prof. Lawrence B. Flanagan of the University of Lethbridge for sharing the hydrological data collection at Western Peatland fen. Also, the authors are thankful to Alberta Innovation and Advanced Education to Campus Alberta Innovation Program (CAIP) Research Chair (No.RCP-12-001-BCAIP) Prof. Junye Wang and Dean of Science and Technology at Athabasca University Prof. Lisa Carter for their support of the preliminary stages of this work. Furthermore, the authors wish to thank one anonymous reviewer and the associate editor for their detailed and useful comments and suggestions that resulted in improvement of this manuscript.
Disclosure statement
No potential conflict of interest was reported by the authors.
Supplementary material
Supplemental data for this article can be accessed here.
References
- Baird, A.J., 1997. Field estimation of macropore functioning and surface hydraulic conductivity in a fen peat. Hydrological Processes, 11 (3), 287–295. doi:10.1002/(SICI)1099-1085(19970315)11:3<287::AID-HYP443>3.0.CO;2-L
- Barr, A.G., et al., 2012. Energy balance closure at the BERMS flux towers in relation to the water balance of the White Gull Creek watershed 1999–2009. Agricultural and Forest Meteorology, 153, 3–13. doi:10.1016/j.agrformet.2011.05.017
- Blodau, C. and Moore, T.R., 2002. Macroporosity affects water movement and pore water sampling in peatland microcosms. Soil Science, 167, 98–109. doi:10.1097/00010694-200202000-00002
- Bubier, J., et al., 2003a. Spatial and temporal variability in growing season net ecosystem carbon dioxide exchange at a large peatland in Ontario, Canada. Ecosystems, 6, 353–367.
- Bubier, J., et al., 2003b. Peatland responses to varying interannual moisture conditions as measured by automatic CO2 chambers. Global Biogeochemical Cycles, 17 (2), 1066. doi:10.1029/2002GB001946
- Cai, T., Flanagan, L.B., and Syed, K.H., 2010. Warmer and drier conditions stimulate respiration more than photosynthesis in a boreal peatland ecosystem: analysis of automatic chambers and eddy covariance measurements. Plant, Cell & Environment, 33, 394–407. doi:10.1111/j.1365-3040.2009.02089.x
- Clymo, R.S., 1983. Peat. In: A.J.P. Gore, ed. Ecosystems of the World, Vol. 4A, Mires: swamp, Bog, Fen and Moor general studies. Amsterdam: Elsevier, 159–224.
- Daly, C., et al., 2012. Initiatives in oil sand reclamation. Considerations for building a fen peatland in a post-mined oil sands landscape. In: D.H. Vitt and J.S. Bhatti, eds. Restoration and reclamation of boreal ecosystems: attaining sustainable development. Cambridge, UK: Cambridge University Press, 179–201.
- Deng, B. and Wang, J., 2017. Saturated-unsaturated groundwater modelling using 3D Richards equation with a coordinate transform of nonorthogonal grids. Applied Mathematical Modelling, 50, 39–52. doi:10.1016/j.apm.2017.05.021
- Dimitrov, D.D., Bhatti, J.S., and Grant, R.F., 2014a. The transition zones (ecotone) between boreal forests and peatlands: ecological controls on ecosystem productivity along a transition zone between upland black spruce forest and a poor forested fen in central Saskatchewan. Ecological Modelling, 291, 96–108. doi:10.1016/j.ecolmodel.2014.07.020
- Dimitrov, D.D., Bhatti, J.S., and Grant, R.F., 2014b. The transition zones (ecotone) between boreal forests and peatlands: modelling water table along a transition zone between upland black spruce forest and poor forested fen in central Saskatchewan. Ecological Modelling, 274, 57–70. doi:10.1016/j.ecolmodel.2013.11.030
- Dimitrov, D.D., et al., 2010a. Modelling subsurface hydrology of Mer Bleue bog. Soil Science Society of America Journal, 74 (2), 680–694. doi:10.2136/sssaj2009.0148
- Dimitrov, D.D., et al., 2010b. Modelling the effects of hydrology on ecosystem respiration at Mer Bleue bog. Journal of Geophysical Research - Biogeosciences, 115, G04043. doi:10.1029/2010JG001312
- Flanagan, L.B. and Syed, K.H., 2011. Stimulation of both photosynthesis and respiration in response to warmer and drier conditions in a boreal peatland ecosystem. Global Change Biology, 17, 2271–2287. doi:10.1111/j.1365-2486.2010.02378.x
- Fraser, C.J.D., 1999. The hydrology and dissolved organic carbon (DOC) biogeochemistry in a boreal peatland. Thesis (MSc). McGill University.
- Frolking, S. and Crill, P.M., 1994. Climate controls on temporal variability of methane flux from a poor fen in southeastern New Hampshire: measurement and modeling. Global Biogeochemical Cycles, 8, 385–397. doi:10.1029/94GB01839
- Frolking, S., et al., 2002. Modelling the seasonal to annual carbon balance of Mer Bleue bog, Ontario, Canada. Global Biogeochemical Cycles, 16 (3), 1030. doi:10.1029/2001GB001457
- Garnier, P., et al., 1997. Numerical model of 3-dimensional anisotropic deformation and 1-dimensional water flow in swelling soil. Soil Science, 162, 410–420. doi:10.1097/00010694-199706000-00003
- Gorham, E., 1991. Northern peatlands: role in the carbon balance and probable responses to climatic warming. Ecological Applications, 1, 182–195. doi:10.2307/1941811
- Grant, R.F., 2001. A review of the Canadian ecosystem model ECOSYS. In: M. Shaffer, ed. Modeling carbon and nitrogen dynamics for soil management. Boca Raton, FL: CRC Press, 173–264.
- Holden, J., 2009. Flow through macropores of different size classes in blanket peat. Journal of Hydrology, 364 (3–4), 342–348. doi:10.1016/j.jhydrol.2008.11.010
- Jansson, P.-E. and Karlberg, L., 2004. CoupModel - Coupled heat and mass transfer model for soil–plant–atmosphere system. TRITA-LWR report, 3087. Stockholm, Sweden: Royal Inst. of Technol., Dept. of Land and Water Resources Engineering, 427.
- Kalacska, M., et al., 2018. Estimating peatland water table depth and net ecosystem exchange: a comparison between satellite and airborne imagery. Remote Sensing, 10 (5), 687. (License. CC BY 4.0). doi:10.3390/rs10050687
- Kennedy, G.W. and Price, J.S., 2004. Simulating soil water dynamics in a cutover bog. Water Resources Research, 40, W12410. doi:10.1029/2004WR003099
- Krause, P., Boyle, D.P., and Base, F., 2005. Comparison of different efficiency criteria for hydrological model assessment. Advances in Geosciences, 5, 89–97. doi:10.5194/adgeo-5-89-2005
- Kurbatovam, J., et al., 2009. Modeling of the carbon dioxide fluxes in European Russia peat bogs. Environmental Research Letters, 4, 45022.
- Kutilek, M. and Nielsen, D.R., 1994. Soil hydrology. Cremlingen: Catena Verlag.
- Lafleur, P.M., et al., 2005b. Annual and seasonal variability in evapotranspiration and water table at a shrub‐covered bog in southern Ontario, Canada. Hydrological Processes, 19, 3533–3550. doi:10.1002/hyp.5842
- Lafleur, P.M., et al., 2005a. Ecosystem respiration in a cool temperate bog depends on peat temperature but not on water table. Ecosystems, 8, 619–629. doi:10.1007/s10021-003-0131-2
- Lafleur, P.M., Roulet, N.T., and Admiral, S.W., 2001. Annual cycle of CO2 exchange at a bog peatland. Journal of Geophysical Research, 106, 3071–3081. doi:10.1029/2000JD900588
- Lafleur, P.M., et al., 2003. Interannual variability in the peatland‐atmosphere carbon dioxide exchange at an ombrotrophic bog. Global Biogeochemical Cycles, 17 (2), 1036. doi:10.1029/2002GB001983
- Letts, M.G., et al., 2000. Parametrization of peatland hydraulic properties for the Canadian land surface scheme. Atmosphere-Ocean, 38, 141–160. doi:10.1080/07055900.2000.9649643
- Loisel, J., et al., 2014. A database and synthesis of northern peatland soil properties and Holocene carbon and nitrogen accumulation. The Holocene, 24, 1028–1042. doi:10.1177/0959683614538073
- McDonald, M.G. and Harbaugh, A.W., 1988. A modular three-dimensional finite-difference ground-water flow model. Tech. Water Resour. Invest. 06-A1. Reston, VA: USGS.
- Mezbahuddin, M., Grant, R.F., and Flanagan, L.B., 2016. Modelling hydrological controls on variations in peat water content, water table depth, and surface energy exchange of a boreal Western Canadian fen peatland. Journal of Geophysical Research - Biogeosciences, 121, 2216–2242. doi:10.1002/2016JG003501
- Moriasi, D.N., et al., 2007. Model evaluation guidelines for systematic quantification of accuracy in watershed simulations. Transactions of the ASABE, 50 (3), 885–900. doi:10.13031/2013.23153
- Motovilov, Y.G., et al., 1999. Validation of distributed hydrological model against spatial observations. Agricultural and Forest Meteorology, 98–99, 257–277. doi:10.1016/S0168-1923(99)00102-1
- Parmentier, F., et al., 2009. CO2 fluxes and evaporation on a peatland in the Netherlands appear not affected by water table fluctuations. Agricultural and Forest Meteorology, 149, 1201–1208. doi:10.1016/j.agrformet.2008.11.007
- Peichl, M., et al., 2014. A 12-year record reveals pre-growing season temperature and water table level threshold effects on the net carbon dioxide exchange in a boreal fen. Environmental Research Letters, 9 (5), 55006. doi:10.1088/1748-9326/9/5/055006
- Ramanarayanan, T.S., et al., 1997. Using APEX to identify alternative practices for animal waste management. ASAE Paper No. 972209. St. Josepth, MI: ASAE.
- Reeve, A.S., Siegel, D.I., and Glaser, P.H., 2000. Simulating vertical flow in large peatlands. Journal of Hydrology, 227, 207–217. doi:10.1016/S0022-1694(99)00183-3
- Ritter, A. and Munoz-Carpena, R., 2013. Performance evaluation of hydrological models: statistical significance for reducing subjectivity in goodness-of-fit assessments. Journal of Hydrology, 480, 33–45. doi:10.1016/j.jhydrol.2012.12.004
- Ritter, A. and Munoz-Carpena, R., 2013, 2020. FITEVAL (online). University of Florida, IFAS Research. Available from: https://abe.ufl.edu/faculty/carpena/software/FITEVAL.shtml
- Roulet, N.T., et al., 2007. Contemporary carbon balance and late Holocene carbon accumulation in a northern peatland. Global Change Biology, 13 (2), 397–411. doi:10.1111/j.1365-2486.2006.01292.x
- Schwarzel, K., et al., 2002. Soil physical characteristics of peat soils. Journal of Plant Nutrition and Soil Science, 165, 479–486. doi:10.1002/1522-2624(200208)165:4<479::AID-JPLN479>3.0.CO;2-8
- Schwarzel, K., et al., 2006. Measurement and modelling of soil water dynamics and evapotranspiration of drained peatland soils. Journal of Plant Nutrition and Soil Science, 169, 762–774. doi:10.1002/jpln.200621992
- Silins, U. and Rothwell, R.L., 1998. Forest peatland drainage and subsidence affect soil water retention and transport properties in an Alberta peatland. Soil Science Society of America Journal, 62, 1048–1056. doi:10.2136/sssaj1998.03615995006200040028x
- Skopp, J., 1981. Comment on “Micro-, meso-, and macroporosity of soil”. Soil Science Society of America Journal, 45, 1246. doi:10.2136/sssaj1981.03615995004500060052x
- St-Hilaire, F., et al., 2010. McGill wetland model: evaluation of a peatland carbon simulator developed for global assessments. Biogeosciences, 7, 3517–3530. doi:10.5194/bg-7-3517-2010
- Strack, M., et al., 2006. Response of vegetation and net ecosystem carbon dioxide exchange at different peatland microforms following water table drawdown. Journal of Geophysical Research, 111, G02006. doi:10.1029/2005JG000145
- Sulman, B.N., et al., 2009. Contrasting carbon dioxide fluxes between a drying shrub wetland in Northern Wisconsin, USA, and nearby forests. Biogeosciences, 6, 1115–1126. doi:10.5194/bg-6-1115-2009
- Sulman, B.N., et al., 2010. CO2 fluxes at northern fens and bogs have opposite responses to inter-annual fluctuations in water table. Geophysical Research Letters, 37, L19702. doi:10.1029/2010GL044018
- Syed, K.H., et al., 2006. Environmental control of net ecosystem CO2 exchange in a treed, moderately rich fen in northern Alberta. Agricultural and Forest Meteorology, 140, 97–114. doi:10.1016/j.agrformet.2006.03.022
- Thien, S.J. and Graveel, J.G., 2003. Laboratory manual for soil science: agricultural and environmental principles. Dubuque, IA: Kendall/Hunt Publishing Company, Preliminary Edition, 52002.
- Wallage, Z.E. and Holden, J., 2011. Near-surface macropore flow and saturated hydraulic conductivity in drained and restored blanket peatlands. Soil Use and Management, 27, 247–254. doi:10.1111/j.1475-2743.2011.00
- Weber, T.K.D., Iden, S.C., and Durner, W., 2017a. A pore-size classification for peat bogs derived from unsaturated hydraulic properties. Hydrology and Earth System Sciences, 21 (12), 6185–6200. doi:10.5194/hess-21-6185-2017
- Weber, T.K.D., Iden, S.C., and Durner, W., 2017b. Unsaturated hydraulic properties of Sphagnum moss and peat reveal trimodal pore-size distributions. Water Resources Research, 53 (1), 415–434. doi:10.1002/2016WR019707
- Willmott, C.J., 1981. On the validation of models. Physical Geography, 2, 184–194. doi:10.1080/02723646.1981.10642213
- Willmott, C.J., 1982. Some comments on the evaluation of model performance. Bulletin of the American Meteorological Society, 63 (11), 1309–1313. doi:10.1175/1520-0477(1982)063<1309:SCOTEO>2.0.CO;2
- Wytrykush, C., et al., 2012. Designing landscapes to support peatland development on soft tailings deposits. Syncrude Canada Ltd.’s Sandhill fen research watershed initiative. In: D.H. Vitt and J.S. Bhatti, eds. Restoration and reclamation of boreal ecosystems: attaining sustainable development. Cambridge, UK: Cambridge University Press, 161–178.
- Zhang, Y., et al., 2002. An integrated model of soil, hydrology, and vegetation for carbon dynamics in wetland ecosystems. Global Biogeochemical Cycles, 16 (4), 1061. doi:10.1029/2001GB001838
- Zoltai, S.C., Siltanen, R.M., and Johnson, J.D., 2000. A wetland data base for the western boreal, subarctic and arctic regions of Canada. Information Report NOR-X-368. Canadian Forest Service, Northern Forestry Centre.