
 ?Mathematical formulae have been encoded as MathML and are displayed in this HTML version using MathJax in order to improve their display. Uncheck the box to turn MathJax off. This feature requires Javascript. Click on a formula to zoom.
ABSTRACT
Equitable water allocation in the context of local-scale water conflicts can be challenging. We present a holistic framework for the analysis of small-scale water disputes, contributing an integrated approach to the analysis of water conflicts by providing technical solutions combined with an in-depth analysis of social dynamics. The analysis focuses on an ongoing water conflict in El Carracillo region (Spain) related to an artificial aquifer recharge project. This case study involves two competing water users: horticultural farmers and ecosystem services provided by Cega River, from which water is diverted in order to recharge the aquifer. Based on a stakeholder analysis, a tool was developed to support participatory processes by facilitating mediation procedures. Preliminary results show solutions exist that account for ecosystem needs without causing major negative impacts on El Carracillo agriculture, and suggest the need for a re-negotiation of the existing rules governing water diversion from Cega River.
Editor S. Archfield ; Associate editor S. Pande
1 Introduction
Water resource management decisions that can lead to inequitable resource allocation are likely to result in water conflicts (Phelps Citation2007, Wolf Citation2009). The bugbear of water wars is on the international agenda (Serageldin Citation2009) and water conflicts have been investigated mainly in cases of international conflicts (Freeman Citation2001, Trottier Citation2003, Warner Citation2012), which often receive media coverage. On the other hand, many local water conflicts often go unnoticed by both mass media and scientific research.
Decisions on land and water management should always be based on a truly inclusive participatory process in the involved regions (Reed Citation2008). When it comes to small-scale water conflicts it can be more feasible – compared to extremely complex international contexts – to design a solution that can be accepted by all the parties by performing a participatory process among all the stakeholders involved. In any case, the most vulnerable communities, who face the highest risk from unbalanced water management decisions, often lack any technical or scientific support.
Multiple tools exist that facilitate the identification of optimum values for equitable water allocation. One of these tools, that allows the analysis of water allocation strategies under different scenarios, is the Water Evaluation And Planning (WEAP) model (Yates et al. Citation2005), as implemented for example by De Condappa et al. (Citation2008) in the Volta Basin and by Mutiga et al. (Citation2010) in the Upper Ewaso Ng’iro North Basin in Kenya. In the latter case in particular, an effort was made to consider also non-economically quantifiable water needs. Moreover, the analysis of water conflict based only on a water balance, without considering more qualitative factors, can lead to the oversimplification of very complex socioeconomic dynamics. This is the case, for example, for water conflict analysis performed through system dynamics (Nandalal and Simonovic Citation2003, Karamouz et al. Citation2006, Khan et al. Citation2009, Madani and Mariño Citation2009), often combined with other tools (Ahmad and Simonovic Citation2004, Zomorodian et al. Citation2017).
Water demand is always increasing (Adamowski et al. Citation2009), while natural sources of water remain roughly the same, at best. This dynamic may reach a point where water abstraction alters the equilibrium sustaining freshwater biodiversity, leading to conflicts between water users and river conservation advocates (Hess and Ostrom Citation2003).
In water allocation processes, often little attention is paid to the water requirements that need to be met to ensure the maintenance of ecosystem services (Korsgaard et al. Citation2008). In this work we will use the definition provided by Daily (Citation1997), according to which ecosystem services are those “conditions and processes through which natural ecosystems, and the species that make them up, sustain and fulfill human life.” (p. 3) The Natural Flow Paradigm (Poff et al. Citation1997) led to the recognition of the direct connection existing between ecosystem services and the natural flow regime. Thus, the concept of environmental flow was developed, defined as “the water regimes provided within a river, wetland or coastal zone to maintain ecosystems and their services to people” (Dyson et al. Citation2003, p. 6).
In the framework of integrated water resource management (IWRM), the most encouraged approach to set adequate environmental flow values is that involving a negotiated trade-off between water users (Jonch-Clausen Citation2004). Ecosystem services may run the risk of being excluded from water allocation decision-making. Their intrinsically qualitative nature makes it so that expert judgement is required for their quantification, and they are generally more difficult to include in decision processes based purely on economic or hydrological evaluations. This may lead to the risk of water allocation decision-making mistaking them being invaluable for them being valueless.
This study addresses these shortcomings. It aims to provide a framework to support participatory processes in water planning and management, and to facilitate mediation activities in the case of small-scale water conflicts. The tool should provide technical solutions that also take into account social dynamics and ecosystem services that often are not sufficiently considered in water allocation processes (Dyson et al. Citation2003).
The framework was developed and tested in the ongoing conflict around the artificial aquifer recharge project in El Carracillo region, Central Spain. This case study provides an interesting insight into the conflicting dynamics that can originate from water management strategies. The case study was analysed with a holistic approach, in order to characterize the conflict from different perspectives. Based on a stakeholder analysis, we develop a tool that represents competing water users and provides graphical and numerical data on the optimization performed on competing “utility” functions. A software program was developed to represent competing water users. Such an approach can provide graphical and numerical outputs to further support evidence-based participatory decision processes, based on optimal water allocation solutions in contexts characterized by water allocation-related conflicts.
2 Context of the study
2.1 Study area
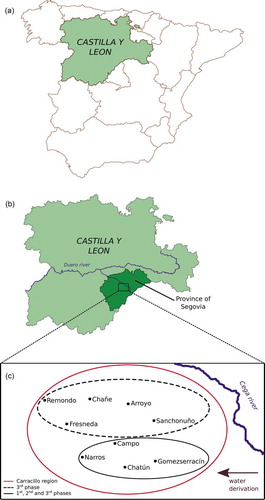
El Carracillo region is located in the province of Segovia, in Castilla y Leon, Spain (). The region, sited in the Duero basin, extends between the rivers Cega, Malucas and Pirón, and it has an area of approximately 35,000 ha, mostly covered by pine trees (Pinus pinaster). El Carracillo has for a long time been characterized by subsistence agriculture, extensive sheep breeding and pine management, the latter being one of the region’s most ancient economic activities.
Figure 1. Carracillo region: (a) with respect to the province of Segovia and to autonomous region of Castilla y Leon; (b) villages benefiting from the first two phases (continuous line) and those that will benefit from the third phase (dashed line)
Since the 1960s, a new rural development model has gradually led to a transformation and intensification of agricultural activities (Antequera et al. Citation2014) and to a change in the management of natural resources and in cropping patterns. Traditional crops like sugar beets and chicory were replaced by horticultural crops with high irrigation requirements, such as strawberry. Moreover, numerous seedlings and nurseries were implanted to produce both propagation material for agriculture and plants for exportation (mainly to Andalusia, Europe and Northern Africa).
A generally shallow water table contributed to the economic development of the region, allowing intensive, cost-effective crop irrigation. This new economic model led El Carracillo region to become an example of agricultural productivity and development for the rest of Spain (López et al. Citation2010). To date, the irrigable area is about 7600 ha, of which approximately 3000 ha are irrigated in a given campaign.
The economic development of El Carracillo region brought about a severe over-exploitation of the aquifer (Fernández Escalante and López Gutiérrez Citation2002), which triggered action by the Water Authority to deal with the associated water management problems. In 1998 some hydraulic infrastructures were declared to be of general interest by Royal Decree (R.D. Ley de 9/1998), and the construction of infrastructure for water supply, flood control, wastewater treatment and irrigation was planned. Among these, the implementation of a managed aquifer recharge (MAR) project in the Carracillo region was approved.
2.1.1 The MAR project
Through the 1998 Royal Decree, Water User Association (WUA) Comunidad de Regantes (CR) El Carracillo (CIF: G-40142978) was granted a water licence (Concession C-21-844-SG) on the improvement of irrigation with water derived from Cega River. The decree is aimed at the recovery and preservation of El Carracillo’s aquifer through artificial recharge (via the use of infiltration ponds), by providing the amount of water required to satisfy agricultural needs of the agricultural plots belonging to the WUA (3000 ha). In the MAR project, water is diverted from the Cega River, located approximately 30 km from the irrigable area.
Starting in the year 2000, two subsequent implementation phases took place, both carried out without an environmental impact assessment. Beneficiaries of these first two phases were villages of the southern part of El Carracillo, where the geological setting is more favourable for artificial recharge. The presence of a thick sand layer allows direct aquifer recharge through infiltration of water flowing in channels and existing ponds, without the need for recharge infrastructure to be built. The concession in force during the first two phases allowed the diversion of up to 1.37 m3/s from Cega River during the period from January to April, up to a maximum of 14.2 hm3 per year and under the condition that a river flow of at least 6.9 m3/s is guaranteed downstream of the intake.
At present a third phase of the MAR project is being implemented. This phase was planned in order to benefit also the villages of the northern part of El Carracillo and to reduce the constraints set in the original water permit. This phase will involve both the commissioning of new infrastructure and a revision of the water permit rules. Since in the north of El Carracillo there is no superficial (Quaternary) aquifer, the recharge will be articulated in three stages:
Artificial recharge: water diverted from Cega River will be stored in a 3600-ha area with a sandstone lens and covered by pine trees;
Extraction from wells: during the irrigation period, water will be extracted through wells and pumped to a regulation pond;
Transportation to irrigation network: water will be transported under pressure via pipelines to irrigation plots in the northern Carracillo.
The original water permit will undergo the following modifications: the diversion period will be extended from December to May, and the minimum river flow to be ensured downstream from the intake will be reduced from 6.9 to 0.6 m3/s.
2.1.2 Cega River
Cega basin has an area of about 360 km2. This area is characterized by sandy soils, which allow good infiltration rates. The average annual rainfall for the period 2001–2015 was 427 mm/year, based on the daily precipitation data from Gomezserracin weather station. Agriculture is the main land use (Rivas-Tabares et al. Citation2018).
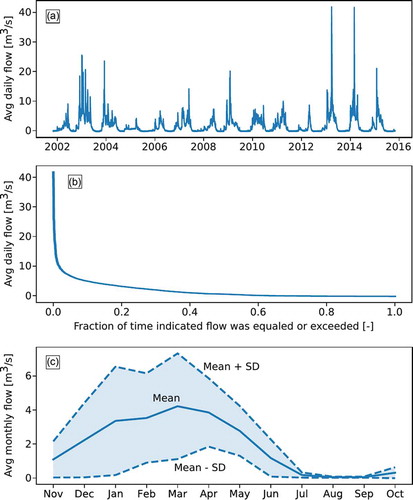
Cega River originates from Montes Carpetanos and flows south–north along 113 km (Moreno and Gil Citation2016). Upstream of the derivation point (gauging station 2016), it has an average annual flow of 3.31 m3/s (calculated for the period 2001–2015 from data by Ministerio para la Transición Ecológica, Citation2018) and shows an irregular flow pattern (). Flow peaks occur in winter and spring, while flows during summer are often close to zero. The duration curve in shows a typical seasonal pattern of in-stream flows. While flow values grow larger in the period from October to July, their variability also increases noticeably. This can be seen in , where mean and standard deviation values for monthly flows during the period 2001–2015 are shown.
Figure 2. Characteristics of Cega River flow at gauging station 2016 (upstream of the derivation) for the period 2001–2015: (a) average daily flows; (b) duration curve of average daily flows; (c) average monthly flows (mean and standard deviation (SD) values are shown). Data from Ministerio para la Transición Ecológica
3 Material and methods
3.1 Stakeholder analysis
A stakeholder analysis was performed to identify the main actors involved in the recharge project and to define the dynamics that relate them. A preliminary stakeholder identification took place during the December 2018 workshop “Taller sobre agua y desarrollo rural sostenible en la comarca del Carracillo” (Hernandez-Mora et al. Citation2018), organized by the municipal government of the village of Chañe, located in the study area.
The workshop’s main objective was to involve stakeholders in the collective design of a vision for the economical and social development of El Carracillo region, through the definition of values to promote, influential actors and means of achievement. Efforts were made, with the help of local mayors, to involve representatives of different social groups, environmental organizations, agricultural unions, economic sectors active in the region and private companies involved in water and land uses, as well as the main local, provincial and regional administrations in charge of rural, agricultural and water policies. Thirty-two people participated in the workshop. Some relevant regional public administrations – Consejería de Agricultura de la Junta de Castilla y León, the Consejería de Medio Ambiente, and Instituto Tecnológico Agrario de Castilla y León (ITACYL) – were invited to the event but in the end did not attend.
The phase of stakeholder identification was carried out as an iterative process (Reed et al. Citation2009). The workshop enabled a preliminary identification of stakeholders and their subdivision into target groups, thanks to a direct contact with people involved in the ongoing El Carracillo conflict. In the months following the workshop, semi-structured interviews led to a more comprehensive and refined stakeholder characterization through a process of stakeholder-led categorization (Dryzek and Berejikian Citation1993).
The resulting stakeholder classification was used to characterize cooperative and conflicting dynamics among stakeholders through the construction of an actor-linkage matrix (Biggs and Matsaert Citation1999), identifying pairwise relationships between couples of stakeholders as conflicting, complementary or cooperative.
3.1.1 Interviews
A total of 51 semi-structured interviews were conducted. Alongside the refinement of the preliminary stakeholder identification, they contributed to the evaluation of conflict-related parameters, serving three main objectives:
To understand dynamics among stakeholders;
To understand the stakeholders’ perceptions of the ongoing recharge project and of the planned third phase;
To assess the stakeholders’ perceptions of ecosystem services related to the Cega River.
The number of interviews performed within each target group is reported in .
Table 1. Number of interviews for each target group
The class of technicians and experts directly involved in the project included technicians from Tecnologías y Servicios Agrarios (TRAGSATEC) and Confederación Hidrográfica del Duero (CHD). It was considered fundamental to have a technical vision “from inside,” provided by the technicians who directly conceived and designed the project. At the same time, experts outside the project were also interviewed, including hydrologists, hydrogeologists, agronomists and social scientists not directly involved in the MAR project.
We were able to interview the mayors of only three of the villages directly involved in the project (Pinarejos, Chañe, Sanchonuño); others did not respond to our invitation to participate.
Both small farmers and large agricultural enterprises belong to Comunidad de Regantes, since they benefit from the water permit to irrigate with water diverted from Cega River. Still, the two classes drastically differ in business size, types of crops grown and markets where their products are sold.
Local workers include resineros (i.e. people who manage pine trees, selling wood and resin) as well as people working in other local businesses linked to the territory, such as hoteliers, historians and bartenders.
Finally, environmentalists belong to the group Si a las Fuentes del Cega.
Interviews were divided into three sections: questions about the recharge project, questions about the actors and, finally, questions about Cega River. For the first section, interviewees were asked to give their opinion about the objectives of the third phase of the MAR project, its suitability to achieve those objectives, and weaknesses and strengths of the third recharge phase. The second section was meant to gather information about the actors involved in the project, their role and their interests; interviewees were asked to identify the people most affected (in a positive and/or negative way) by the MAR project as a whole and by the third phase in particular. Finally, the third section of the interviews focused on the identification of perceived Cega River ecosystem services. After a short introduction to ecosystem services, a list thereof based on Korsgaard et al. (Citation2005) was provided, and interviewees were asked to score each item from 1 (little importance) to 5 (great importance).
3.2 Support software for participatory processes and conflict mediation
3.2.1 Structure of the software
A software program was developed to analyse the consequences of the water permit rules on the system, with the aim of supporting participatory processes regarding the implementation of the MAR project in El Carracillo region. Specifically, it was designed to provide a description of “utility” functions representing the different interests of stakeholder groups identified during the previous phase of analysis. This should allow each party to feel adequately represented during the participatory process.
The software may be adapted to different case studies by adequately changing inputs as well as model and utility functions. It was implemented in Python 3.6 and is released under a GPLv3 free software licence, so that the code may be freely used, modified and/or improved by anyone. Its structure follows the principles of software modularity (Narduzzo and Rossi Citation2003), so that any function may be substituted with another characterized by the same inputs and outputs. This would allow refining function definitions in a later stage or adding new data as it becomes available; more generally, it allows applying the model to other case studies.
The general structure is represented in , along with the details of its application to El Carracillo case study. Necessary data are fed into a hydrological model. Utility functions are calculated based on the outputs of this model. These may vary and must be selected by the user based on stakeholder analysis and expert judgement. Broadly speaking, there will be a utility function representing the exclusive interests of each stakeholder group and, if applicable, a utility function representing shared interests. Two different kinds of output may then be produced: graphical and numerical. Utility functions may be represented graphically, showing their relationship with different values of the water permit rules. This graphical representation could be useful when discussing a technical solution with the general public or with stakeholders who do not have a technical background. Alternatively, utility functions can be considered together within a global objective function, which is then maximized through an iterative optimization process (letting the value of select concession rules vary).
Figure 3. Support software for mediation and processes: implementation for the Carracillo case study
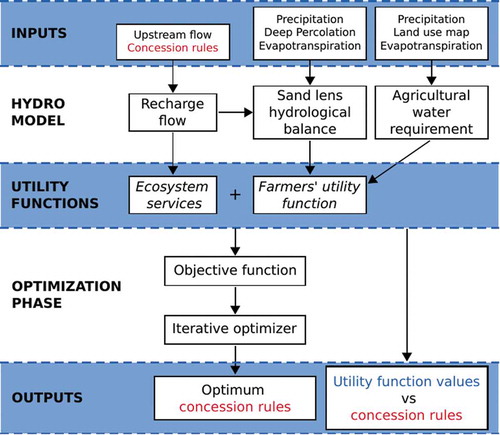
In the case study, the core utility functions represent the competitive interests of the two groups identified through stakeholder analysis, which will be further detailed in Section 4.1. Group 1 comprises traditional and rainfed farmers, pine workers and environmental groups, and is represented by the Ecosystem services utility function SPI(t) (named after the Service Provision Index; Korsgaard et al. Citation2008), used for its quantification as detailed in the following). Group 2 is represented by the Farmers utility function FU(t), and comprises large agricultural enterprises, export farmers, Junta de Castilla y Leon, CHD and municipalities. summarizes the composition of the two groups. Corresponding utility functions can be calculated under different water permit rules, that work as both inputs and boundary conditions for the system, and that are considered to be perfectly enforced in the present study.
Table 2. Composition of the two stakeholder groups
The water rules are identified by four parameters, which can be varied to explore the relative consequences:
Diversion period Δd, i.e. the months during which the permit allows diversion;
Vmax, the maximum volume to be diverted yearly;
qmax, the maximum instantaneous intake;
qmin, the minimum flow to be maintained downstream of the intake.
Outputs allow stakeholders to directly assess the impact of a variation in the diversion rules during the participatory process. For the optimization stage, an objective function Fobj was defined as the sum of the two utility functions averaged over the years of observations for which data was available:
For its maximization, the Nelder-Mead algorithm was used (Nelder and Mead Citation1965), as implemented in the standard Python library SciPy. The optimization can be either single- or multi-parametric, depending on the number of parameters established by the user. For this case study, we focused on a single-parameter optimization regarding qmin and a multi-parameter optimization regarding qmin and qmax.
The third phase of the MAR project is still in its design phase, and it is expected to be operational starting from 2023 (Arranz Citation2019). To be able to advance considerations over recharge effects in the near future, hydrological data from past years were used. This was done under the hypothesis that climate in the region will be similar to the past climate and considering that there is no clear consensus regarding hydrological trends for the very near future in the Duero region (Ceballos et al. Citation2004, Estrela et al. Citation2012). A thorough analysis of climate change scenarios and relevant hydrological models was considered to be outside the scope of the model’s applications.
Functions FU(t) and SPI(t) were calculated on a daily basis for the period 2001–2015. Their values, however, become more informative when averaged over 1 year, or over the entire available period. For this reason, graphical outputs are produced showing average function values.
In this task, we faced significant constraints in terms of data availability. The Cega basin lacks a consistent and up-to-date historical flow data series, and there is a mismatch between years for which there are available flow data upstream of the diversion point and those when data are available downstream of it. Moreover, available data about the diverted volumes are patchy, making it impossible to have a complete record of the water diverted since the beginning of the project.
The developed model was not validated by comparing its results with measurable data, since its purpose is to envision the effects of hypothetical scenarios (such as the yet-to-be-implemented third phase of the MAR project), in such a way that factual comparison data would have been difficult or impossible to procure.
In the following sections, utility functions for El Carracillo case study are presented. More information regarding the choice of utility functions can be found in Section 4.1.
3.2.2 Water diverted from Cega River
The kernel of each utility function’s calculation is the knowledge of how much water is diverted from the Cega River on a given day. This data is needed as an input for the hydrological balance of the sandy layer, and to calculate the river flow downstream of the diversion point qdown(t), which has an impact on the ecosystem services delivered by the river.
Diverted flow qR(t) was calculated under the hypothesis that since aquifer recharge happens before the start of the irrigation period, as much water as possible, within the boundaries set by the concession, will be extracted. For a given set of diversion rules, then, daily qR(t) values were calculated using the algorithm shown in .
Figure 4. Flowchart of the algorithm to calculate water derived from Cega River qR(t). Time-dependence of flow values was omitted for clarity
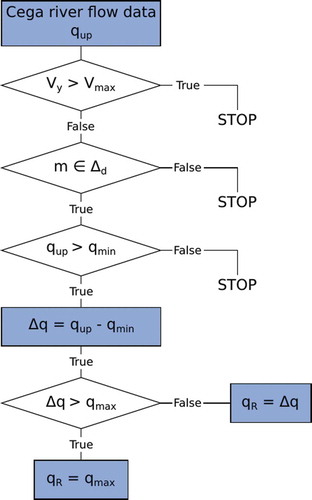
The starting point are daily flow values for the years 2001–2015 (qup(t)), obtained from a gauging station upstream of the diversion point. Three checks are then performed, so that if any of them fails qR(t) is automatically set to 0:
Has the maximum volume of derivable water Vmax already been reached?
Is diversion permitted during the current month?
Is the flow upstream of the diversion point greater than the minimum flow to be maintained downstream of qmin?
If all checks are passed, water diverted from Cega River qR(t) is set equal to the minimum value between the maximum instantaneous intake qmax and the absolute value of the difference qup(t) − qmin.
The resulting flow downstream of the diversion, key for the calculation of the SPI(t) function, is then:
The relationship between quantities of interest can thus be summarized as follows:
3.2.3 Farmers’ utility function
FU is computed on a daily basis as the ratio of the agricultural water requirement (Wr) and water available for irrigation (Wa) in the aquifer:
It represents the interests of one of the two identified stakeholder groups, and depends on the amount of water stored in the sandy aquifer through the MAR, so that more water diverted from Cega and infiltrated in the aquifer generally leads to an increase in the value of FU(t).
To calculate the water requirements for irrigation, ITACYL land-use maps (Del Blanco Medina and Nafría García Citation2015) from 2011 to 2015 were used to identify irrigated crops in the area. For each type of crop the vegetative period was defined and discretized: values of Wr(t) were calculated on a monthly basis, with the exception of the months between April and September, for which a finer subdivision in 10-d periods was preferred. Daily values of reference evapotranspiration ET0(t) calculated using the Penman-Monteith equation (Beven Citation1979) and rainfall data h were obtained from the Gomezserracín weather station. Water requirements for each crop, for each time subdivision, were calculated as follows:
Here, Kc is the crop coefficient relative to the vegetative phase associated with each month (Allen et al. Citation1998), and factor 0.8 represents an irrigation efficiency of 80%, as irrigation in the study area is almost exclusively through sprinklers (CampoCyL Citation2015). Due to a lack of land-use data, and since no significant patterns of change were found for the period 2011–2015, we used the average values for that period for the preceding years (2001–2010) as well.
With the implementation of the third phase of MAR, water diverted from Cega River will be stored in an area of 1236 ha, characterized by the presence of a sandy lens, which makes it ideal for water storage. The water will be diverted during the period granted by the water permit (December–May), stored in this natural reservoir and then extracted during the irrigation period (ranging approximately from March to October). Because of the temporal shift between water storage and water withdrawal, water available for irrigation is calculated from a hydrological balance of the sandstone lens. The volume of water available at the end of day n is calculated as:
where the subscript n is a shorthand to indicate that the relative function is time-dependent and evaluated for t = n, and:
qR is the flow of water diverted from Cega River;
ξ is the relative efficiency, considered to be 0.95;
h is the daily rainfall value;
ET is the daily reference evapotranspiration value;
Vextr is the water extracted for agricultural use;
Δt is the length of a day; and
A is the sandstone lens’ surface area.
The hydrological balance of the sandy layer was calculated on a daily basis starting from 1 November 2001. No data regarding its water contents on that date was available. Calculations were then performed considering it hypothetically empty on Day 0. This abides with a general precautionary principle, since the only effect of this hypothesis may be to slightly reduce the value of FU, nudging the following calculations in favour of more permissive concession rules. Furthermore, in November the irrigation season has just ended, while water has not yet begun to be derived from Cega, so an empty (or almost empty) layer is likely.
Daily rainfall and reference evapotranspiration values were obtained from Gomezserracin weather station. Since the sandy layer is covered by pine trees, reference evapotranspiration was corrected by means of the crop coefficient attributed to Pinus pinaster and corresponding to 1 (Allen et al. Citation1998). According to the project report provided by TRAGSATEC (Citation2018), deep percolation appears to be very slow, so it can be ignored in the water balance. The same report also highlights that lateral flows to the adjacent aquifer do not affect the piezometric level in the Zona Almacén. Finally, a pressure decrease equal to 5% was considered for water diverted from Cega River, translating into a relative efficiency factor (ξ) of 0.95 in Equation (6).
3.2.4 Ecosystem services quantification
The utility function relative to the second stakeholder group involves the quantification of three types of ecosystem services: biodiversity conservation; tourism and recreational activities; and urban water supply (see Section 4.1).
Quantifying ecosystem services is both difficult and subject to arbitrary assumptions. Some services are intangible and difficult to monetize. Sometimes, it may also be unfeasible for practical reasons such as a lack of data. For all those services to which no monetary value can be given, the risk is always high of someone mistaking them being invaluable with them being valueless. For this reason, we set forth to find a feasible evaluation procedure for the ecosystem services identified during stakeholder analysis. This was done through a procedure based on the Service Provision Index (SPI) framework as proposed by Korsgaard et al. (Citation2008) and implemented by Fanaian et al. (Citation2015).
Korsgaard et al. (Citation2008) base the construction of the index on the selection of one or more flow classes for each ecosystem service, where flow classes are defined as “any characteristic of the natural flow regime that is considered vital for provision of a particular service” (Korsgaard Citation2006, p. 28). The service suitability (SS) of each flow class during the time frame of interest is then calculated, describing how suitable a given flow value is to the sustenance of the service. Finally, SPI (with 0 ≤ SPI ≤ 1) is calculated as the weighted average of the SS of each flow class.
Unlike the framework proposed by Korsgaard et al. (Citation2008), the present work only took into account one flow class for each ecosystem service. In particular, river flow downstream of the diversion point qdown(t) was considered. The application of SPI to our case study is described in EquationEquation (7)(7)
(7) :
where i is the ecosystem service; n is the number of ecosystem services; wi is the weight given to each ecosystem service i; and SPIi is the Service Provision Index calculated for each ecosystem service i.
3.2.5 Biodiversity conservation
The SPI of biodiversity conservation was calculated by comparing river flow downstream of the diversion qdown with environmental flow values (Dyson et al. Citation2003). Environmental flow is defined by the Brisbane declaration (International River Foundation Citation2007) as “the quantity, quality and timing of water flows required to sustain freshwater ecosystems and the human livelihoods and well-being that depend on these ecosystems.” Thus, we considered it reasonable to set it as the threshold below which biodiversity conservation is not viable.
Environmental flow values proposed by the CHD are lower than the survival threshold prescribed by Tennant (Citation1976), which is set at 10% of average monthly flow. For this reason, they were deemed to be unsuitable for the purpose of conserving biodiversity, and values from Tennant were used instead. Tennant reports a direct relation between river depth, width and velocity parameters (all increasing with river flow), and the well-being of aquatic organisms and their habitat. As anticipated, the threshold above which a river can be considered alive is set to 10% of the average monthly flow (Q10); 30% of the average monthly flow (Q30) is considered a value that leads to the maintenance of a satisfactory environment, and finally 60% of the average monthly flow (Q60) allows the river to be in excellent condition.
Daily suitability values (see Section 3.2.4) between 0 and 1 were then associated with the river flow downstream of the diversion point qdown, using Tennant’s thresholds as a reference. Values of 1 and 0.8 were arbitrarily attributed to optimum and satisfactory conditions, and thus to Q60 and Q30, respectively. Flow values between Q10 and Q30 were considered to be unsatisfactory, and were attributed a value of 0. Flow values below the Q10 threshold were penalized by the attribution of a 0 value to the entire month. This seemingly extreme choice has both technical and ethical reasons: it is meant to implement a constraint on the optimization process, as well as to the water permit rules, in order to penalize water management decisions that allow reducing river flow below 10% of its average value, leading to “catastrophic degradation to fish and wildlife resources and harm [to] both the aquatic and riparian environments” (Tennant Citation1976, p. 10). Days with an upstream flow value qup below Q10 were excluded from the evaluation since, in this case, the low flow value is not attributable to an anthropogenic factor. Rules for the determination of the daily biodiversity conservation suitability value are summarized in . To account for days excluded from the evaluation, suitability values are, finally, averaged over the considered days, and the resulting value is attributed to the whole month.
Table 3. Rules to determine the biodiversity conservation suitability monthly value
3.2.6 Tourism and recreational activities
The tourism ecosystem service was considered a function of the environmental flow as well, since we estimated that the well-being of the river constitutes a basis for tourism to occur. Environmental flow values calculated with the Tennant method were used once again, and suitability values were computed on a monthly basis. In particular, we attributed to months with an average flow of 30% or more of the average monthly flow Q30 a value of 1. Proportionally lower values are attributed for lower average monthly flows.
3.2.7 Urban water supply
Urban water provision from the Cega River is regulated by a water permit to supply a population of about 20 000 inhabitants. This water set maximum thresholds for three parameters: the maximum volume that can be withdrawn yearly, the maximum volume that can be withdrawn monthly, and the maximum instantaneous intake. Water abstracted from the river was estimated following the same approach as for the MAR project (see Section 3.2.2), and the urban water supply service by the river was considered to be fully provided (suitability value of 1) when all of the parameters were simultaneously satisfied.
3.2.8 Weight scenarios
SPI requires the attribution of weights to the considered ecosystem services. In real-world applications of our proposed model, the selection of weights would normally be the responsibility of the competent authority, ideally with the support an assembly of stakeholders in the framework of a participatory process. The choice of different weights might have a drastic effect on the outcomes of the model, and as such is of the utmost importance.
For the concerns of the present research, the effects of two different sets of weights were investigated, to simulate different scenarios and identify potential unchanging outcomes. The first set of weights that was considered (hereafter “Weight Scenario A” or WSA) uses uniform weights and corresponds to an uninformed decision about the problem. The second set (“Weight Scenario B” or WSB) simulates an expert decision through the application of analytic hierarchy process (AHP; Saaty Citation2008), performing pairwise comparisons between the services. Two different aspects, and thus two different sets of comparisons, were employed:
The perceived importance of the service;
The relevance of river conservation for its satisfaction.
The final weight adopted for each service was the product of the two weights resulting from the comparisons, which in turn were calculated as the principal eigenvectors of two pairwise comparison matrices. The two sets of weights are shown in .
Table 4. Weight scenarios
4 Results
4.1 Stakeholder analysis
After the interviews, preliminary target groups were refined, identifying 10 stakeholder groups:
Export farmers, cultivating crops for exportation (strawberries, raspberries, horticultural products);
Traditional farmers, cultivating traditional crops;
Rainfed farmers, a subset of traditional farmers relying on rainfed crops;
The Comunidad de Regantes del Carracillo, bringing together the farmers who benefit from the MAR project;
Pine workers, who historically manage pine forests, extract resin and sell pine wood;
Environmental groups, individuals and associations that advocate for the maintenance of the landscape features and ecosystem services related to the river and the pine forests;
Municipalities, acting as intermediaries between the people and the Confederacion Hidrografica del Duero;
The Junta de Castilla y Leon, who promoted the MAR project as a means of addressing the overexploitation of the Los Arenales aquifer and who encourages the cultivation of export crops;
TRAGSATEC, public company in charge of designing and executing the MAR project (past and future phases);
Confederacion Hidrorafica del Duero (CHD), the Duero River Basin Authority in charge of enforcing the water law in the study area.
Existing dynamics among the identified stakeholders were analysed through the construction of an actor-linkage matrix (Biggs and Matsaert Citation1999) (). As mentioned, stakeholders polarized into two groups, the first comprising traditional and rainfed farmers, pine workers and environmental groups (Group 1), and the second including large agricultural enterprises, export farmers, Junta de Castilla y Leon, CHD and municipalities (Group 2). The groups are cooperative within themselves, as highlighted by the abundance of the colour green on the main diagonal in , but in conflict with each other.
Figure 5. Actor-linkage matrix
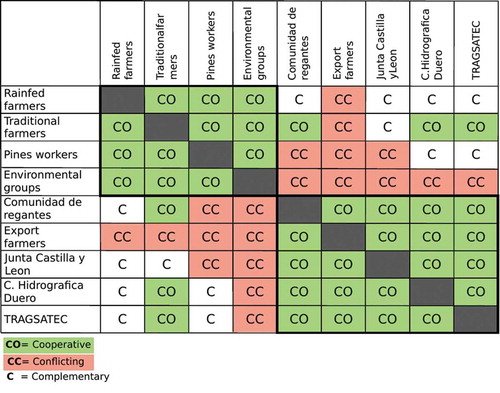
This bipartition corresponds to contrasting preferences for what concerns water allocation (). From the interviews, it emerged that Group 2 sees the third phase of the recharge project as a more refined tool (compared to its previous phases) for the exploitation of the water of the Cega River. According to stakeholders in Group 2, horticulture will benefit directly from the implementation of the third phase. For this reason, stakeholders relying on the success of this economic model (first and foremost export farmers) argue that the third phase of the MAR project will only lead to beneficial effects, from an economic point of view as well as for the environment. Interestingly, many of the interviewees, including some with a scientific or technical background, expressed the belief that water not diverted is “wasted” water.
Table 5. Contrasting preferences about water allocation and related ecosystem services
On the other hand, stakeholders in Group 1 believe water released downstream of the diversion point plays a significant role in maintaining fundamental services provided by the river, and thus fear the consequences that the third phase may have.
From the interviews it is, then, possible to state that while there exists a perception of ecosystem services provided by the Cega River, it is driven by contrasting water allocation preferences for the two groups. Group 1 identified three main ecosystem services that, in their opinion, should be ensured by water allocation decisions:
Biodiversity conservation;
Tourism and recreational activities;
Urban water supply (since there are communities relying on water from the Cega River).
Group 2, conversely, expressed a preference towards a single ecosystem service, which could be identified as “water for agriculture,” with attention being paid to the specific agricultural model implied by the interviewees.
A short circuit is thus created, around which the ongoing conflict revolves: the more water is derived to satisfy farmers’ demands, the more the well-being of the river as well as the quality of ecosystem services downstream of the derivation deteriorates.
In the next phases of the study, water diverted for agriculture was then considered separately from other ecosystem services, leading to the definition of two distinct utility functions. This was done to reproduce the contrasting interests of the two groups involved, as emerged from stakeholder analysis optimization results.
4.1.1 Graphical outputs
shows average utility functions over the years, comparing their values under water permit rules associated with the third phase of MAR and values under the current water permit rules, in order to better understand the impact that the third-phase concession will have on both. The shaded area highlights the difference between function values corresponding to the rules of the two water permits (current and future). The volume of water transiting through the derivation point during the year (integral flow) is also shown, revealing a correlation between low points in the utility functions’ trends and dry years.
Figure 6. Comparison between yearly average FU (Farmer’s Utility) and SPI (Service Provision Index) function values for second- and third-phase concession rules: (a) Weight Scenario A; (b) Weight Scenario B
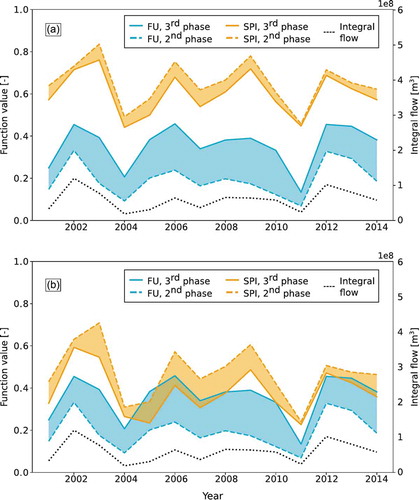
The same graph is proposed for both Weight Scenario A ()) and Weight Scenario B ()). A different set of weights corresponds to a different evaluation of the impact that the change in concession rules has over the SPI. It is possible to observe that the orange shaded area, corresponding to the effect that a change in concession rules would have on ecosystem services, is bigger for WSB. In contrast, the blue shaded area, corresponding to FU, remains unchanged.
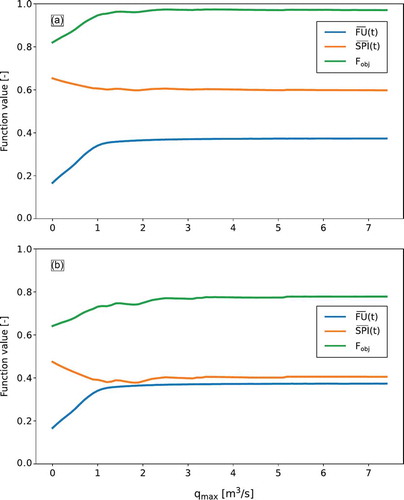
The software allows the graphical visualization of utility functions under different values of the concession parameters. show, respectively, the effect of qmin and qmax over the yearly averages of utility functions and of their sum Fobj. For each figure, the unchanged concession parameter (qmax and qmin, respectively, for ) was considered constant and equal to the value set by third-phase concession rules.
Figure 7. Utility functions averaged over the years 2001–2014 for different values of Qmin: (a) Weight Scenario A; (b) Weight Scenario B
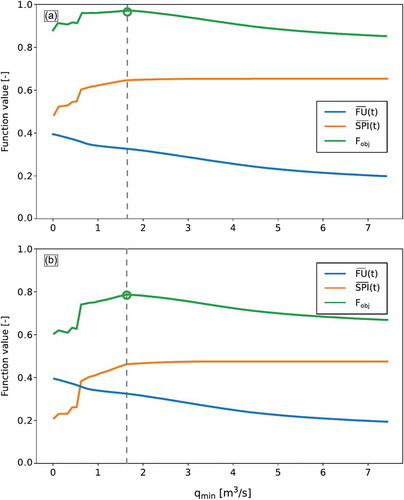
Figure 8. Utility functions averaged over the years 2001–2014 for different values of Qmax: (a) Weight Scenario A; (b) Weight Scenario B
Looking at , it is possible to note that the maximum value of the functions’ sum (i.e. the objective function Fobj) corresponds to qmin values close to 1.60 for both scenarios. This suggests that an inherent advantage comes from setting the minimum flow to be guaranteed downstream of the derivation to a higher value than that prescribed by the third-phase concession.
, in contrast, does not allow room for speculation. A near-zero slope value for Fobj, however, warns us that any value resulting from the optimization should be closely inspected to ensure that the algorithm did not choose an unrealistically high flow, while accounting for a marginally higher value of the objective function does not have a real-life significance.
4.1.2 Numerical outputs
Both a single-parameter optimization, focusing only on the minimum flow to be maintained downstream of the derivation (qmin), and a multi-parameter optimization comprising both the former and the maximum instantaneous intake qmax, were performed. In both cases, the remaining concession parameters (Vmax and Δd) were assumed to be equal to those of the third-phase concession. The results are shown in . As was expected after looking at the objective function Fobj in , the resulting optimum values of qmin are very similar for both weight scenarios, remaining somewhat close to a value of 1.60 m3/s. Similar values were found with both single- and multi-parameter optimizations, showing little to no influence of qmax on the optimum value of qmin. Multi-parameter optimization results concerning qmax are very high, set to 6.83 m3/s for WSA and to 9.65 m3/s for WSB.
Table 6. Optimization results: qmin and qmax values; other concession values as prescribed by third-phase concession
It should also be noted () that the gradient of Fobj in the qmax direction is always positive, but approaches very close to zero after a certain point. Such a gradient means that, from a merely practical point of view, no tangible benefit comes from choosing a value of maximum instantaneous intake greater than the one where the gradient change happens.
4.1.3 Optimization with CHD-prescribed environmental flow values
In a separate trial, the SPI function was calculated using environmental flow values set by CHD for the hydrological planning cycle 2015–2021 instead of values calculated using the method proposed by Tennant (Citation1976).
A single-parameter optimization was then performed, calculating the value of qmin that maximizes Fobj. Optimum minimum flow calculated for the period 2001–2015 resulted in a value of 0.67 m3/s for Weight Scenario A, and 0.84 m3/s for Weight Scenario B. As expected, they are both lower than the value obtained using environmental flows calculated with the Tennant method, but it must be noted that they are both still higher than the value of 0.6 m3/s imposed by the third-phase concession. summarizes the results, allowing for their direct comparison.
Table 7. Minimum instantaneous intake (qmin, m3/s) resulting from the use of different EF values, and as prescribed by third-phase concession rules
4.2 Ecosystem services provided by pine trees
Ecosystem services that will be negatively impacted by the implementation of the third phase will not only be those related to the Cega River. In fact, pine trees provide ecosystem services, both production services and information services. They constitute an important part of the local economy, providing resin and wood. In addition to this, pine management is a traditional activity, with which people living in Carracillo region identify and around which people gather.
A study was performed by Viñas and Sanz (Citation2005) to assess impacts that implementation of the third phase could have on pines located over the so-called Zona Almacen (1236 ha). Results show that the use of the aquifer as a receptor in winter and as a source in summer can lead to different negative impacts. During the artificial recharge phase, the following effects are likely to occur:
Increase in the water table and flooding of some areas;
Saturation of the entire soil profile. Prolonged stagnation will lead to physiologic consequences for roots.
During the extraction phase:
Severe depression of groundwater levels and decrease in water availability in soil;
Water stress, especially for those individuals who are closer to the extraction points.
This study confirms what emerged during interviews with resineros, since they fear the water stress that could be caused to pines by the cyclical filling and emptying of the sand lens, and at the same time that the excessive rise of the water table could damage roots, causing rot.
5 Discussion
Stakeholder analysis results provide an interesting insight into ecosystem services trade-off. The latter constitutes a form of interdependency between ecosystem services in which exploiting a given service negatively impacts the availability of another (Moilanen et al. Citation2011, Macchi et al. Citation2013). According to Müller et al. (Citation2016), trade-off leads to competition when the demand originates from different actors. This is the case for the conflict triggered by the MAR project in Carracillo region.
Darvill and Lindo (Citation2016) confirmed what was suggested by García-Nieto et al. (Citation2015), i.e. stakeholders linked to policy (environmentalists, government members, scientists) have a stronger influence on environmental management decisions. This is reflected in regulating and cultural services (Millennium Ecosystem Assesment Citation2005) being preferred over others. On the other hand, they state that stakeholders relying on ecosystem services for their subsistence (farmers, hunters) are more likely to assign greater importance to productive ecosystem services.
Contrary to this, the results of our study suggest that not all stakeholders linked to policy seem to assign the most importance to regulating and cultural services. The Junta de Castilla y Leon has been promoting an economic model increasingly aimed at exportation and production of horticultural crops, leading to the need for ever-increasing amounts of water (Antequera et al. Citation2014) and to the expansion of hectares to irrigate (Rivas-Tabares et al. Citation2018). The choice to promote an economic model based on crops with high irrigation requirements in an area that does not have adequate climatic characteristics or water availability denotes a vision that puts productive services first, at the expense of cultural and regulating ones.
On the other hand, stakeholders who have always relied on activities closely connected with the well-being of the river (resineros, traditional farmers) seem to have a broader vision of the impacts the implementation of the third phase could have on the environment as well as on ecosystem services, according their preference to regulating services. El Carracillo region exhibits a strong trade-off relationship between productive services (agriculture) and provision and cultural services (biodiversity conservation, urban water supply, tourism). As previously stated, agriculture was considered separately from the other three ecosystem services, namely biodiversity conservation, urban water supply, and tourism and recreational activities, to ensure all stakeholders felt adequately represented during a proper mediation process.
In , the trade-off curve is shown in green and corresponds to the sum of the two utility functions with respect to the variation of qmin () and qmax (). To agriculture a weight of 1 is attributed, while the sum of the weights of the other three services is equal to 1. The attribution of weights and the use of weight scenarios allows us to highlight some fundamental issues. An apparent paradox exists in the construction of SPI that can only be solved through an accurate attribution of weights. The introduction of another ecosystem service in the SPI would in principle bring even more importance to the conservation of the river. But if the weights are homogeneous, such as in WSA, and the service has a consistently high value that does not depend on the considered flow classes, it will inevitably bring the SPI up. If this parameter is used to assess river vulnerability, the decision maker may be nudged in the wrong direction. This further explains why WSB also considers the dependence of ecosystem services on flow classes through AHP.
An example of the effects of an uninformed attribution of weights is provided by the analysis of graphical outputs. In it is possible to observe that the shaded area corresponding to the impact that the change in concession rules would have over SPI is clearly greater for Weight Scenario B than it is for Weight Scenario A. In this particular case, then, an uninformed selection of ecosystem service weights would have led to an underestimation of the recharge effects on the ecosystem. FU values are unaffected by the choice of weight scenario, since weights do not apply to this function.
The analysis of the optimization results provides interesting insights. Optimum values of qmin resulting from single-parameter optimization are very similar (close to 1.6 m3/s) regardless of the weight set used. This value is much higher than that prescribed by third-phase concession rules (0.60 m3/s), suggesting that further studies – and possibly a re-negotiation of the concession – should take place, as this would allow better accounting for ecosystem needs without too great an impact on Carracillo agriculture. The optimum value thus obtained constitutes an important result, since it suggests an inherent “optimality” of such a value, allowing us to deem it suitable for a revised set of concession rules regardless of the chosen weight scenario.
Multi-parameter optimization shows similar values concerning qmin, while providing very high values related to qmax. A high value for the parameter is to be expected, because once the ecosystem services have all been safeguarded by the imposition of a high enough minimum flow value, allowing the derivation of a large amount of water does not induce much damage and can conversely benefit Carracillo farmers, thus raising the value of the objective function. In a way, allowing the derivation of any flow value while maintaining a minimum flow downstream of the derivation would not differ significantly from reducing the overflow with a spillway. Moreover, the very high values that come from the mathematical optimization should be treated as such, i.e. as merely mathematical results. Since water from the derivation is transported to the sandstone lens through existing open-channel pipes, it would make sense to restrict the changes to concession rules to only altering the minimum flow value to be guaranteed downstream. This way, no change in infrastructure is necessary.
The results of the optimization performed with CHD-prescribed environmental flow values led us to another fundamental consideration. The results are very similar to those prescribed by the third-phase concession rules. This highlights how this case study is strongly influenced by the chosen environmental flow values. This makes the model easily exploitable by those who set the values to be used. Thus, the technician, or anyone who will use the presented tool to lead the mediation procedure, will have the responsibility to find an agreement among the participants, through a participatory process, regarding the values to be used for the model.
6 Conclusions
Two crucial issues were considered in approaching the presented case study. First, the actors who will suffer the most from the negative impacts of the project were not involved in the planning phase, nor in the management phase. Second, ecosystem services were not considered during the design of the MAR project in the Carracillo region.
The proposed framework, based on stakeholder analysis, aimed at providing possible solutions to the conflict caused by contrasting water needs. Stakeholder analysis showed that the perceptions of ecosystem services provided by Cega River are divided, as they rely on contrasting choices for what concerns water allocation. Thus, in order to make each water user feel adequately represented in a hypothetical participatory process, water for agriculture was considered separately from other ecosystem services.
An assumption was made that environmental flow values proposed by CHD were inadequate since they represent less than 10% of the average monthly flow, the threshold below which the river is no longer able to provide the fundamental ecosystem service of biodiversity conservation. The optimization performed using environmental flow values obtained using Tennant’s thresholds showed that the resulting optimum values of minimum flow to be guaranteed downstream of the derivation are very similar for both weight scenarios, being around 1.6 m3/s. This suggests that an inherent advantage may come from setting the minimum flow to a higher value than the value (0.60 m3/s) prescribed by the third-phase concession. Moreover, the optimization performed on the biodiversity conservation utility function calculated using environmental flow values provided by CHD demonstrated that, despite being slightly influenced by the chosen weight scenario, the optimum minimum flow sets itself at values similar to, although always higher than, 0.6 m3/s. This confirms that further studies, and possibly a re-negotiation of the concession, should take place, as they would allow better accounting for ecosystem needs without too great an impact on Carracillo agriculture. At the same time, this highlights that this case study is strongly influenced by the chosen environmental flow values, warning us of the fact that the results could be easily exploited by whoever will set the values to be used for the model.
Finally, further study will necessarily involve a thorough analysis of the impact that the third-phase implementation will have on ecosystem services provided by pine trees that cover the sandstone lens where water diverted by Cega River will be stored.
The data collected during this work and related considerations will be offered to local administration to facilitate the mediation of the ongoing conflict, by providing science-based solutions. There is hope that this framework will encourage participatory management of water resources in the region, while sustaining mediation processes between conflicting parties by facilitating the visualization of the effects of different allocation choices.
Acknowledgements
This paper and the research behind it would not have been possible without the exceptional support of Prof. Lucia De Stefano (Universidad Complutense de Madrid). The authors also thank Fundación Nueva Cultura del Agua and Fundación Botín. Finally, special thanks go to the people of El Carracillo region who provided support during the fieldwork. The authors are also grateful to the two anonymous reviewers, who contributed to improving the quality of the paper with their constructive comments.
Disclosure statement
No potential conflict of interest was reported by the authors.
References
- Adamowski, K., Prokoph, A., and Adamowski, J., 2009. Development of a new method of wavelet aided trend detection and estimation. Hydrological Processes: An International Journal, 23 (18), 2686–2696. doi:https://doi.org/10.1002/hyp.7260.
- Ahmad, S. and Simonovic, S.P., 2004. Spatial system dynamics: new approach for simulation of water resources systems. Journal of Computing in Civil Engineering, 18 (4), 331–340. doi:https://doi.org/10.1061/(ASCE)0887-3801(2004)18:4(331).
- Allen, R.G., et al., 1998. Crop evapotranspiration-Guidelines for computing crop water requirements-FAO Irrigation and drainage paper 56. Fao, Rome, 300 (9), D05109.
- Antequera, C.M., Gamo, R.M., and Rubio, J.M., 2014. Estudios preliminares para el diseño de una instalación de recarga artificial en la zona oriental del acuífero de “El Carracillo, Segovia”. Boletín geológico y minero, 125 (2), 187–202.
- Arranz, D.M., 2019. La recarga del Acuífero de El Carracillo. lista en 2023. Available from: https://www.eldiasegovia.es/noticia/z7c6b2026-0765-6b96-be5d53f57f11ee72/la-recarga-del-acuifero-de-el-carracillo-lista-en-2023 [Accessed 10 Jan 2020].
- Beven, K., 1979. A sensitivity analysis of the Penman-Monteith actual evapotranspiration estimates. Journal of Hydrology, 44 (3–4), 169–190. doi:https://doi.org/10.1016/0022-1694(79)90130-6.
- Biggs, S. and Matsaert, H., 1999. An actor-oriented approach for strengthening research and development capabilities in natural resource systems. Public Administration and Development, 19, 231–262.
- CampoCyL, 2015. El regadío tira de la agricultura [online]. Accessed February 2018. Available from: https://www.campocyl.es/category/sector/el-regadio-tira-de-la-agricultura/
- Ceballos, A., Martı́nez-Fernández, J., and Luengo-Ugidos, M.A., 2004. Analysis of rainfall trends and dry periods on a pluviometric gradient representative of Mediterranean climate in the Duero Basin, Spain. Journal of Arid Environments, 58, 215–233. doi:https://doi.org/10.1016/j.jaridenv.2003.07.002
- Daily, G.C., 1997. Introduction: what are ecosystem services. In Nature's services: societal dependence on natural ecosystems. Washington, DC: Island Press, 1–10.
- Darvill, R. and Lindo, Z., 2016. The inclusion of stakeholders and cultural ecosystem services in land management trade-off decisions using an ecosystem services approach. Landscape Ecology, 31 (3), 533–545. doi:https://doi.org/10.1007/s10980-015-0260-y.
- De Condappa, D., Chaponnière, A., and Lemoalle, J., 2008. A decision-support tool for water allocation in the Volta Basin. Water International, 34 (1), 71–87. doi:https://doi.org/10.1080/02508060802677861.
- Del Blanco Medina, V. and Nafría García, D.A., 2015. Mapa de cultivos y superficies naturales de Castilla y León. In: J. Bustamante, et al., ed. XVI Congreso de la Asociación Española de Teledetección. Teledetección: Humedales y Espacios Protegidos. Sevilla (Spain), 32–35.
- Dryzek, J.S. and Berejikian, J., 1993. Reconstructive democratic theory. American Political Science Review, 87 (1), 48–60. doi:https://doi.org/10.2307/2938955.
- Dyson, M., Bergkamp, G., and Scanlon, J., 2003. Flow: the essentials of environmental flows. Gland, Switzerland and Cambridge, UK: IUCN, 20–87.
- Estrela, T., Pérez-Martin, M.A., and Vargas, E., 2012. Impacts of climate change on water resources in Spain. Hydrological Sciences Journal, 57 (6), 1154–1167. doi:https://doi.org/10.1080/02626667.2012.702213.
- Fanaian, S., et al., 2015. An ecological economic assessment of flow regimes in a hydropower dominated river basin: the case of the lower Zambezi River, Mozambique. Science of the Total Environment, 505, 464–473. doi:https://doi.org/10.1016/j.scitotenv.2014.10.033
- Fernández Escalante, E. and López Gutiérrez, J., 2002. Hydrogeological studies previous to the artificial recharge of Los Arenales aquifer, Duero basin (Spain).
- Freeman, K., 2001. Water wars? Inequalities in the Tigris-Euphrates river basin. Geopolitics, 6 (2), 127–140. doi:https://doi.org/10.1080/14650040108407720.
- García-Nieto, A.P., et al., 2015. Collaborative mapping of ecosystem services: the role of stakeholders’ profiles. Ecosystem Services, 13, 141–152. doi:https://doi.org/10.1016/j.ecoser.2014.11.006
- Hernandez-Mora, N., De Stefano, L., and Tordesillas, P., 2018. Taller sobre agua y desarrollo rural sostenible en la comarca del Carracillo. Segovia: Chañe.
- Hess, C. and Ostrom, E., 2003. Ideas, artifacts, and facilities: information as a common-pool resource. Law and Contemporary Problems, 66 (1/2), 111–145.
- International River Foundation, 2007. The Brisbane Decalaration [online]. Accessed February 2018. Available from: http://riverfoundation.org.au/wp-content/uploads/2017/02/THE-BRISBANE-DECLARATION.pdf
- Jonch-Clausen, T., 2004. Integrated water resources management (IWRM) and water efficiency plans by 2005: why, what and how? Sweden: Global Water Partnership.
- Karamouz, M., et al., 2006. A system dynamics-based conflict resolution model for river water quality management. Iranian Journal of Environmental Health Science & Engineering, 3 (3), 14.
- Khan, S., Yufeng, L., and Ahmad, A., 2009. Analysing complex behaviour of hydrological systems through a system dynamics approach. Environmental Modelling and Software, 24 (12), 1363–1372. doi:https://doi.org/10.1016/j.envsoft.2007.06.006.
- Korsgaard, L., et al., 2005. Quantification of environmental flows in integrated water resources management. WIT Transactions on Ecology and the Environment, 83, 141–150.
- Korsgaard, L., 2006. Environmental flows in integrated water resources management: linking flows, services and values. Thesis (PhD). Institute of Environment & Resources. Technical University of Denmark.
- Korsgaard, L., et al., 2008. A service and value based approach to estimating environmental flows. International Journal of River Basin Management, 6 (3), 257–266. doi:https://doi.org/10.1080/15715124.2008.9635353.
- López, G., et al., 2010. Los regadios y la gestion integral de los recursos hidricos en el acuifero de Los Arenales, comarca de El Carracillo (Segovia). Neurocritical Care, 13 (2), 239–242. doi:https://doi.org/10.1007/s12028-010-9395-5.
- Macchi, L., et al., 2013. Trade-offs between land use intensity and avian biodiversity in the dry Chaco of Argentina: a tale of two gradients. Agriculture, Ecosystems & Environment, 174, 11–20. doi:https://doi.org/10.1016/j.agee.2013.04.011
- Madani, K. and Mariño, M.A., 2009. System dynamics analysis for managing Iran’s Zayandeh-Rud river basin. Water Resources Management, 23 (11), 2163–2187. doi:https://doi.org/10.1007/s11269-008-9376-z.
- Millennium Ecosystem Assesment, 2005. Ecosystems and human well-being: wetlands and water. Washington, DC: World Resources Institute, 5.
- Ministerio para la Transición Ecológica y el Reto Demográfico [ online]. Accessed February 2018. Available from: https://www.miteco.gob.es
- Moilanen, A., et al., 2011. Balancing alternative land uses in conservation prioritization. Ecological Applications, 21 (5), 1419–1426. doi:https://doi.org/10.1890/10-1865.1.
- Moreno, M.M., et al., 2016. El agua en la Sierra de Guarrama. Boletín de la Real Sociedad Española de Historia Natural, Sección Geológica, 110, 65–88.
- Müller, D., et al., 2016. Competition for land-based ecosystem services: trade-offs and synergies. In: J. Niewöhner, et al., eds. Land use competition. Cham: Springer International Publishing, 127–147.
- Mutiga, J.K., et al., 2010. Water allocation as a planning tool to minimise water use conflicts in the upper Ewaso Ng’iro North Basin, Kenya. Water Resources Management, 24 (14), 3939–3959. doi:https://doi.org/10.1007/s11269-010-9641-9.
- Nandalal, K.D.W. and Simonovic, S.P., 2003. Resolving conflicts in water sharing: a systemic approach to water conflicts. Water Resources Research, 39 (12). doi:https://doi.org/10.1029/2003WR002172.
- Narduzzo, A. and Rossi, A., 2003. Modularity in action: GNU/Linux and free/open source software development model unleashed. ROCK working papers No. 020. Department of Computer and Management Sciences, University of Trento, Italy.
- Nelder, J.A. and Mead, R., 1965. A simplex method for function minimization. The Computer Journal, 7 (4), 308–313. doi:https://doi.org/10.1093/comjnl/7.4.308.
- Phelps, D., 2007. Water and conflict: historical perspective. Journal of Water Resources Planning and Management, 133 (5), 382–385. doi:https://doi.org/10.1061/(ASCE)0733-9496(2007)133:5(382).
- Poff, N.L., et al., 1997. The natural flow regime. BioScience, 47 (11), 769–784. doi:https://doi.org/10.2307/1313099.
- Reed, M.S., 2008. Stakeholder participation for environmental management: a literature review. Biological Conservation, 141 (10), 2417–2431. doi:https://doi.org/10.1016/j.biocon.2008.07.014.
- Reed, M.S., et al., 2009. Who’s in and why? A typology of stakeholder analysis methods for natural resource management. Journal of Environmental Management, 90 (5), 1933–1949. doi:https://doi.org/10.1016/j.jenvman.2009.01.001.
- Rivas-Tabares, D., et al., 2018. An accurate evaluation of water availability in sub-arid Mediterranean watersheds through SWAT: Cega-Eresma-Adaja. Agricultural Water Management, 212, 211–225. doi:https://doi.org/10.1016/j.agwat.2018.09.012
- Saaty, T.L., 2008. Decision making with the analytic hierarchy process. International Journal of Services Sciences, 1 (1), 83. doi:https://doi.org/10.1504/IJSSCI.2008.017590.
- Serageldin, I., 2009. Water wars? A talk with Ismail Serageldin. World Policy Journal, 26 (4), 25–31. doi:https://doi.org/10.1162/wopj.2010.26.4.25.
- Tennant, D.L., 1976. Instream flow regimens for fish, wildlife, recreation and related environmental resources. Fisheries, 1 (4), 6–10. doi:https://doi.org/10.1577/1548-8446(1976)001<0006:IFRFFW>2.0.CO;2.
- TRAGSATEC, 2018. Memoria: Proyecto basico para la gestion hidrica del sector oriental del acuifero cuaternario y obras de mejora del regadio en la zona norte de la comarca El Carracillo (Segovia). Valladolid: ITACyl.
- Trottier, J., 2003. Water wars: the rise of a hegemonic concept. Paris: UNESCO International Hydrological Programme technical document, PCCP Ser. 6.8.
- Viñas, J.I.G. and Sanz, V.G., 2005. Estudio de las implicaciones ambientales de las actuaciones de bombeo-recarga artificial sobre las masas forestalesde la zona de “El Carracillo” (Segovia). Madrid: Universidad Politecnica de Madrid.
- Warner, J., 2012. Three lenses on water war, peace and hegemonic struggle on the Nile. International Journal of Sustainable Society, 4 (1/2), 173. doi:https://doi.org/10.1504/IJSSOC.2012.044672.
- Wolf, A.T., 2009. A long-term view of water and security: international waters, national issues and regional tensions. In: C. Lipchin, D. Sandler, and E. Cushman, eds. The Jordan River and Dead Sea Basin. Dordrecht: Springer Netherlands, 3–19.
- Yates, D., et al., 2005. WEAP21—a demand-, priority-, and preference-driven water planning model: part 1: model characteristics. Water International, 30 (4), 487–500. doi:https://doi.org/10.1080/02508060508691893.
- Zomorodian, M., et al., 2017. Development and application of coupled system dynamics and game theory: a dynamic water conflict resolution method. PloS One, 12 (12), 12. doi:https://doi.org/10.1371/journal.pone.0188489.