
 ?Mathematical formulae have been encoded as MathML and are displayed in this HTML version using MathJax in order to improve their display. Uncheck the box to turn MathJax off. This feature requires Javascript. Click on a formula to zoom.
ABSTRACT
The city of Hamilton, Ontario, provides services to its residents through rigorous land-use planning and management. Policies, guidelines, manuals, plans, and specifications are the tools used for land-use planning. Goal Sustainable Development Goal (SDG) 11 of the Paris Agreement to combat climate change seeks to “Make cities and human settlements inclusive, safe, resilient and sustainable.” In this study, the SDG 11.3.1 indicator – the ratio of the land consumption rate to the population growth rate – is estimated for three periods: 2000–2005, 2005–2010, and 2010–2015. The indicator values for the three study periods are 0.915, 0.84, and 0.783, respectively, meaning that the population growth rate is greater than the land consumption rate. This study forms a baseline assessment of the indicator and tries to couple it with the present land-use planning tools for monitoring as well as future developments. The key area looked at in this study for planning is stormwater management for projected climate change.
Editor S. Archfield Associate Editor S. Pande
1 Introduction
“The Sustainable Development Goals [SDGs] are the blueprint to achieve a better and more sustainable future for all” (United Nations Citation2015). The SDGs were introduced in 2015, as part of “The 2030 Agenda” of the Paris Agreement by the United Nations General Assembly. A total of 17 SDGs, with targets and indicators for each, have been signed. Unlike their predecessor, the Millennium Goals, the SDGs are intended to apply to all individuals.
The world’s cities occupy just 3% of the Earth’s land but account for 60–80% of energy consumption and 75% of carbon emissions (United Nations Citation2015). The COVID-19 pandemic made it clear that urban planning is critical for sustainability. SDG 11 focuses on cities, and SDG 11.3.1 is the candidate target for this study. The goal, target, indicator, category, secondary indicators, custodian and partner agencies are summarized below (United Nations Citation2015, UN-Habitat Citation2018):
Goal 11: Make cities and human settlements inclusive, safe, resilient, and sustainable.
Target 11.3: By 2030, enhance inclusive and sustainable urbanization and capacity for participatory, integrated, and sustainable human settlement planning and management in all countries.
Sustainable human settlement planning: Minimizes the use of private transportation without sacrificing the creation of integrated metropolitan labour markets, generating artificial scarcity inland markets, or increasing exposure to natural disasters.
Inclusive and sustainable urbanization: Urbanization that utilizes resources (in this case land) in a manner that can accommodate population growth from migration and natural increase while preserving environmentally sensitive areas from development and limiting drawdowns of non-fungible hinterland resources such as water and waste disposal space.
Indicator 11.3.1: Ratio of land consumption rate to the population growth rate.
Indicator category: Tier II (the indicator is conceptually clear, and an established methodology exists but data on many countries is not yet available).
Secondary indicators: Land consumption per capita and the total change in urban infill (urban densification).
Custodian and partner agency: United Nations Human Settlements Programme (UN-Habitat) and United Nations Environment Programme (UNEP).
As stated above, the target defines the time limit as 2030, and evaluation is scheduled every 5 years. So, starting in 2000, there will be seven evaluation periods. Currently, the indicator is estimated from 1990 to 2015. Here, the user will be able to infer whether the trend is positive or negative over each 5-year period of estimation.
Rapid urbanization exerts pressure on freshwater supplies, sewage, the living environment, and public health. It is necessary to understand how any city is expanding with respect to land as well as population density. The literature on the assessment of SDG 11.3.1 is sparse. Some studies have been conducted on the large and small cities of South Africa (Mudau et al. Citation2020), mainland China (Wang et al. Citation2020), and metropolitan Gombe (Abdulkadir et al. Citation2019). Germany has incorporated SDG 11 into its National Sustainable Development Strategy (Koch and Krellenberg Citation2018). The City of Gothenburg, Sweden, regards the goal as having the dual function of a report card and a management tool (Hansson et al. Citation2019). Different formulations were applied to study land use in mainland Portugal (Nicolau et al. Citation2019). A regional comparison of built-up areas per capita globally was carried out using the Global Human Settlement layer (Michele et al. Citation2019). Multiscale estimation of land use efficiency was done using global open data (Schiavina et al. Citation2019).
A sustainable city is a city that maximizes its resources while minimizing the cost of goods and services and reducing greenhouse gas emissions. It also curtails informal settlements that occur due to urban sprawl. This necessitates thinking globally and acting locally to make informed decisions.
The aim of this study is to evaluate the SDG 11.3.1 indicator and sub-indicator for the city of Hamilton. The study also links the projected climate change precipitation design value to the planning tool so that citizens can avail themselves of optimized services.
2 Methodology
2.1 Study area
Hamilton city is situated at the west end of Lake Ontario, between Toronto and Niagara Falls, in the middle of the Golden Horseshoe. Hamilton Harbour, the Niagara Escarpment, 100 waterfalls, trails, a World Biosphere Reserve, and a waterfront are the key features that characterize the city. Over the years, the city’s economy declined in manufacturing and shifted to information and health services. The city is home to immigrants. The Hamilton city boundary has changed over the past century and now encompasses six communities, namely Ancaster, Dundas, Flamborough, Glanbrook, Hamilton, and Stoney Creek. Amongst the six communities, Hamilton is the core of the city, with the highest urban area. In this study, the functional boundary is the official boundary including all six communities. The core of the city is the place not only where economic activities take place but also where revitalization initiatives are currently taking place. The city is the main hub that connects to the metropolitan city of Toronto and Pearson International Airport.
The key planning tools used by the city are the Provincial Policy Statement (2020) under the Ontario Planning Act (1990), and the Municipal Class Environmental Assessment (2015) under the Ontario Environmental Assessment Act (1990). The Provincial Policy Statement couples the environmental, economic, and social factors in land use planning, whereas Municipal Class Environmental Assessment facilitates the approval process in evaluating and approving the projects. Other federal and provincial acts, such as the Ontario Water Resources Act (1990), Clean Water Act (2006), etc., play a role in the development process. These judiciary frameworks are implemented through the following guidelines: City-Wide Corridor Planning Principles and Design Guidelines, Engineering Guidelines for Servicing Land, Site Plan Guidelines, Secondary Plan, and Urban Design Guidelines. The current open data initiative provides access to geospatial data and allows citizens to participate in the planning process (Hamilton City Citation2020).
2.2 Sustainable Development Goal 11
The custodian agency, UN-Habitat, developed a standardized methodology, and the Conservation International platform developed a plug-in tool called Trends.Earth using the Quantum Geographic Information System (GIS) software for assessment (Trends.Earth Citation2018). The tool uses Google Earth Engine in a desktop cum cloud-based system. Geospatial and temporal information (satellite-derived products) are used to assess SDG 11.3.1, which is the ratio of the land consumption rate to the population growth. How these two variables are estimated is outlined below (UN-Habitat Citation2019).
2.2.1 Land consumption rate
The land consumption rate is the directly measured expansion of the built-up area. It is determined for two consecutive periods, where a period is usually 5 years long. The governing equation is given below:
where:
LCR = land consumption rate;
Urbt1 = total area covered by the urban area in the initial year t1;
Urbt2 = total area covered by the urban area in the final year t2; and
y = number of years between the two measurement periods (t1 and t2).
2.2.2 Population growth rate
The population growth rate (PGR) reflects the number of births and deaths during a period and the number of people migrating to and from. Like the land consumption rate, the population rate is determined using a governing equation:
where
Popt1 = the total population within the urban area in t1 (initial year);
Popt2 = the total population within the urban area in t2 (final year); and
y = the number of years between the two measurement periods.
2.2.3 Indicator SDG 11.3.1
The indicator is the ratio of the land consumption rate to the population growth rate (LCRPGR), as given below:
As this is a ratio, the value could be either greater than or less than 1. A value greater than 1 indicates that the city is moving in the direction of using less land per person, whereas a value of less than 1 indicates that the city is moving in the direction of using more land per person. A value close to 1 is considered a favourable characteristic of a sustainable city, whereas a value greater than 1 depicts informal settlements. This measure gives very little information, so secondary indicators were introduced.
2.2.4 Secondary indicators
To address the real situation of the human settlements and expansion patterns in cities, two secondary indicators are introduced. They are land consumption per capita (LCPC) and total change in urban infill (urban densification).
where
UrBut1 = the total built-up area within the defined t1 urban boundaries; and
Popt1 = the total population within the t1 urban boundaries.
where
But2wt1 = total built-up area in t2 within t1 urban boundaries;
But1 = total built-up area in t1; and
But1 = total built-up area in t1 within the boundaries
The pre-processing for SDG, the disaggregated global settlement layer, and the classification of the built-up area for the computation are given below.
2.2.5 Thresholds and urban extent
World population polygon data are disaggregated to built-up data and then converted into a population grid. To transform the data into a grid format, the tool defines the thresholds for the impervious surface Index, night-time lights index, and water frequency index. At the backend, the tool uses available global datasets to assign a threshold value based on the region/city in question. As the purpose of the analysis is to understand the relative change, an accurate threshold is not necessary. The user can employ finer data for the region and assign a threshold value as well in the tool. The dataset coding for each of the parameters is given in the reference documentation of the tool. Threshold values taken from the reference map for the study area are as follows:
Impervious surface index (ISI, 0–100): 30;
Night-time lights index (NTL, 0–100): 10;
Water frequency index (WFI, 0–100): 25.
The urban extent mainly comprises the built-up area and urbanized open space of the city. The urban extent is defined by the tool as follows.
Built-up areas will be classified based on the density within 500 m of each pixel radius:
Urban: > 50% built up within the 500 m radius;
Suburban: 25–50% built up within the 500 m radius;
Rural: < 25% built up within the 500 m radius.
The non-built-up areas are considered open space (OS), and will be classified as follows:
Fringe open space: OS < 100 m from urban and suburban area;
Captured open space: OS fully surrounded by fringe OS;
Rural open space: All other OSs.
Open water space is further differentiated, since its use by citizens is different from the use of OSs on land:
Fringe open space – water: Fringe OS covered by water;
Captured open space – water: Captured OS covered by water;
Rural open space – water: Rural OS covered by water.
The urban extent is determined by the combined area of classes 1, 2, 4, 5, 7, and 8 (urban, suburban, and fringe and captured OS).
2.2.6 The workflow in the Trends.Earth tool
The workflow sequence of the process for estimating the indicator is given in . Here, part of the analysis is carried out by the user, who submits the work online for further analysis. The input for the analysis is the pre-computed satellite and impervious index layer, the user-defined built-up area (referenced from the lookup map for the region), the user-uploaded shapefile of the city, and the city population from the global data.
Figure 1. Workflow showing the sequence of steps involved in estimating the indicator. Arrows represent the order of processes
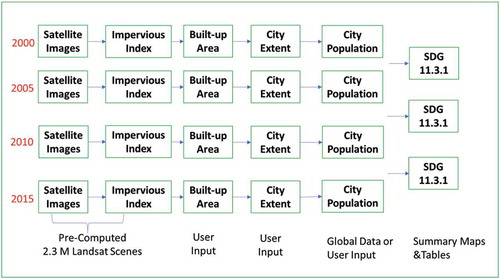
The user loads the shapefile after setting the parameters and submits the request for analysis to the Conservation International platform via Google Earth Engine. Once the lab analysis is done, the user receives a completion notification, and the resultant files can be downloaded to the user’s desktop.
2.2.7 Stormwater management in Hamilton
In Ontario, for stormwater management design, intensity-duration-frequency (IDF) curves are used. IDF curves with a 2-year to 100-year precipitation return period provide these design values. City planning and development need to revisit the historical IDF curve and study it under the lens of projected climate change values for thestormwater network design. Based on the observed changes, the urban storm drain capacity and the treatment ponds may need to be redesigned.
Environment Canada’s Royal Botanical Garden (ID – 6153301) precipitation gauging station was used for the study. The historical and climate change-projected values of the IDF curve were downloaded from IDF_CC Tool V 4.0 (IDF_CC Tool Citation2018).
To detect the change in total annual precipitation, the total annual precipitation for the city were downloaded from NASA.s Earth Data Giovanni, GLDAS_NOAH025_M_2_0/2_1, for the extent (43.17° N, 79.95° W), (43.32° N, 79.72° W) (Giovanni v 4.34 Citation2010). The nonparametric Mann-Kendall test with Sen’s slope was used to test the trend and the magnitude of the change using the R package rkt (Marchetto Citation2017).
3 Results and discussion
This section includes three subsections, namely (1) primary indicator SDG 11.3.1, (2) secondary indicator SDG 11.3.1, and (3) stormwater management design values.
3.1 Primary indicator SDG 11.3.1
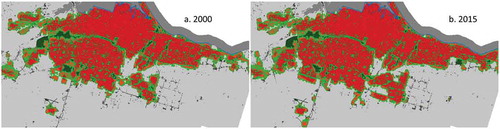
The map () shows the results of the change in urban area from 2000 to 2015 along with the official city boundary. The settlements are clustered on the shoreline of Lake Ontario, with little land consumption happening on the outskirts. shows a zoomed-in map of the urban extent (in red) for 2000 and 2015 to visualize the increase in the built-up area. The change in built-up area over the years is not well pronounced.
Figure 2. Hamilton city urban area in 2000, 2005, 2010 and 2015, with city boundary
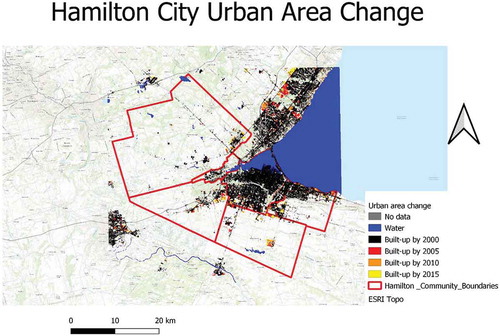
Figure 3. Zoomed-in urban area (city core) shown in red for (a) 2000 and (b) 2015
The Trends.Earth plug-in estimated the urban extent of the city and the population living there. The urban area and the population steadily increased over the years (). The city population growth rate and land consumption rate for three study periods (2000–2005, 2005–2010, and 2010–2015) are given in . From the tables, we can infer that both land consumption rates and population growth rates are decreasing over the years even though their absolute values are increasing. This is due to city’s revitalization of beaches and harbour, and because Hamilton is a city well connected with transportation. In addition, the city is connected by rail and bus to the nearby metropolitan city, Toronto. Urban rebuild encouraged the conversion of grey fields to multistory mixed condominiums.
Table 1. Urban area and population, 2000–2015
Table 2. Population growth rate and land consumption rate in the three study periods
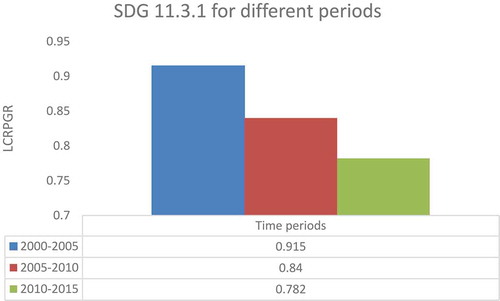
The ratio of the two metrics was taken to obtain the final SDG 11.3.1 indicator. For the city of Hamilton, the computed indicator values are 0.915, 0.84, and 0.783 for the three periods, respectively. The SDG 11.3.1 values are also shown in for the three time periods. The value of the indicator is below 1 and the value is decreasing over the years. This indicates that the land area consumption is less per person. This city optimizes the land and population whilst minimizing the cost of services and greenhouse gases. A comparable result (a value of less than 1) was found for the metropolitan city of Gombe (Abdulkadir et al. Citation2019). At the same time, the ratio increased from 0.62 (1976) to a value of 1.36 (2016) for Islamabad Capital Territory, the capital of Pakistan (Gilani et al. Citation2020).
Figure 4. Summary of the SDG 11.3.1 indicator for different periods (source: output from (Trends.Earth Citation2018)
3.2 Secondary indicator SDG 11.3.1
shows the land consumption per capita for each period. The values show a decreasing trend over time. Furthermore, the land consumption rate per capita and the total change in urban infill for each of the periods are given in . The land consumption rate is negative and shows a decreasing trend for each period. The negative value of land consumption per capita means that the land area occupied per person is decreasing. Urban areas develop via infill, extension, leapfrogging, and inclusion (UN-Habitat Citation2019). Here, in the candidate city, the official plan guides and shapes development, with land use zones designated for specific land uses. Uniquely in this case, there is separate plan for urban versus rural areas within the city, making urban-rural linkage strong for sustainability (Hamilton City Citation2020). Furthermore, the Municipal Class Environmental Assessment studies alternative methods, determining and implementing the preferred method considering social, economic, and environmental factors according to public participation and review agency input (CitationMCEA Manual 201).
Table 3. Land consumption per capita for the study years
Table 4. Summary of land consumption per capita (LCPC) and the total change in urban infill
3.3 Stormwater management design values
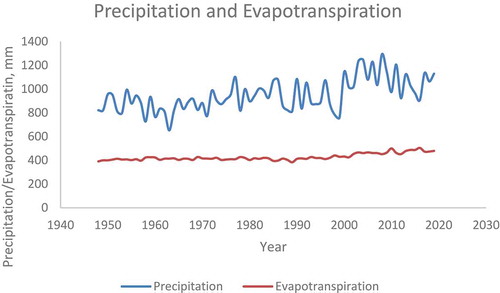
Annual precipitation for the candidate city for the period 1948–2019 is shown in . Results of the Mann-Kendall test and Sen’s slope are as follows: (1) precipitation-Tau = 0.388, 2-sided p value = 0.0000015, Sen’s slope = 3.679; (2) evapotranspiration Tau = 0.564, 2-sided p value = 2.303047E-12, Sen’s slope = 0.956. The trend is significant as the p value is less than .05 with a 95% confidence interval. From the slope, it can be inferred that in 10 years the annual total precipitation increases by 36.79 mm, whereas evapotranspiration increases by 9.56 mm. The slope of the evaporation can be taken as a proxy for the increase in built-up area. The collective effect increases the demand for a higher capacity storm water conveyance.
Figure 5. Total annual precipitation for Hamilton,in 1948–2019
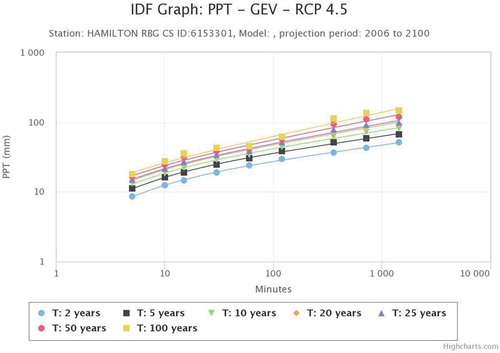
The historical and climate change-projected Representative Concentrated Pathway (RCP) 4.5 for the period 2006–2100 was studied with the IDF curve. The IDF curves for different return periods and return levels are shown in . shows the results of the percentage change in precipitation from the historical amount to RCP 4.5. Here, in general, we see an increase in precipitation that varies from 7% (2-year) to 18% (100-year return). The 6-hour and 12-hour precipitation is mainly due to thunderstorm and frontal rain, respectively, and the return level for these events showed more variability within each return period. This increase will create the need to revisit the capacity of the storm drainage system and hydraulic structures that are within the city boundary. The data will support policymakers and water managers to make informed decisions for the new stormwater management.
Table 5. Percentage change in precipitation intensity from the intensity-duration frequency curve, with climate projections
Figure 6. Intensity-duration-frequency (IDF) graph based on historical precipitation (PPT) data using generalized extreme value (GEV) distribution (source IDF_CC Tool Citation2018)
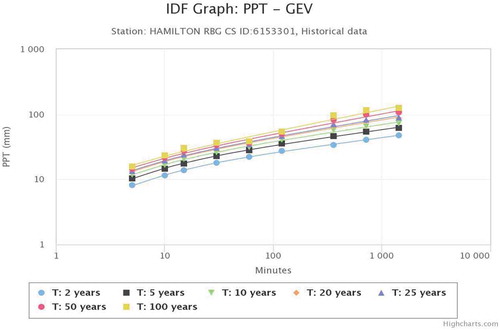
Figure 7. Intensity-duration-frequency (IDF) curve based on climate-projected PPT data (RCP 4.5) using generalized extreme value (GEV) distribution (source (IDF_CC Tool Citation2018)
4 Conclusions
This study estimated the SDG 11.3.1 indicator for the city of Hamilton. The indicator values for 2000–2005, 2005–2010 and 2010–2015 periods are 0.915, 0.841 and 0.783, respectively. This gives the baseline information that the population growth rate is higher than the land consumption rate, which is good or, in other words, favoured. Looking at the temporal trend of the indicator, the values are decreasing.
The study also looked at the percentage change in precipitation from the historical to the projected climate change RCP 4.5 values of the IDF curves. There is a significant trend in total annual precipitation and evapotranspiration, with an increase of 36.79 mm and 9.56 mm, respectively, in 10 years. This points to the actions the city must take when issuing approval for developments.
This study gives an understanding of how Hamilton, a medium-sized city near a metropolitan city, Toronto, is managing its land and providing basic services to its citizens. The study provides a baseline for the assessment of SDG 11.3.1 and presents multiple dimensions for land use planning. These could be integrated with the city planning guidelines.
Disclosure statement
No potential conflict of interest was reported by the author.
References
- Abdulkadir, I., Kumar, S., and Noon, M., 2019. Ratio of land consumption rate to the population growth rate-a case of Metropolian Gombe. Preprints(www.preprints.org). doi:10.20944/preprints201912.0047.v1.
- Gilani, H., et al., 2020. Monitoring of urban landscape ecology dynamics of Islamabad capital territory (ICT), Pakistan, over four decades (1976–2016). Land, 9 (4), 123. doi:10.3390/land9040123.
- Giovanni v 4.34, 2010. NASA earth data. Available from: https://giovanni.gsfc.nasa.gov/giovanni/ [Accessed 6 Jul 2020].
- Hamilton City, 2020. Hamilton city. Available from: https://www.hamilton.ca/ [Accessed 1 Sept 2020].
- Hansson, S., Arfvidsson, H., and Simon, D., 2019. Governance for sustainable urban development: the double function of SDG indicators. Area Development and Policy, 4 (3), 217–235. doi:10.1080/23792949.2019.1585192.
- IDF_CC Tool, 2018. Computerized tool for the development of intensity-duration-frequency curves under climate change – Version 4.0. Available from IDF_CC Tool V4.0: https://www.idf-cc-uwo.ca/ [Accessed 6 Aug 2020].
- Koch, F. and Krellenberg, K., 2018. How to contextualize SDG 11? Looking at indicators for sustainable urban development in Germany. International Journal of Geo-Information, 7, 464. doi:10.3390/ijgi7120464.
- Marchetto, A., 2017. Package ‘rkt’ 1.5. Available from: https://cran.r-project.org/web/packages/rkt/rkt.pdf [Accessed 1 Aug 2020].
- MCEA Manual, 2015. Municipal engineers association municipal class environmental assessment. Available from: https://municipalclassea.ca/manual/ [Accessed Sept 2020].
- Michele, M., et al., 2019. Principles and applications of the global human settlement layer as baseline for the land use efficiency indicator—SDG 11.3.1. International Journal of Geo-Information, 8 (2), 96. doi:10.3390/ijgi8020096.
- Mudau, N., et al., 2020. Assessment of SDG indicator 11.3.1 and urban growth trends of major and small cities in South Africa. Sustainability, 12 (17), 7063. doi:10.3390/su12177063.
- Nicolau, R., et al., 2019. Ratio of land consumption rate to population growth rate—analysis of different formulations applied to Mainland Portugal. International Journal Geo-Information, 8 (1), 10. doi:10.3390/ijgi8010010.
- Schiavina, M., et al., 2019. Multi-scale estimation of land use efficiency (SDG 11.3.1) across 25 years using global open and free data. Sustainability, 11 (20), 5674. doi:10.3390/su11205674.
- Trends.Earth, 2018. Trends.Earth tracking land change from conservation international, v 1.0.2. Available from: http://trends.earth/docs/en/index.html [Accessed 1 Sept 2020].
- UN-Habitat, Sept 2018. Sustainable Development Goal 11+ make cities and human settlements inclusive, safe, resilient and sustainable: a guide to assist national and local governments to monitor and report on SDG goal 11+ indicators. Available from Monitoring Framework-Definitions-Metadata-UN-Habitat Technical Support: https://smartnet.niua.org/sites/default/files/resources/sdg_goal_11_monitoring_framework.pdf [Accessed 20 Sept 2020].
- UN-Habitat, 2019. Land consumption rate module 3, United Nations human settlements programme. Nairobi. Available from: http://trends.earth/docs/en/background/understanding_indicators11.html [Accessed 16 Jul 2020].
- United Nations, 2015. Sustainable Development Goals. Available from: https://www.un.org/sustainabledevelopment/sustainable-development-goals/ [Accessed 6 Jul 2020].
- Wang, Y., et al., 2020. Using earth observation for monitoring SDG 11.3.1-ratio of land consumption rate to population growth rate in Mainland China. Remote Sensing, 12, 357. doi:10.3390/rs12030357.