
 ?Mathematical formulae have been encoded as MathML and are displayed in this HTML version using MathJax in order to improve their display. Uncheck the box to turn MathJax off. This feature requires Javascript. Click on a formula to zoom.
ABSTRACT
This work aims to study the water resource vulnerability in the Souss-Massa Region, Morocco. In our case 35 subdivisions were investigated for their water resource vulnerability. Based on an indicator approach and a participatory weighting method, 10 indicators and their weights were identified for the vulnerability assessment, reflecting three aspects: exposure, sensitivity and adaptive capacity. A vulnerability index map was created to compare and rank areas in terms of their vulnerability threshold. The results indicate that many regions suffer from water exploitation with an index higher than 100%, which is mainly due to the high population density and to the strong water use for irrigation. Only two subdivisions are not vulnerable to water stress, while the most vulnerable areas are generally located in the northwest of the region. Our results reflect various water management strategies, enabling decision makers to shift towards using unconventional water resources as an alternative to improve adaptive capacity.
Editor S. Archfield Associate Editor (not assigned)
1 Introduction
For several decades, urbanization, intensive agriculture, global warming and growing demand for socio-economic development have mainly reduced freshwater resources around the world and made them increasingly vulnerable to water stress (WWAP Citation2016). Vulnerability is the degree to which a region, resource or community (system) is unable to cope with adverse effects and hazards, including climate variability and extreme phenomena (EEA Citation2004a). It is a function of exposure, sensitivity and capacity to adapt to hazards (Metz et al. Citation2001, Gallopín Citation2006). As described in , the exposure and sensitivity indicators both represent the potential impacts of hazards on the analysed systems, in contrast to adaptive capacity indicators. Vulnerability increases when the exposure or sensitivity to water stress increases, and it decreases with an increase in the adaptive capacity (Metz et al. Citation2001).
Figure 1. Methodology of vulnerability index calculation: (i) exposure: the extent to which a system experiences significant hazard. It is characterized by its frequency, duration or extent in space; (ii) sensitivity: the degree to which a system can be influenced or modified, by an internal or external disturbance or set of disturbances; (iii) adaptive capacity: the ability to adapt to hazards, mitigate potential damage, take advantage of opportunities, and/or cope with the consequences
Several numerical experiments have investigated the vulnerability of water resources, combining climate model outputs, water balances and socio-economic information along digitized river systems and showing that a large part of the world’s population is currently under water stress (Downing et al. Citation2006, Hamouda et al. Citation2009, Iglesias et al. Citation2009, Stathatou et al. Citation2016). Many statements indicate that the world will face a global water deficit of 40% by 2030 (Connor Citation2015). Three-quarters of the inhabitants of the Middle East, North African and Eastern Nile basin countries live below the water scarcity threshold of 1000 m3/year, and almost half are in an extreme situation with less than 500 m3/year, particularly those in Egypt and Libya (WWAP Citation2016, El Gayar and Hamed Citation2017). The vulnerability of water resources in these countries is mainly linked to hydro-physical factors and high pressures on available water resources. In the case of poor countries (e.g. Sudan and Ethiopia), water resource vulnerability is directly linked to poverty, underdevelopment, poor water distribution and deterioration of water quality (Hamouda et al. Citation2009). Vulnerability due to water stress is also documented in the Western United State America, some provinces of China, Mexico, Southeast Australia and India (Zhou Citation2004, Liu et al. Citation2013, Connor Citation2015, Stathatou et al. Citation2016, WWAP Citation2016, Stathatou Citation2017).
Morocco is qualified as a bioclimatic and ecological transition country that contains fragile and vulnerable water resources threatened with rapid degradation in the coming decades (Tagma et al. Citation2009, Schilling et al. Citation2012, Ouhamdouch et al. Citation2016, Heiß et al. Citation2020, Hssaisoune et al. Citation2020). Although the growth of the Moroccan population is increasing, water consumption has dropped from 830 m3/capita/year in 1990 to 411 m3/capita/year in 2020, mainly in the southern part (ABHSM Citation2006, Hssaisoune et al. Citation2020). In particular, the Souss-Massa basin suffers from severe depletion of water resources (Mansir et al. Citation2018). Climate change and human pressure impact strongly the available water resources due to the expansion of irrigated areas, and due to urban and industrial growth. There is evidence of groundwater overexploitation throughout the region (Brahim et al. Citation2016), with a declining trend of 1–2 m/year (ABHSM Citation2010, Bouchaou et al. Citation2011). This decrease of groundwater level, combined with long and severe droughts, induces a deterioration of water quality linked to anthropogenic activities (Mansir et al. Citation2018). The soil and water are saline in many areas because of marine intrusion and water–rock interaction (Bouchaou et al. Citation2011, Tagma et al. Citation2009). Reduced water quantity and degraded water quality in the Souss-Massa Region are expected to become more acute in the near future (Seif-Ennasr et al. Citation2016).
To address current challenges related to the water sector, it is imperative to assess and monitor the vulnerability of water systems, as well as to adopt a sound integrated management strategy that seeks and applies alternatives for more efficient use and reduced vulnerability. Over the past 20 years, many indices have been developed to quantitatively assess the vulnerability of water resources. The main issue for characterization of water stress lies in water use, supply and scarcity (Stathatou Citation2017). The selection of water assessment criteria can be a political as well as a scientific decision (Brown and Matlock Citation2011).
Vulnerability assessment is a difficult task in defining criteria and methods of quantification (Babel et al. Citation2011). Various vulnerability approaches have been developed, and each has its advantages and/or disadvantages (Hamouda et al. Citation2009, Stathatou Citation2017). According to Stathatou (Citation2017), indicator-based approaches are the most widely used; they express vulnerability through a series of individual proxy indicators (analytical approach), or by calculating composite indicators (aggregated approach).
Despite their widespread use, the reliability and objectivity of composite indicators have been questioned in different regions around the world (OECD Citation2008, Hamouda et al. Citation2009, Stathatou et al. Citation2016, Stathatou Citation2017). There is strong controversy over the use of individual proxies versus composite indicators to assess vulnerability in water resource management specifically. Many scientists and experts have suggested that the use of composite indicators can lead to a loss of information compared to the use of numerous indicators, which allow for a more detailed and comprehensive analysis (Downing et al. Citation2006, Hamouda Citation2006, Hamouda et al. Citation2009). For these reasons, it is often preferable to develop “vulnerability profiles” by taking into consideration a number of proxy indicators (Zhou Citation2004, Downing et al. Citation2006, Stathatou et al. Citation2016).
Composite indicators are increasingly used by statistical offices of national and international organizations to report information on the performance of countries and regions in areas such as the environment, the economy, social and technological development, etc. (Saisana and Tarantola Citation2002).
However, composite indicators provide condensed information and allow for a broad variety of issues to be addressed using a single value. Moreover, composite indicators can easily communicate assessments to decision makers for their use in the protection of water resources, by providing information on complex issues in a simple and understandable form (Babel et al. Citation2011). Moreover, vulnerability indices have been adopted in several water-related studies (Hamouda Citation2006, Alessa et al. Citation2008, Stathatou et al. Citation2016, Stathatou Citation2017). Regardless of the approach selected for vulnerability assessment, special attention should be given to the selection of appropriate indicators, taking into account the different dimensions that make up vulnerability, as well as to avoiding misleading interpretation of the assessment results.
In this work, we aim to study the vulnerability of water resources to water stress in each subdivision (called circles and municipalities) of the Souss-Massa Region of Morocco. The use of tools and methods to characterize and assess the vulnerability of water resources is therefore necessary and can make a substantial contribution to the integrated management of water systems. The proposed approach is used to assess the extent to which water resources are vulnerable to various water conditions by using internationally recognized indicators reflecting physical, natural, institutional and socio-economic aspects. Additionally, we develop a vulnerability index (VI) map of the region in order to compare and rank areas, as well as to benchmark areas in terms of their vulnerability threshold. The framework adopted here allows for a comprehensive assessment of the vulnerability of water systems in the Souss-Massa Region, as well as an analysis of the potential for improvement of the systems through the use of non-conventional water resources as additional resources to address the water resource vulnerability.
2 Study area
The Souss-Massa Region is located in Southwestern Morocco (). The region covers an area of 31 577 km2 and has a total permanent population of 2 674 697 inhabitants (HCP Citation2014). In 2015, Morocco adopted a new territorial division, announced by the advanced regionalization project of 2011. The Souss-Massa Region contains six provinces, which include 19 municipalities and 16 circles, which are territorial collectivities grouping together several communes, endowed with a legal personality and benefiting from financial autonomy () (HCP Citation2014).
Figure 2. Map of the Souss-Massa Region
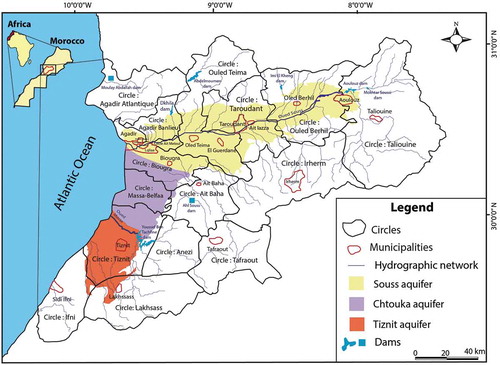
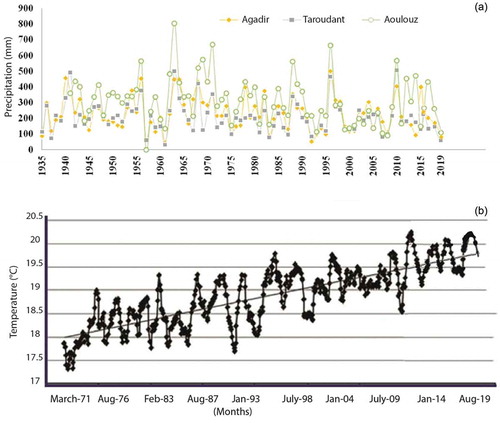
This zone is characterized by a semi-arid to sub-desert climate. Most of the rainfall is limited to the period between November and March, while the dry season lasts from May to October. Rainfall varies locally, depending on the topographic region, in frequency and quantity, ranging from 200 mm/year in the plain to 600 mm/year in the mountains (with a decrease in average annual rainfall from 343 mm in Aoulouz to 232 mm in Taroudant). In general, according to a study by Bouchaou et al. (Citation2011), monthly measurements over the last 50 years indicate high seasonal irregularities and a downward trend in rainfall ()). Over the last four decades, the Souss-Massa Region has experienced five periods of drought with relatively high temperatures, often caused by the east wind in the Sahara region. The average annual temperature varies between 14°C in the High Atlas Mountains and 20°C in the Anti-Atlas (Tagma et al. Citation2009). In contrast to rainfall, seasonal variations in temperature, according to a 12-month moving average, indicate an increase in temperature over the last few decades ()) (Bouchaou et al. Citation2011).
Figure 3. (a) Annual rainfall measured at the Taroudant, Aoulouz and Agadir measuring stations over an 80-year period (modified from Bouchaou et al. Citation2011); (b) seasonal variation of monthly temperature in Agadir showing an increasing temperature trend (modified from Bouchaou et al. Citation2011)
The economy of the region is based on agriculture, fishing and tourism. Agriculture is a strategic sector for the economy in the Souss-Massa Region. It employs more than 51% of the working population and contributes 13% of the regional gross domestic product (GDP). This region is intensively cultivated, ensuring it a leading position at the national level, especially in the production of citrus and vegetables (more than 50% of the national export volume) (Moha et al. Citation2016). Concerning water resources, groundwater is pumped mainly from the Souss, Chtouka and Tiznit aquifers () (ABHSM Citation2006, Mansir et al. Citation2018). In addition, large-scale hydraulic management allows the exploitation of surface water resources for irrigation, drinking water supply to Agadir and artificial recharge of the Souss aquifer.
The influence of intensive pumping and the decrease of precipitation are causing a decline of the groundwater level. In fact, the region mobilizes around 1 billion m3 of surface and groundwater per year, which generates a deficit of 290 million m3/year. This negative balance is compensated by groundwater pumping and consequently a depletion of the piezometric level, at a rate of 1–3 m/year. Most of the available water is used for agricultural purposes, and the remainder is used by industry and as potable water (Choukr-Allah et al. Citation2016).
3 Methodology
A water vulnerability assessment was carried out in the Souss-Massa Region using an indicator-based approach. The methodology used is a holistic approach that expresses the multifaceted nature of vulnerability. The vulnerability assessment indicators proposed in this analysis were selected because they adequately and equally express the three components of vulnerability (exposure, sensitivity and adaptive capacity), while reflecting its diversity (physical, material, technical, economic and social). Vulnerability assessment frameworks found in the literature often use a large number of indicators and parameters, which allow a detailed and thorough analysis of aquatic systems but are difficult to apply, especially in many areas simultaneously as this requires the collection of a large volume of data, which are generally not available (e.g. Sullivan et al. Citation2003, p. 22; Alessa et al. Citation2008, p. 25; Gbetibouo and Ringler Citation2009, p. 19; Hamouda et al. Citation2009, p. 32; Salmivaara Citation2009, p. 23) or focus more on the natural hydrological dimension of water system vulnerability (e.g. Hurd et al. Citation1999, Salmivaara Citation2009, Jun et al. Citation2011). The proposed indicator framework takes into account both the hydrological and the socio-economic characteristics of the systems under study (as did Zhou Citation2004, Alessa et al. Citation2008, Gbetibouo and Ringler Citation2009, Hamouda et al. Citation2009, Huang and Cai Citation2009, Babel et al. Citation2011, Sullivan Citation2011). In addition, the proposed framework can be revised and adapted to the needs of the areas under study, in order to more fully express the particular existing conditions.
The complete analysis of the vulnerability of the examined region includes several complementary methodological steps involving division of the map, data collection, selection, calculation and standardization of proxy indicators, in addition to assigning weights to each indicator to finally develop the vulnerability index.
3.1 Division of the Souss-Massa Region map and data collection
After taking the current circles and municipalities (subdivisions) as the anunitary territory of application (), the next step is to collect data on each subdivision to establish the current situation in terms of water demand, available resources (groundwater, surface and alternative resources), climatic conditions (temperature, rainfall and evapotranspiration) and data concerning the socio-economic sector (population density, education level, active population and GDP).
3.2 Selection, calculation and normalization of indicators
3.2.1 Selection and calculation of indicators
The indicators were selected following an extensive review of the literature on water resource management and vulnerability (Zhou Citation2004, Hamouda Citation2006, Hamouda et al. Citation2009, Tagma et al. Citation2009, Stathatou et al. Citation2016, Stathatou Citation2017), in order to identify the indicators that are most widely used and accepted.
Several specific criteria were taken into account in selecting the vulnerability indicators (Hamouda Citation2006, Stathatou et al. Citation2016, Stathatou Citation2017):
Availability of data: the choice of indicators focuses primarily on the availability and accessibility of data via national or regional reports and publications;
Relevance to the context of the study sites: the qualitative and quantitative indicators chosen are likely to be critical and applicable to the analysed areas;
Avoiding overlaps: To avoid double counting and overvaluation of specific problems, the analysis should not include indicators that express similar parameters to the analysed systems.
Eventually, a non-exhaustive list of 10 indicators was developed, which is sufficiently flexible for use in other study areas as well if they meet all the requirements ().
Table 1. Exposure, sensitivity and adaptive capacity indicators used to study the vulnerability of water resources to water stress
For the case of GDP, only the GDP values of the major cities are available: Agadir, Inzegane, Taroudant and Tiznit (OMPIC Citation2018). The GDP of the remaining zones was calculated using Equation (1):
3.2.2 Normalization of indicators
The objective of normalization is to adjust the indicators for smoothed dimensions over time against cyclic variability and then to put them on a common basis (OECD Citation2008). Exposure, sensitivity and adaptive capacity indicators have been expressed in such a way that a higher indicator value expresses a greater contribution.
To normalize the indicators, their values are divided by the relevant threshold. Hence, the normalized value is equal to value/threshold. Some indicator values are inverted so that higher indicator values will indicate important contributions to the system. After normalization, the threshold values are equal to 1 and the value for each indicator is between 0 and 5, corresponding to the limit of each indicator. The number 5 is a threshold value indicating the theoretical maximum possible value for each index, which means that values greater than 5 are considered equal to 5 (Stathatou et al. Citation2016, Stathatou Citation2017). This threshold value is used to facilitate the presentation of results and their illustration/mapping. The advantages of this method are its simplicity and its robustness against outliers (Stathatou et al. Citation2016).
3.3 Assignment of weights to indicators
To determine the weight of each indicator, we used the participatory weighting method (Garmendia and Gamboa Citation2012). A group of scientists and other experts in environmental, hydrological and agricultural fields, who have already carried out studies of the Souss-Massa Region, were invited to answer an online questionnaire aimed at comparing the 10 indicators of the VI. Careful recognition and selection of specialists is required to cover a wide range of knowledge and experience to ensure that appropriate weights are assigned to the indicators (OECD Citation2008). Based on their experience and subjective judgement, the experts’ answers are used to estimate the weight of each indicator according to its influence on water resources, taking into account different conditions of the region. Indicators to which more points are awarded are considered more important than those with fewer points. This method is appropriate if the composite indicator consists of a maximum of 10 to 12 indicators (OECD Citation2008).
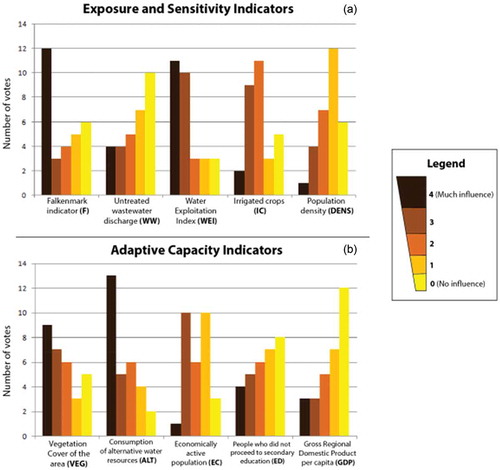
The analytical hierarchy is based on a ranking in increasing order of importance of the five indicators of exposure and sensitivity that represent potential impacts (PIs). The same procedure is applied afterward to the adaptive capacity indicators. Preference is expressed based on a scale of 0 (no influence) to 4 (great influence) (Coste Citation2018). shows the different scores assigned for each indicator according to the responses of the 30 experts.
Figure 4. Mean values of scores assigned by the experts: (a) exposure and sensitivity indicators; (b) adaptive capacity indicators
In the next step, the weight values of each indicator are calculated using EquationEquation (2)(2)
(2) :
where:
wi: Weight of the index i;
xi: Score given by the experts for the index i;
ei: Total number of experts who voted for the index i;
Wmax: Maximum weight value;
xmax: Maximum score;
etot: Total number of experts who answered the questionnaire.
4 Results and discussion
4.1 Exposure indicators
4.1.1 Renewable water resources per capita – Falkenmark indicator (F)
According to the results (), only three among the 35 subdivisions in the east of the Souss-Massa Region (Taliouine, Irherm and Tafraoute circles) show a Falkenmark indicator (F) greater than 1700 m3/year/capita. This high value is explained by the low population density and not by high rainfall (HCP Citation2014, MDGCL Citation2015). Water resource availability in the middle and western parts of the region is less than 1700 m3/year/capita, whereas for the majority of the areas (27 of 35), the F values do not exceed 1000 m3/year/capita (). This represents a major constraint on the quality of life (Falkenmark Citation1989). The standard deviation was found to be much higher than the average in all provinces except Agadir Ida Ou Tanane and Inzegane-Ait Melloul, which indicates a great variability among municipalities and circles ()).
Table 2. Calculation of the exposure indicators in the Souss-Massa Region before and after normalization (Nor). F: Falkenmark indicator; Mun.: municipality; SD: standard deviation; WW: untreated wastewater discharge as percentage of available water resources
Figure 5. Distribution of exposure classes for each province of the Souss-Massa Region against their respective thresholds (black line): (a) Falkenmark indicator map; (b) untreated wastewater discharge map
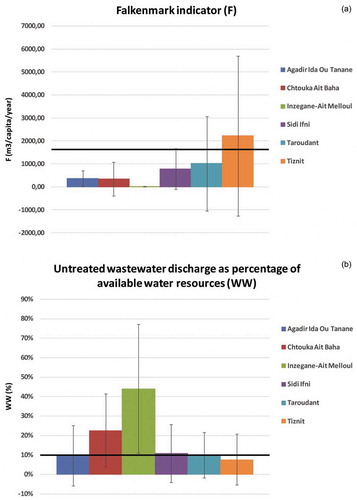
The areas suffering most from the scarcity of water resources, with low F values (less than 500 m3/year/capita), are generally located in the west of the region. This can be explained by a strong seasonal rainfall variation because the region frequently experiences long dry periods without rainfall (); other factors are its high population density (e.g. Agadir, Inzegane, Dcheira, Lqliaa and Tiznit municipalities), intensive agricultural activity (Massa-Belfaa, Biougra, Ouled Teima, El Guerdan, Taroudant circles) and important industrial activity (Ait Melloul).
This water shortage significantly decreases economic growth and social well-being when available water resources are less than 1000 m3/year/capita (EEA Citation2004b, Cosgrove and Rijsberman Citation2014). It should be noted that F measures the theoretical water potential of a region and does not relate to actual exploitable water resources, because it does not take into account the water resource quality or the availability of appropriate infrastructure and its mode of exploitation.
4.1.2 Untreated wastewater discharge (WW)
The standardized value of the untreated wastewater discharge (WW) indicator for the 35 subdivisions in the region varies from place to place, and the amount of untreated wastewater discharge seems to be non-normally distributed within the subdivisions of Agadir Ida Ou Tanane, Sidi Ifni, Taroudant and Tiznit provinces, as presented in ) and . In 18 of the 35 subdivisions, it exceeds the threshold of 10%. The municipalities Inzegane, Ait Melloul and Biougra have the highest values for this indicator (more than 40%), due to the low amount of renewable resources, important industrial activities and high population density. The lowest values for WW (less than 2%) are generally found in agricultural areas (Taroudant, Tiznit and Sidi Ifni). These results can be explained by the use of groundwater for irrigation, which is not part of wastewater discharge.
4.2 Sensitivity indicators
4.2.1 Water exploitation index (WEI)
Limited overexploitation of available resources is a common challenge in the majority of the analysed areas (Hssaisoune et al. Citation2020). As shown in , in 23 of the 35 subdivisions, the values of the water exploitation index (WEI) greatly exceed the limit of 40% (EEA Citation2004b).
Table 3. Calculation of the sensitivity indicators in the Souss-Massa Region before and after normalization (Nor). DENS: population density; IC: irrigated crops; Mun: municipality; SD: standard deviation; WEI: water exploitation index
The value of WEI for 14 zones is equal to or greater than 100%, indicating that available resources in the region have been fully depleted and are not sufficient to satisfy the demand (); furthermore, there is a large dispersion of the values with respect to the mean within the provinces of Sidi Ifni and Tiznit ()). It is therefore necessary to extract and transport water from other parts of the basin, especially in the provinces of Chtouka Ait Baha, Taroudant and Inzegane-Ait Melloul, where there is intensive agricultural activity and elevated population density. In addition, aquatic ecosystems might be at risk if water use exceeds 40% of available water resources (EEA Citation2004b, Alcamo et al. Citation2017).
Figure 6. Distribution of sensitivity classes for each province of the Souss-Massa Region against their respective thresholds (black line): (a) water exploitation index map; (b) irrigated crops map; (c) population density map
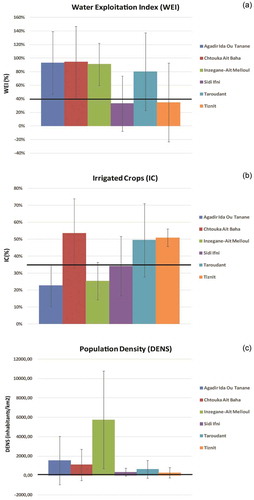
4.2.2 Irrigated crops (IC)
More than 70% of the cultivated lands are irrigated in the circles of Massa-Balfaa, Biougra, Ouled Teima, Ouled Berhil and Taroudant () and about 40% of the region’s agricultural area comprises irrigated crops (IC) ()). Additional irrigation yield is a necessary step for land cropping when the annual rainfall is less than 250 mm (ABHSM Citation2006). In areas with annual rainfall ranging from 250 to 500 mm, some crops could be grown using rain.
However, to achieve higher and more stable yields, irrigation is needed (ABHSM Citation2006). Irrigation is the largest water user in the region, as 93% of the Souss-Massa water resources are used for agriculture (ABHSM Citation2006, Seif-Ennasr et al. Citation2016, Hssaisoune et al. Citation2020).
Increased water demand for irrigated areas further exacerbates the water scarcity situation, particularly because of the great dependence of agricultural production on water irrigation. Several steps and efforts are adopted for the conversion of irrigation modes from flooding to sprinkling and to drip irrigation). In fact, the conversion to localized irrigation allows farmers to consume less water and thus will have a positive impact on future global water demand.
4.2.3 Population density (DENS)
According to ) and , economic development and rapid population growth have resulted in a non-homogeneous population density (DENS) within the five provinces, and a high population density particularly in the municipalities of Agadir, Ait Melloul, Inzegane, Dcheira-El Jihadia, Ouled Teima, Ouled Berhil, Biougra, Ait Baha and Tiznit (more than 1230 capita/km2), which exerts localized pressure on water resources. The threshold value of the DENS indicator (which was considered to be 57 capita/km2 according to the World Bank’s open-source data: World Bank, Citation2014aand World Bank, Citation2014b) is exceeded in 24 of the 35 subdivisions in the Souss Massa Region.
Although the region is still characterized by a predominance of rural areas, it nevertheless has a high degree of urbanization, with a growth rate in urban areas of 3.20% compared to a decrease (of −0.50%) in rural areas (HCP Citation2014). The urbanization rate of the region reached 56.30% in 2014, against 48.10% in 2004 and 39.50% in 1994 (HCP Citation2014). Several factors are related to the urbanization progress, including the natural increase of the urban population, the rural exodus and the extension of the urban perimeter by the integration of certain rural localities.
4.3 Adaptive capacity indicators
4.3.1 Vegetation cover of the area (VEG)
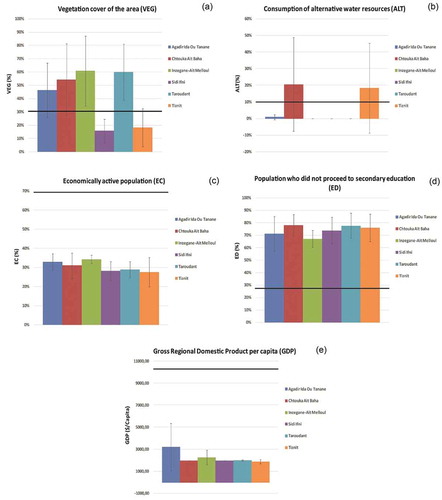
The results obtained () show that in most of the areas (22 of the 35 subdivisions), the vegetation cover indicator (VEG) is above the limit value of 31% (World Bank Citation2014b). The agricultural areas are mainly in the provinces of Chtouka Ait Baha and Taroudant, which are the highest vegetable- and citrus-producing areas in the country (Choukr-Allah et al. Citation2016) ()). The area covered by vegetation, all species combined (forests, wetlands and agricultural land), amounts to 12 356.5 km2, which represents 39.13% of the total area of the region. Despite the existence of regional forest diversity (argan, jujube, holm oak, cedar pine and juniper), the argan trees dominate more than 63% of the regional forest area, covering about 730.13 ha (MDGCL Citation2015).
Table 4. Calculation of the adaptive capacity indicators in the Souss-Massa Region before and after normalization (Nor). ALT: consumption of alternative water resources; EC: economically active population; ED: population who did not proceed to secondary education; GDP: gross regional domestic product per capita; Mun: municipality; SD: standard deviation VEG: vegetation cover of the area
Figure 7. Distribution of adaptive capacity classes for each province of the Souss-Massa Region against their respective thresholds (black line): (a) vegetation cover, (b) consumption of alternative water resources; (c) economically active population; (d) population that did not proceed to secondary education; (e) gross regional domestic product per capita
The removal of vegetation can affect the hydrological cycle and modify the hydrological properties in the soil surface area, causing negative effects on the functioning of aquatic ecosystems and contributing to water resource vulnerability. In addition, deforestation can increase the volatility of significant rainfall, simultaneously causing erosion and sedimentation at rivers downstream.
4.3.2 Consumption of alternative water resources (ALT)
According to the data originally collected by the Hydraulic Basin Agency of Souss-Massa, 7.15% of total water consumption in the region comes from unconventional resources (ALT indicator), specifically in the municipalities of Agadir, Biougra, Tafraout and Tiznit and the circle of Ait Baha () and ). This unconventional water is reused for agricultural land irrigation in the areas of Tiznit, Ait Baha, Tafraout and Biougra and for golf irrigation in Agadir municipality (ABHSM Citation2010, Malki et al. Citation2017).
4.3.3 Economically active population (EC)
The economically active population (EC) threshold selected in this analysis is the world average for 2014, which is equal to 69% (World Bank Citation2014b). The value of the EC indicator in all circles and municipalities is lower than the world average; it is between 16.76% (Irherm circle) and 37.98% (Agadir municipality) (HCP Citation2014).
This indicator reflects the social status of the population and the physical strength of society to cope with water scarcity and associated stresses. An economically active population has access to financial resources and can more easily adapt to any changes that may result in limited water resource availability. The EC indicator values for the 35 subdivisions show that 68.10% of the population is economically inactive and thus it may be difficult for them to adapt to possible changes ( and )). Higher values of this indicator reflect higher flexibility of individuals in adapting to new conditions and living patterns that may be brought about by increased stresses in water resources system, therefore, having higher human resources capacity.
4.3.4 Population that did not proceed to secondary education (ED)
In the whole region, the proportion of the population that did not proceed to the secondary education level (ED indicator) is 73.16% (HCP Citation2014). The limit value selected for this indicator is the global average in 2015, which, according to the collected data, was 28% (World Bank Citation2014b). For all areas in the region, the standardized value of ED is well below the threshold, suggesting that the educational level of the region’s population is not high compared to other regions of the country or to the rest of the world ( and )).
The lowest level of education of the ED indicator is noted in the Irherm circle, where 92.07% have not reached the second level of education, the highest being in the municipality of Agadir with 55.10% not having completed their secondary studies. The population without secondary education is considered likely to have difficulty in adapting to any changes that may reduce the water resource availability in their way of life. The main causes of school dropout are the school failure experienced by many children, especially in rural areas, and the low attractiveness of the public school, which offers no extracurricular activities that are a source of fulfillment to children. This low attraction often leads to a lack of interest in education, school failure or even dropping out by a significant portion of students. In addition, school programmes do not offer space for arts education, experimentation, and the questioning of children, activities that are essential to their development. As a result, the population’s ability to adapt to possible changes is considered to be at a low level.
4.3.5 Gross regional domestic product per capita (GDP)
In the whole region, the GDP is about $2409.34 per capita (HCP Citation2014). The limit selected for the GDP in this analysis is the world average in 2013, which is estimated at €10 280 per capita according to the World Bank (Citation2014b) database.
For all of the study areas, the standardized GDP value is below the world average, as shown in and ), indicating that the standard of living of the regional population is low compared to other regions and countries of the world. High values of the indicator reflect increased population access to technology and financial resources, which can be used to address potential water scarcity and scarcity problems (Babel et al. Citation2011).
4.4 Global vulnerability index (VI)
After the determination and calculation of the weights of each indicator, the following equation was obtained (EquationEquation (3)(3)
(3) ). Then, on the basis of this equation, a comparative assessment of the level of vulnerability among 35 subdivisions was carried out.
According to the VI values, different levels of vulnerability can occur, depending on different combinations of exposure, sensitivity and adaptive capacity of the studied systems. In high-exposure areas, high vulnerability results from increased sensitivity and low adaptive capacity, while resistance is high in systems with high adaptive capacity and less exposure to risks. VI values greater than zero indicate that the system is vulnerable to water scarcity, and those below zero indicate a robust system. For the interpretation of VI, the scale was divided into four ranges, each one indicating vulnerability or resilience conditions of the studied systems ()).
Figure 8. (a) Thematic vulnerability index map of the Souss-Massa Region; (b) graph of the vulnerability index for each province of the Souss-Massa Region
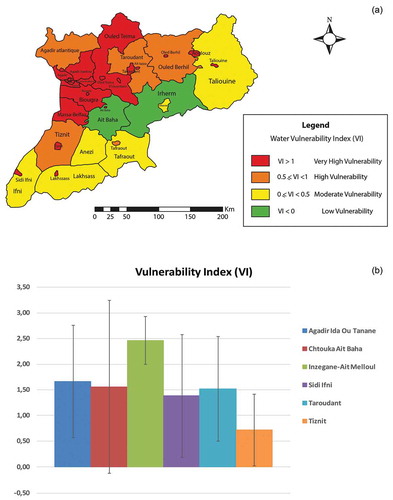
As shown in ) and , most areas of the Souss-Massa Region are marginally vulnerable to water stress (VI > 0). Two of the 35 zones are resistant to water scarcity, with IV values less than zero (Ait Baha circle and Irherm circle, with the former being the most resistant). These two zones combine very low exposure and sensitivity with an adaptive capacity greater than the margin. The circles of Ifni, Lakhsass, Taliouine, Tafraout and Anezi and the municipality of Irherm are moderately vulnerable to water scarcity (0 ≤ VI < 0.50). The remaining areas are vulnerable or very vulnerable to water scarcity due to their very high exposure, sensitivity and moderate adaptive capacity (VI > 0.50).
Table 5. Calculation of the water resources vulnerability index (VI) in the Souss-Massa Region. Mun: municipality; SD: standard deviation
According to the comparative assessment of the circles and municipalities of the Souss-Massa Region, the municipality of Ait Baha (VI = 3.02) is the most vulnerable and the circle of Ait Baha (VI = −1.31) is the least vulnerable. These areas are vulnerable to adverse water-related conditions to a smaller or greater extent, requiring intervention measures to improve their status and to meet natural and societal needs.
The statistical analysis shows that the values are normally distributed and that there is no great variability between the provinces, with the exception of the province of Chtouka Ait Baha, where the standard deviation is well above the average, indicating a preponderance of low values ()).
4.5 Vulnerability index contribution
Many complex indicators for assessing the vulnerability of water systems found in the literature are applied at regional, national or international levels, making it impossible to determine the specific local pressures and needs of a small community or watershed (Alessa et al. Citation2008, Babel et al. Citation2011). Analysis on such a large scale does not provide sufficient information to understand complex local problems and identify solutions to resolve them, but can serve as a preliminary step to identify areas for further analysis or for rough comparisons and localization.
In addition, the application of other complex indicators for assessing the vulnerability of water systems, which are applied on a smaller scale, is limited to the administrative boundaries of study areas (e.g. Sullivan Citation2011) or areas with specific characteristics (e.g. Alessa et al. Citation2008, Gbetibouo and Ringler Citation2009). In the present paper, vulnerability assessment of water systems is carried out at the spatial scale of the watershed to capture the current situation. However, there are no restrictions on the spatial or temporal scale of application of the proposed method. VI can be used to compare vulnerability between regions, but also between time periods for these regions, which can range from entire states to sub-basins of a watershed or small communities, with appropriate adjustment of indicators. VI is also a measure for evaluating possible interventions, helping to identify the most appropriate measures to address water scarcity in the areas under study, and can be used as a decision-making tool on issues related to water resource use and management (in combination, of course, with other tools that assess different factors, e.g. economic ones).
Despite numerous vulnerability studies carried out in Morocco and the Souss-Massa Region (Tagma et al. Citation2009, Schilling et al. Citation2012, Ouhamdouch et al. Citation2016, Baki et al. Citation2017, Mansir et al. Citation2018), this is the first time that this method has been applied in the region to identify, calculate and assess the vulnerability of water resources in each circle and municipality of the region. The adaptation and application of this method, as proposed in this paper, provide a systematic framework for the analysis of the identified indicators, with appropriate measures to address them. Finally, through the application of the proposed methodological framework, a database is being created with the vulnerability indicators used for the calculation of the vulnerability index of the region. This database is an innovative contribution of this work, as most of the data it contains are not readily available at this spatial scale and have been developed after calculations and research within the framework of this analysis.
4.6 Formulation and assessment of alternative adaptation strategies
To develop strategies for mitigating vulnerability, the critical vulnerability indicators, i.e. those having higher weights in the VI equation (EquationEquation (3)(3)
(3) ), must be taken into account and their values must be reduced. Based on the indicators in the VI equation and their corresponding weights, diverse vulnerability mitigation strategies can be developed and formulated for the domestic, urban and agricultural sectors. The results of the present evaluation can contribute useful input in the classification of adaptation strategies to reduce vulnerability, and can assist with decision-making and planning processes for enabling the application of recommended interventions, if united with alternative assessment tools.
For the purpose of tackling the problem of water resource vulnerability and to meet the needs of the growing population, the region is urged to take up the challenge of mobilizing unconventional water resources, such as desalination and wastewater reuse, for agricultural and industrial purposes. The use of unconventional water resources specifically in agriculture can contribute substantially to more efficient use of water resources and can reduce water scarcity problems (Stathatou et al. Citation2016, Mansir et al. Citation2018). Moreover, it would directly influence indicators linked to water use in the agricultural sector, which is the largest consumer of water in the region. Strategies for agricultural applications of unconventional water instead of freshwater resources are most effective in terms of vulnerability mitigation because they include the majority of indicators with significant weights. In addition, freshwater would then be devoted mainly to domestic use. However, consideration of the ALT consumption indicator is rarely found in assessments of the vulnerability of water systems that are proposed in the literature (e.g. Hamouda et al. Citation2009, Jun et al. Citation2011).
The IC, WW, WEI, VEG and ALT indicators would be directly affected by the implementation of unconventional water resource use strategies. This approach also indirectly affects the rest of the socio-economic indicators, such as GDP, EC, ED, DENS and also F, which is directly related to DENS.
Treated wastewater or desalinated seawater has been proven to be a reliable alternative water resource that can play a vital role in integrated water resources management, addressing both water demand and supply, as well as wastewater disposal and environment protection. Furthermore, the use of unconventional water resources in agriculture can be combined with additional vulnerability mitigation interventions, such as the use of water-saving irrigation techniques to avoid losses to the irrigation system (Mansir et al. Citation2018).
The region has six main wastewater treatment plants: two of them operate by percolation/infiltration on sand and four by natural lagoons. There are also many private and public treatment plants (e.g. airport, Douar-Oulad-Mimoun station in Chtouka, agricultural cooperative) and several small stations spread over different municipalities and circles in the region. In addition, several wastewater treatment plants are under construction in the Souss-Massa Region, particularly in the Agadir Atlantic circle (Malki et al. Citation2017). However, connection to the sewerage network remains relatively weak in some municipalities, such as Taroudant and Ouled Teima where only 63–85% of infrastructure is connected to the sanitation network (Malki et al. Citation2017).
Given the persistence of several climatic conditions and the overexploitation of water resources in the region, and to materialize the efforts started in recent years, decision makers have opted to build a seawater desalination station to compensate for the lack of irrigation water and to increase the supply of drinking water in the region. The project, launched as a participatory concept between the private and public sectors, will be achieved by June 2021. We noted also that many farmers practice the use of brackish water in the coastal area of Chtouka aquifer. Furthermore, The National Plan of Liquid Sanitation and Wastewater Treatment Program (PNA) was launched in 2005, jointly by the Department of the Environment and the Ministry of the Interior (MEMDE Citation2011) and sets the following specific objectives for 2030:
Achieve an overall level of connection of wastewater production units to the wastewater evacuation network of 90% by 2030;
Reduce domestic pollution by 90% by 2030;
Treat and reuse 100% of collected wastewater by 2030.
The efforts of using treated wastewater for landscape forage irrigation will contribute to efficient integrated water resource management (IWRM) in the region of Souss-Massa.
5 Conclusion
The current water-related problems affecting the Souss-Massa Region are caused by imbalances between supply and demand, with WEI exceeding 100% in many circles and municipalities. High population growth in urban areas (of 3.20% per year), heavy dependence of agriculture on irrigation (for 42.75% of the crops), water pollution and insufficient funds for the exploitation of available resources require integrated management of water resources.
The adopted methodology facilitates the study of vulnerability and a comparison of each circle and municipality of the region. The relevance of the study area, the availability of data and the avoidance of duplication were the three main criteria for the selection of the 10 indicators, which take into account both the hydrological and socio-economic characteristics of the studied water systems. At the same time, these indicators express the three components of vulnerability: exposure, sensitivity and adaptive capacity. This method can be very easily replicated and applied in other areas or sub-basins around the world, as a relatively small number of indicators (10 indicators) are used, which limits the amount of data needed to assess the vulnerability of water systems to manageable levels. Furthermore, the proposed indicators are among those most widely used, and for their calculation there generally are readily available data.
The assessment of the water resource vulnerability in each subdivision of the Souss-Massa Region, based on 10 specific indicators used to calculate the composite VI, shows that the region seems highly vulnerable. The majority of subdivisions have reached high levels of water resource vulnerability (VI > 0.50), with the exception of Ait Baha and Irherm, where the VI is negative and equal to −1.31 and −0.05, respectively.
Statistical analysis showed that for most of the exposure and sensitivity indicators, the standard deviation is higher than the average value, which indicates a heterogeneity between subdivisions within each province. On the other hand, we noted that there is not a great variability between the subdivisions of each province regarding the calculation of the VI, except in the case of the province of Chtouka Ait Baha.
The results of this research allow users to reflect on the various measures to be reevaluated, whether in terms of reviewing resource allocation or mobilizing other resources to improve adaptive capacity. Overexploitation and limited availability of freshwater are a main challenge in the region. To reduce the pressure on blue water resources prioritized for drinking water supply, agricultural fields (at least large farms) should make greater use of unconventional water resources, which are now part of the integrated and sustainable management of water resources. It is an interesting measure for adapting to climate change and reducing water vulnerability in arid areas, and allows mitigating the pressure on conventional water through appropriate and safe management. Furthermore, with its inherent flexibility, the approach has demonstrated its potential for application in different times and areas for monitoring and comparison purposes.
Author contributions
Imane Mansir: conceptualization, methodology, formal analysis, investigation, data curation, writing – original draft, writing – review and editing, resources, visualization. Lhoussaine Bouchaou: conceptualization, supervision, validation, investigation, writing – review and editing, project administration, funding acquisition. Bouchra Chebli: supervision, validation, investigation, writing – review and editing. Yassine Ait Brahim: writing – review and editing, formal analysis. Choukr-Allah Redouane: conceptualization, supervision, validation, investigation, writing – review and editing, project administration, funding acquisition.
Acknowledgements
The authors acknowledge the funding received from the European Union’s Horizon 2020 Research and Innovation programme (MADFORWATER). This work was carried out also with the support of the CHARISMA project with the assistance of Academy of Hassan II. Thanks to the editor and reviewers for their comments and suggestions for improving this manuscript. We also thank the Hydraulic Basin Agency of Souss-Massa (ABHSM), National Office of Electricity and Drinking Water (ONEE), Autonomous Multi-Services Agency of Agadir (RAMSA), High Commission for Planning (HCP) and Regional Office for Agricultural Development of Souss-Massa (ORMVA) for providing the necessary data.
Data availability statement
The data presented in this study are available on request from the corresponding author. The data are not publicly available.
Disclosure statement
No potential conflict of interest was reported by the authors.
Additional information
Funding
References
- Agence du Bassin Hydraulique de Souss-Massa (ABHSM), 2010. Note de synthèse: la réutilisation des eaux usées épurées dans le grand Agadir. Etude complémentaire pour la réutilisation des eaux usées épurées dans l’arrosage des Golfs et les espaces verts dans le Grand Agadir, Maroc.
- Agence du Bassin Hydraulique du Souss-Massa (ABHSM), 2006. Etude de révision du plan directeur d’aménagement intégré des ressources en eau (PDAIRE) des bassins du Souss-Massa. Volume 10: demande en eau agricole. Maroc.
- Alcamo, J., Henrichs, T., and Rösch, T., 2017. World water in 2025: global modeling and scenario analysis for the world commission on water for the 21st century. Germany: Centre forEnvironmental System Research, University of Kassel.
- Alessa, L., et al., 2008. The arctic water resource vulnerability index: an integrated assessment tool for community resilience and vulnerability with respect to freshwater. Environmental Management, 42 (3), 523. doi:10.1007/s00267-008-9152-0.
- AQUASTAT, 2014. On-line database: FAO land and water development division [online]. Rome, Italy. Available from: http://www.fao.org/nr/water/aquastat/main/index.stm [Accessed 12 April 2018].
- Babel, M.S., et al., 2011. Indicator-based approach for assessing the vulnerability of freshwater resources in the Bagmati River basin, Nepal. Environmental Management, 48 (5), 1044. doi:10.1007/s00267-011-9744-y.
- Baki, S., et al., 2017. Assessment of groundwater intrinsic vulnerability to pollution in the Pre-Saharan areas-the case of the Tafilalet plain (Southeast Morocco). Procedia Earth and Planetary Science, 17, 590–593. doi:10.1016/j.proeps.2016.12.151.
- Bouchaou, L., et al., 2011. Climate change and its impacts on groundwater resources in Morocco: the case of the Souss-Massa basin. In: Treidel, H., Martin-Bordes, J.L., Jason, J.G editors, Climate change effects on groundwater resources: a global synthesis of findings and recommendations. London, 129.
- Brahim, Y.A., et al., 2016. Assessment of climate and land use changes: impacts on groundwater resources in the Souss-Massa River basin. In: The Souss‐Massa River Basin, Morocco. Cham: Springer, 121–142.
- Brown, A. and Matlock, M.D., 2011. A review of water scarcity indices and methodologies. White Paper, 106, 19.
- Choukr-Allah, R., et al., 2016. Water resources master plan for sustainable development of the Souss-Massa river basin. In: R. Choukr-Allah, et al., eds. The Souss-Massa River basin, Morocco. Cham: Springer, The Handbook of Environmental Chemistry, 53.
- Connor, R., 2015. The United Nations world water development report 2015: water for a sustainable world. Paris, France: UNESCO Publishing.
- Cosgrove, W.J. and Rijsberman, F.R., 2014. World water vision: making water everybody’s business. London: Routledge.
- Coste, G., 2018. Les échelles de satisfaction: conseils pour réussir son questionnaire ! [online]. Available from: https://www.appvizer.fr/magazine/marketing/sondages-et-questionnaires/comment-choisir-echelle-d-attitude-questionnaire-de-satisfaction [Accessed 07 March 2018].
- Downing, T.E., et al., 2006. Integrating social vulnerability into water management. Climate Change.
- EEA, European Environment Agency, 2004a. Environmental Terminology and Discovery Service (ETDS). Available from: http://glossary.eea.europa.eu/terminology/ [Accessed 12 April 2018].
- EEA, European Environment Agency, 2004b. Indicator factsheet: water exploitation index (WQ01c) [online]. Available from: http://www.eea.europa.eu/data-andmaps/indicators/waterexploitation-index1/wq1_waterexploitationindex_130504.pdf [Accessed 03 March 2018].
- El Gayar, A. and Hamed, Y., 2017. Climate change and water resources management in Arab countries. In: Euro-Mediterranean Conference for Environmental Integration. Cham: Springer, 89–91.
- Falkenmark, M., 1989. The massive water scarcity now threatening Africa: why isn’t it being addressed? Ambio, 18 (2), 112–118.
- Gallopín, G.C., 2006. Linkages between vulnerability, resilience, and adaptive capacity. Global Environmental Change, 16 (3), 293–303. doi:10.1016/j.gloenvcha.2006.02.004.
- Garmendia, E. and Gamboa, G., 2012. Weighting social preferences in participatory multi-criteria evaluations: a case study on sustainable natural resource management. Ecological Economics, 84, 110–120. doi:10.1016/j.ecolecon.2012.09.004.
- Gbetibouo, G.A. and Ringler, C., 2009. Mapping South African farming sector vulnerability to climate change and variability: a sub-national assessment. Washington, DC: International Food Policy Research Institute (IFPRI) and Center for Environmental Economics and Policy in Africa (CEEPA), 2–4.
- Hamouda, M.A., El-Din, M.M.N., and Moursy, F.I., 2009. Vulnerability assessment of water resources systems in the Eastern Nile Basin. Water Resources Management, 23 (13), 2697–2725. doi:10.1007/s11269-009-9404-7.
- Hamouda, M.A.A., 2006. Vulnerability assessment of water resources systems in the Eastern Nile Basin to environmental factors. Doctoral dissertation. Institute of African Research and Studies, Cairo University.
- HCP, Direction régionale d’Agadir Haut-Commissariat au Plan, 2014. Annuaire statistique de la région du Souss Massa Draâ, Maroc. Available from: http://rgphentableaux.hcp.ma/Default1/ [Accessed 30 March 2018].
- Heiß, L., et al., 2020. Index-based groundwater vulnerability and water quality assessment in the arid region of Tata city (Morocco). Groundwater for Sustainable Development, 10, 100344. doi:10.1016/j.gsd.2020.100344.
- Hssaisoune, M., et al., 2020. Moroccan groundwater resources and evolution with global climate changes. Geosciences, 10 (2), 81. doi:10.3390/geosciences10020081.
- Huang, Y. and Cai, M., 2009. Methodologies guidelines: vulnerability assessment of freshwater resources to environmental change. China: United Nations Environment Programme (UNEP) and Peking University, 1–28.
- Hurd, B., et al., 1999. Relative regional vulnerability of water resources to climate change. Journal of the American Water Resources Association, 35 (6), 1399–1409. doi:10.1111/j.1752-1688.1999.tb04224.x.
- Iglesias, A., Moneo, M., and Quiroga, S., 2009. Methods for evaluating social vulnerability to drought. In: Coping with drought risk in agriculture and water supply systems. Dordrecht: Springer, 153–159.
- Jun, K.S., et al., 2011. Development of spatial water resources vulnerability index considering climate change impacts. Science of the Total Environment, 409 (24), 5228–5242. doi:10.1016/j.scitotenv.2011.08.027.
- Liu, X., et al., 2013. Assessing vulnerability to drought based on exposure, sensitivity and adaptive capacity: a case study in middle Inner Mongolia of China. Chinese Geographical Science, 23 (1), 13–25. doi:10.1007/s11769-012-0583-4.
- Malki, M., et al., 2017. Wastewater treatment and reuse for irrigation as alternative resource for water safeguarding in Souss-Massa region. Morocco: European Water, 59, 365–371.
- Mansir, I., et al., 2018. Groundwater resources scarcity in Souss-Massa region and alternative solutions for sustainable agricultural development. In: Groundwater and global change in the Western Mediterranean Area. Cham: Springer, 189–197.
- MEMDE, 2011. Ministère de l’eau des mines et de l’environnement département de l’environnement: stratégie de l’eau au Maroc [online]. Available from: https://www.environnement.gov.ma/PDFs/EAU/STRATEGIE_EAU.pdf [Accessed 03 February 2018].
- Metz, B., et al., 2001. Climate change 2001: mitigation: contribution of Working Group III to the third assessment report of the intergovernmental panel on climate change. England: Cambridge University Press.
- MDGCL, Ministère de l’interieur: Direction Générale des collectivités locales, 2015. Monographie Générale: la région de Souss-Massa. Maroc.
- Moha, H., et al., 2016. Socio-economics and governance of water resources in the Souss-Massa River Basin. In: The Souss‐Massa River Basin, Morocco. Cham: Springer, 335–349.
- OECD, Organisation for Economic Co-operation and Development, 2008. Handbook on constructing composite indicators, methodology and user guide [online]. Available from: http://www.oecd.org/std/42495745.pdf [Accessed 20 March 2018].
- Office Marocain de la Propriété Industrielle et Commerciale, 2018. Registre centrale du commerce [online]. Available from: http://barometre.directinfo.ma [Accessed 20 July 2018].
- Ouhamdouch, S., et al., 2016. Vulnerability and impact of climate change processes on water resource in semi-arid areas: in Essaouira Basin (Morocco). In: Energy, transportation and global warming. Cham: Springer, 719–736.
- Roser, M. and Ortiz Ospina, E., 2016. Our world in data: global rise of education [online]. Available from: https://ourworldindata.org/global-rise-of-education [Accessed 31 May 2018].
- Saisana, M. and Tarantola, S., 2002. State-of-the-art report on current methodologies and practices for composite indicator development. Ispra, Italy: European Commission, Joint Research Centre.
- Salmivaara, A., 2009. Current vulnerability and future challenges of water resources in the Irrawaddy and Salween River Basins—indicator-based geospatial analysis. Doctoral dissertation (Master’s Thesis). Helsinki University of Technology, Espoo.
- Schilling, J., et al., 2012. Climate change, vulnerability and adaptation in North Africa with focus on Morocco. Agriculture, Ecosystems & Environment, 156, 12–26. doi:10.1016/j.agee.2012.04.021
- Seif-Ennasr, M., et al., 2016. Climate change and adaptive water management measures in Chtouka Aït Baha region (Morocco). Science of the Total Environment, 573, 862–875. doi:10.1016/j.scitotenv.2016.08.170
- Stathatou, P.-M., 2017. Water reuse: environmental protection and performance measurement indicators. Thesis (PhD). School of Chemical Engineering, National Technical University of Athens.
- Stathatou, P.-Μ., et al., 2016. Vulnerability of water systems: a comprehensive framework for its assessment and identification of adaptation strategies. Desalination and Water Treatment, 57 (5), 2243–2255. doi:10.1080/19443994.2015.1012341.
- Sullivan, C.A., 2011. Quantifying water vulnerability: a multi-dimensional approach. Stochastic Environmental Research and Risk Assessment, 25 (4), 627–640. doi:10.1007/s00477-010-0426-8.
- Sullivan, C.A., et al., 2003. The water poverty index: development and application at the community scale. Natural Resources Forum, 27 (3), 189–199. doi:10.1111/1477-8947.00054.
- Tagma, T., et al., 2009. Groundwater nitrate pollution in Souss-Massa basin (South-West Morocco). African Journal of Environmental Science and Technology, 3 (10), 301–309.
- World Bank, 2014a. Online database on world development indicators [online]. Available from: https://data.worldbank.org/indicator/EN.POP.DNST [Accessed 16 April 2018].
- World Bank, 2014b. Online database on world development indicators: world development-indicators [online]. Available from: http://data.worldbank.org/data-catalog/ [Accessed 16 April 2018].
- WWAP (United Nations World Water Assessment Programme), 2016. The United Nations World Water Development Report 2016: Water and Jobs. Paris: UNESCO.
- Zhou, Y., 2004. Vulnerability and adaptation to climate change in North China: the water sector in Tianjin. Hamburg, Germany: Hamburg University and Centre for Marine and Atmosphere Science, Research Unit Sustainability and Global Change.