
 ?Mathematical formulae have been encoded as MathML and are displayed in this HTML version using MathJax in order to improve their display. Uncheck the box to turn MathJax off. This feature requires Javascript. Click on a formula to zoom.
ABSTRACT
Overland flow occurs on a land surface, making a sheet flow without any flow concentration. Under these conditions, cultivated semi-arid hillslopes experience inter-rill erosion. One objective of this study was to evaluate the hydraulic resistance caused by semi-arid crops and shrubs in two slopes’ field conditions, and the other was to learen more about the overland flow governed by Froude number. To achieve these targets, a set of rainfall simulations was performed on two slope gradients, of 4.9% and 8.9%, covered by shrubs and semi-arid crops. On these two semi-arid hillslopes, exfiltration occurred, which added flow from subsurface water by seepage. We show, for the first time, that for overland flow with Reynolds number from 1 to 100 in different crops and native Brazilian shrub, hydraulic resistance is more strongly correlated with Froude number than with Reynolds number, as were the vegetal force drag and the soil detachment rate.
Editor A. Fiori Associate Editor D. Penna
1 Introduction
Soil erosion is of concern in every agricultural region of the world due to its long-term negative effects on soil productivity. Agricultural management strongly affects soil erosion and therefore agricultural sustainability (Liu et al. Citation2011). Inter-rill erosion occurs between rills, with the detachment of soil particles resulting from the impact of raindrops and the transport of particles to the rills by splash and shallow overland flows (Balacco Citation2013). The slope gradient is an important factor that affects inter-rill erosion, as observed by Fu et al. (Citation2011), who investigated the splash contribution to inter-rill erosion. When the degree of slope increases, the resulting flow velocity increases the power of flow and the movement of particles detached by rain down the slope, thereby increasing the erosive potential (Armstrong et al. Citation2011).
Qian et al. (Citation2016) showed that inter-rill erosion caused by rainfall is highly dependent on flow hydraulic properties, such as flow velocity, flow regime, and hydraulic resistance, which are used to estimate sediment concentration. The Darcy-Weisbach resistance coefficient is often used to determine the hydraulic resistance to inter-rill erosion and can be calculated as:
where f is the Darcy-Weisbach coefficient (dimensionless), g is the acceleration of gravity (m s−2), h is the flow depth (m), s is the slope (m m−1), and Vm is the mean velocity (m s−1). However, how slope (S) and revegetation affect the resistance to overland flow remains unclear. Pan et al. (Citation2016) performed rainfall simulation experiments on bare soil, sandpaper, and grass plots with litter and without leaves that generated flow with Reynolds number varying from 30 to 1400 on slopes ranging from 2.6% to 50%. The f on a small-sized runoff plot tended to be overestimated due to the increase in flow rate or Reynolds number (Re), with downward cross-sections and a significant f–Re relation (f = KRe−1). These authors also observed a significant f–Re relationship for granular surfaces and a significant f–Fr relationship (where Fr is Froude number) for grass plots, and f increased on gentle and steep slopes with granular surfaces, whereas f decreased with increasing slopes with grass treatments.
Therefore, many researchers, including Katz et al. (Citation1995), Pan et al. (Citation2016), Qian et al. (Citation2016), and Zhao et al. (Citation2016), have identified a resistance relationship between the Darcy-Weisbach resistance coefficient (f) and Reynolds number for overland flow, which can be expressed in the following form:
where k and b are coefficients of laminar flow for which the theoretical value of b is equal to 1, and K is the laminar resistance coefficient whose theoretical value is 24. Considering the Reynolds number, Chow et al. (Citation1988) derived the following equation for open channels:
where Vm is the average velocity (m s−1), h is the flow depth (m), and υ is the kinematic viscosity coefficient of water (m2 s−1). Other investigators derived the theoretical value of K as 96 from the Moody diagram for pipe flow (Savat Citation1980, Chow et al. Citation1988, Pan et al. Citation2016).
When the sheet flow reaches only low Reynolds numbers, the drag coefficient depends solely on the Froude number: drag coefficient (CD) = f (Fr) (Tritton Citation2012); therefore, the effect of gravitational waves is the primary concern, and the viscous flow below the surface is unimportant. In that case, the Froude number is the only relevant governing non-dimensional quantity. This rule applies when nearly all the energy generated by drag is carried away by the waves rather than dissipated by viscosity. However, little is known about this flow hydraulic case in practical application, which constitutes a gap in the current field of hydrology.
Applying a novel approach to inter-rill erosion and very shallow flow for investigating the hydraulic resistance generated by a pasture in rangeland on laminar flow conditions (Re < 500, among 9 to 16), Cantalice et al. (Citation2017) found vegetal roughness parameters, such drag coefficient (CD), from grass (Brachiaria decumbens), calculated from an equation proposed by Wu et al. (Citation1999) and used by (Wilson Citation2007):
where α = h/y, h = is the flow depth (m), and y is the thickness of vegetation (m). They found an increase in the CD of the pasture when a decrease of turbulent burst flow between plants occurred. When the condition of increase in the flow depth (h) was more significant, the energy flux by water mass in the plant structure of Brachiaria decumbens resulted in the decrease of vegetation resistance force or drag force (τdrag).
From the above experimental evidence of Cantalice et al. (Citation2017), and other evidence obtained by Leite et al. (Citation2018) and Cantalice et al. (Citation2019), it possible to conclude that sheet flow produced by simulated rains had low Reynolds numbers of 7.92, 25.11, and 49, respectively. Thus, the hydraulic resistance generated by arboreal shrubs and different crops from Brazilian semi-arid regions in different slopes between 5% and 35% was better correlated to the Froude number than the Reynolds number.
The shrub in the Brazilian semi-arid region is called “Caatinga” and is composed of cactus and arboreal shrub, with individual plants varying between 1 and 3 m in height. These xerophytic shrubs have an irregular distribution in space and time because the leaves are lost during the dry season. Crops have replaced many shrubs in this Brazilian semi-arid region, leading to water erosion in many cases, which was observed by Freitas et al. (Citation2008): when natural shrub was replaced by Ipomoea batatas Lam, the runoff coefficient increased by 69% and soil losses were 1114%.
According to Wainwright and Bracken (Citation2011), there are three basic mechanisms able to generate runoff. The first mechanism occurs when precipitation arriving at the surface exceeds the infiltration capacity of the surface. The infiltration rate creates the threshold for runoff generation in one of two ways. First, the rainfall intensity can exceed the instantaneous infiltration rate of an unsaturated soil, which produces excess or Hortonian overland flow; alternatively, the saturation of the soil can produce saturation overland flow, sometimes called Dunne overland flow, as precipitation arrives on the saturated surface. The second basic mechanism of runoff generation is by exfiltration or return flow. Exfiltration occurs when saturated soil receives lateral flow from upslope, which causes the soil to exceed its capacity for moisture storage. In the downslope direction or where planform concavities occur, the subsurface flows can converge, producing a concentration of moisture that can lead to exfiltration. An overlooked case in which this mechanism could occur on dryland is when soils are thin and sitting on relatively impermeable bedrock, so that local soil moisture storage capacity is low. The dryland soils tend to have intrinsically slow rates of formation or are thin due to removal by erosion processes. In the third mechanism, Wainwright and Bracken (Citation2011) showed that the formation of subsurface pipes can deliver runoff rapidly from slopes to channels. In certain drylands, pipes are a significant method of runoff production. In all three cases, an understanding of the hydraulic characteristics of the soil, in particular the infiltration rate, is fundamental for understanding the rate of runoff production.
Analysing observations of overland flow hydraulic behaviour, and a large amount of data on overland flow hydraulic resistance, obtained from the work of Qian et al. (Citation2016), Cantalice et al. (Citation2017, Citation2019), Leite et al. (Citation2018), we have determined that sheet flow generated by simulated rains produces flows with low Reynolds numbers, ranging from 7 to 100, that do not follow the known resistance relationships between the Darcy-Weisbach resistance coefficient (f) and Reynolds number for overland flow (EquationEquation (2)(2)
(2) ) as cited by Katz et al. (Citation1995), Pan et al. (Citation2016), Qian et al. (Citation2016), and Zhao et al. (Citation2016). This lack of a good fit created the need to investigate the hydraulic resistance relationships of flows with low Reynolds numbers. As related by Tritton (Citation2012), under conditions of low Reynolds numbers, the resistance parameters depend on the Froude number; this motivated the present investigation of the relationship between resistance parameters from overland flow and Froude number.
The specific objectives of this study were as follows: (1) to evaluate the hydraulic resistance caused by plants under real conditions of overland flow and infiltration on semi-arid hillslope fields; (2) to further investigate the hydraulic behaviour of the overland flow when it is governed by the Froude number, which means that the Froude number alone governs all the energy generated by drag that is counteracted by the gravitational waves; and (3) to evaluate how the hydraulic resistance generated by different plants from the Brazilian semi-arid environment under sheet flow can affect inter-rill erosion.
2 Materials and methods
2.1 Experimental area
In the Brazilian semi-arid environment, shallow soils generally occur on slopes between 5% and 14%, which can cause infiltration problems under natural vegetation and crops. The landscape is composed of flat and smooth wavy reliefs representing 71.2% of the Cachoeira stream in the Pajeu watershed. In this landscape, the soils show less pedogenetic evolution, where few alterations of the original material had occurred, which is a soil feature of semi-arid environments. The climate in the region is classified as BSwh-type, semi-arid and hot, which means intense rainfalls with short duration (in a span of 3 or 4 months), resulting in large temporal variation. Consequently, Inceptsols occur in the Pajeu watershed, located between the middle and lower points of the landscape. This soil has a shallow (20 cm) sand surface horizon, over a 20–40 cm horizon with medium-textured cambic soil.
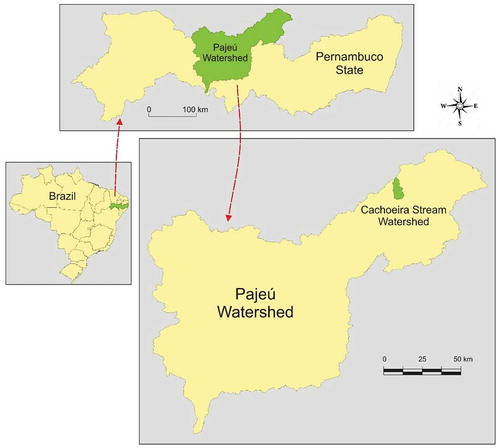
For this reason, two sets of experiments were conducted, on hillslopes (38°18ʹ45”W, 7°56ʹ15”S) with gradients of 4.9% and 8.9% that were covered with shrub and semi-arid crops. These hillslopes are part of the Cachoeira stream in the Pajeu watershed, located in the semi-arid environment of the state of Pernambuco, Brazil (). Under natural conditions, the hillslope areas have vegetation that consists of cactus and arboreal shrub (with individual xerophytic shrubs varying between 1 and 2 m in height), which is called Caatinga in Brazil, occurring in areas with low annual rainfall, between 450 and 600 mm. This vegetation is irregularly distributed both spatially and temporally (meaning that during the dry season, the shrubs lose their leaves).
Figure 1. Location of Cachoeira watershed in the Brazilian semi-arid environment of Pernambuco state, Brazil
The first set of experiments was conducted under simulated rain in a randomized block with 4 treatments and 5 replicates, totaling 20 experimental plots, with dimensions of 1 m in width by 2 m in length, bounded by aluminum sheets. The bottom of these plots contained a gutter for sampling runoff and detached and transported sediment. The slope of this field was 8.9%. The treatments consisted of four conditions created from bare soil and three vegetation types, as follows: shrub (shrub plus shrub litter); Guandu (Cajanus cajan), spaced at 1.5 × 0.7 m and 1.3 m in height; and “sweet potato” (Ipomoea batatas Lam), spaced at 0.5 × 0.25 m in herbaceous size.
The second set of experiments was conducted on another hillslope with a 4.9% slope under simulated rain in a randomized block with 3 treatments and 4 replicates, totaling 12 experimental plots with the same dimensions as the first. In this experiment, the treatments were the following: shrub (shrub plus shrub litter); cactus (Opuntia ficus-indica Mill.), spaced at 1 × 0.5 m and in a growth stage at 0.45 m in height; and bare soil.
The simulated rainfall was applied using a VeeJet 80–150 simulator with a nozzle-type spray, internal diameter 1.27 cm. The nozzle was located at a height of 3.1 m above the ground surface and operated at a constant pressure of 41 kPa at the outlet of the water nozzle to maintain consistent rain intensity. Beside the plots, 10 raingauges were randomly placed to measure the average intensity of simulated rainfall. Each event of simulated rainfall was applied for 40 min. The first experiment had an intensity of 147 mm h−1, and the second had an intensity of 105 mm h−1. These high rainfall intensities were applied to simulate a semi-arid rainfall pattern, reaching a high intensity quickly.
The soil occurring on the two hillslopes, according to USDA Soil Taxonomy (Citation1998), was an Inceptisol located between the middle and lower positions on the landscape and had a 20 cm sand surface horizon on a 20–40 cm medium-texture cambic horizon. For physical analyses, soil samples from a depth of 0–20 cm were air-dried and sieved through a 2 mm mesh (). The particle size characterization, by the hydrometer method, was (according to the USDA textural classes): clay (<0.002 mm), silt (<0.05 mm), and sand (<2 mm). Bulk density (BD, paraffin clod) and particle density (PD, flask method) were also determined. The calculation of the total porosity (TP) followed Embrapa (Solos Citation2013).
Table 1. Physical properties of soil in semi-arid Pernambuco
2.2 Determination of overland flow hydraulics
Samples of water surface loaded with sediment were collected every 5 min, for 20 seconds per sample, in plastic pots placed at the bottom of a gutter, and water discharge per unit width (q) is expressed in m2 s−1. The flow depth (h) was calculated using the equation derived by Singh (Citation1983) and Woolhiser and Liggett (Citation1967) from the kinematic wave solution of the Saint-Venant equation (this procedure was also adopted by Cantalice et al. (Citation2017):
where h is the water flow depth, q is the water discharge per unit width, and Vm is the mean flow velocity.
The surficial velocity (Vs) of flow was obtained by measuring the time required for the dye tracer (methylene blue) to travel the distance between two fixed points on the plot and is expressed in m s−1. This procedure was repeated at each 5-min interval after the formation and movement of flow. The values of surficial flow velocity obtained were multiplied by a correction factor (α = 2/3) to obtain the mean flow velocity (Vm) in m s−1, according to Katz et al. (Citation1995), Pan et al. (Citation2016), and Cantalice et al. (Citation2017). The Froude number and Reynolds number were obtained according to Simons and Şentürk (Citation1992), using the equations below:
where g is the gravity acceleration in m s−2, and kinematic viscosity υ in m2 s−1 was determined using the equation proposed by Julien (Citation2010).
According to Wu et al. (Citation1999) and Wilson (Citation2007), the vegetation drag coefficient (CD, in m−1) is obtained with EquationEquation (4)(4)
(4) . For bare soil, the drag coefficient (CD) was obtained by considering drag force as shear stress (EquationEquation (8)
(8)
(8) ):
where FD (drag force) is the force component in the direction of flow – in this case, the shear stress (τ) in Pa; ρ is the mass density of fluid (kg m−2); Vm is the flow velocity (m s−1); and A is the reference area (plot area = 2 m2). The shear stress (τ) was calculated as follows:
where γ is the specific weight of water (N m−3), h is the water flow depth (m), and s is the slope (m m−1).
The infiltration and exfiltration rates, expressed in mm h−1, were obtained by subtracting simulated rainfall intensity from surface runoff. The exfiltration values were expressed in negative values when seepage happened, which means that soil moisture stored in the landscape was added to the water discharges.
2.3 Determination of inter-rill erosion rates
The inter-rill soil detachment rate (Di) was obtained from EquationEquation (10)(10)
(10) :
where Di = is the inter-rill detachment rate (kg m−2 s−1), ms is the mass of soil detached (kg), A is the plot area (m2), and Sd is the duration of sampling (s). The soil loss (SL) was obtained using Equation (11):
where SL is the soil loss (Mg m−2); Q is the flow rate (L s−1); Cs is the concentration of sediment (kg L−1), which was obtained by the ratio between the mass of dry soil and water–sediment mixture; and t is the interval of 5 min between samplings.
The data on inter-rill erosion, overland flow hydraulics, slope of all plots (with gradients of 4.9% and 8.9%), and roughness parameters represent the average values of four repetitions, and were analysed by applying regression analysis, analysis of variance (ANOVA), and Tukey’s test (p < 0.10) using the SAS statistical software package (Littell et al. Citation1996).
3 Results and discussion
3.1 Overland flow hydraulics under seepage
show, for the two different gradient hillslopes, respectively, the measured discharges and velocities of water that flowed through and crossed plants and flowed on the bare soil. On the 8.9% hillslope (), the highest water discharge and velocity occurred on the bare soil. The highest water discharge on the 4.9% hillslope () occurred under the shrub condition, and the most expressive exfiltration process was observed on this slope, primarily in the shrub vegetation. The lowest values of velocity were obtained in the conditions imposed on flow through the shrubs in the two experiments.
Table 2. Hydraulic variables of overland flow on the semi-arid hillslope generated by simulated rainfall on different surface conditions originated by bare soil and three different vegetation types on 8.9% slope, experiment 1. Values are averages of four repetitions
Table 3. Hydraulic variables of overland flow on the semi-arid hillslope, generated by simulated rainfall on different surface conditions originated by bare soil and two types of semi-arid vegetation on 4.9% slope, experiment 2. Values are averages of four repetitions
The flows that crossed shrubs showed the highest depth and Darcy-Weisbach coefficient values on the field with a 4.9% slope. On the 8.9% hillslope under shrub, the highest Darcy-Weisbach coefficient was identified; however, all flow depths here were equal. The seepage condition observed in the bare soil that promoted the highest water discharge was also responsible for increasing the flow depth in the bare soil, equal to that under vegetation conditions. Nevertheless, all plant types affected the hydraulic resistance. The flow that occurred between Guandu plants also showed the highest values of hydraulic resistance based on the Darcy-Weisbach coefficient.
shows the relation between water discharge (q) and hydraulic resistance for all tests, including all kinds of plants tested taken together, on the 8.9% slope. The most expressive hydraulic resistance values were correlated with the lower water discharge created by shrub plants that were larger and taller, which intercepted and dispersed the rain and generated leaf drainage and stem flow. These hydrological abstractions retained and retarded the water discharge, thereby producing the lowest water discharge values due to greater infiltration of water into the soil. The same effect of interception and retention of rain and retardation of flow by the tallest plants (shrub and Guandu) resulted in a decrease in mean flow velocity ().
Figure 2. Relationship of water discharge (q) and hydraulic resistance (Darcy-Weisbach coefficient) to overland flow generated by simulated rains on a semi-arid hillslope of 8.9% with bare soil, or bare soil vegetated with shrub, Guandu beans and sweet potato. Values are averages of four repetitions
Figure 3. Relationship of mean flow velocity (Vm) and hydraulic resistance (Darcy-Weisbach coefficient) to overland flow generated by simulated rains on a semi-arid hillslope of 8.9% with bare soil, or bare soil vegetated with shrub, Guandu beans and sweet potato. Values are averages of four repetitions
In all slope conditions (), the Reynolds number was low, varying from 41 to 106, and therefore falling within the laminar flow regime. On the 4.9% slope, independent of the vegetation type, the exfiltration process also imposed significant variations on the Reynolds number (). The highest exfiltration value for shrub vegetation promoted the highest water discharge, improving the inertial forces and resulting in the highest Reynolds number for the shrub condition. The Froude number ranged from 0.2 to 0.91 on the 8.9% slope, showing sub-critical flow.
Only the flow on bare soil on the 4.9% slope showed laminar supercritical flow; all of the others showed sub-critical flow. However, as shown in , on the 4.9% hillslope, exfiltration occurred under all conditions, and the flow from subsurface water by seepage added to soil under shrub caused an increase in the water discharge and consequently increased the Reynolds number.
3.2 Hydraulic resistance relationship of shrubs and semi-arid crops governed by Froude number
Zhao et al. (Citation2016), Pan et al. (Citation2016), and Qian et al. (Citation2016) proposed a modified resistance relationship between the Darcy-Weisbach coefficient of resistance to overland flow and the Reynolds number of the form , which requires adjustment for laminar flow. For all plant cover types and for bare soil on the 8.9% semi-arid hillslope, a relation between the Darcy-Weisbach resistance coefficient and Reynolds number between 40 and 101 was found, as shown in , which produced a determination coefficient (R2) of 0.42 and some dispersion.
Figure 4. Relationship of Darcy-Weisbach resistance coefficient and Reynolds number to all plant cover types, and to bare soil, on overland flow generated by simulated rains on a semi-arid hillslope of 8.9%. Values are averages of four repetitions
Next we demonstrated, for the first time under real field conditions, that the Darcy-Weisbach resistance coefficient is more strongly adjusted to the respective Froude number than to the Reynolds number, for all crops and for bare soil on the 8.9% hillslope, and a high determination coefficient was produced (). Similarly, the Darcy-Weisbach resistance coefficient was adjusted individually for each type of plant, for the granular surface of bare soil, and for Froude numbers under the 8.9% slope (). Again, for this novel finding, high determination coefficients were obtained.
Figure 5. Relationship of Darcy-Weisbach resistance coefficient and Froude number to all plant cover types, and to bare soil, on overland flow generated by simulated rains on a semi-arid hillslope of 8.9%. Values are averages of four repetitions
Figure 6. Relationship of Darcy-Weisbach resistance coefficient and Froude number to each kind of plant cover and to the granular surface of bare soil, on overland flow generated by simulated rains on a semi-arid hillslope of 8.9%. Values are averages of four repetitions
For the experiment on the 4.9% hillslope, with the shrub plus shrub litter, cactus (Opuntia ficus-indica Mill.), and bare soil, the adjustment was repeated between the Darcy-Weisbach resistance coefficient and the Reynolds number in overland flow (). The adjustment was also applied between the Darcy-Weisbach resistance coefficient and respective Froude numbers obtained on overland flow and to Reynolds numbers between 69 and 72 (), and again, the highest determination coefficients were obtained between the Darcy-Weisbach coefficient and Froude numbers.
Figure 7. (a) Relationship of Darcy-Weisbach resistance coefficient and Reynolds number to shrub and litter, cactus and bare soil on overland flow generated by simulated rains on a semi-arid hillslope of 4.9%; (b) Relationship of Darcy-Weisbach resistance coefficient and Froude number to shrub and litter, cactus and bare soil on overland flow generated by simulated rains on a semi-arid hillslope of 4.9%. Values are averages of four repetitions
According to all regression analyses for both hillslope situations with different crops and native shrub, for 28 tests runs under real field conditions, all hydraulic resistance conditions were more highly correlated with Froude number than with Reynolds number. This result shows that all energy generated by the contact flow with vegetal elements and soil was dissipated by gravitational waves, because in this condition of thin flow, the flow became a gravitational wave or was dominated by gravitational effects. As another point to reinforce this finding, the flow in both hillslope situations had sufficiently low Reynolds numbers, from 40 to 106, which created an opportunity for gravitational effects to govern this type of flow.
This experimental evidence, reinforced by statistical analyses, shows for the first time that for flows with low Reynolds numbers, the hydraulic behaviour is governed by gravitational waves; therefore, when the Froude number solely governs all the energy generated by drag and all resistance forces generated by vegetation and soil for flows with low Reynolds number, all resistance forces are counterpointed by gravitational waves. This finding highlights the gap in the sheet flows with very low Reynolds numbers.
Pan et al. (Citation2016) also obtained a good adjustment between Darcy-Weisbach resistance coefficient and Froude number with grass plots with Reynolds numbers in the range of 30 to 320, which was classified as a low range, and when they obtained a relationship with higher Reynolds numbers (approximately 1000), the hydraulic resistance was governed by the Reynolds number.
Therefore, a range of overland flow Reynolds numbers from 1 to 100 was identified in this work and in real field conditions, with the hydraulic resistance governed by gravitational waves; it was shown here for the first time that the hydraulic resistance was governed by Froude number in the following form by one decreasing exponential:
where k and b are adjusted coefficients for laminar flow conditions, and k is the laminar resistance coefficient (Cl), according to Pieri et al. (Citation2007). The values of k and b were obtained for three semi-arid crops, native Brazilian shrub (Caatinga), and bare soil. For native Brazilian shrub, k varied from 0.828 to 0.876; for Guandu beans, k was 0.939; for potatoes, k was 0.705; for the cactus Opuntia ficus-indica Mill., the k value was 0.515; and for bare soil, k varied from 0.353 to 0.761. Thus, when the Froude number governed the overland flow, the laminar resistance coefficient k was always less than 1.
3.2.1 Drag coefficient from field conditions under seepage and governed by Froude number
shows all drag coefficient values created by all plant types and flows. According to the hydraulic resistance, the highest CD occurred due to Guandu, which was related to plant height and litter and was responsible for balancing between hydrodynamic flow and hydrological processes. The shrubs and cactus showed values between 3.6 and 5.6 m−1, comparable to those for beach morning glory (Ipomoea pes-caprae) under field conditions where Cantalice et al. (Citation2015) obtained vegetal drag coefficients (CDs) of 5.93 m−1 under a submerged condition and 2.702 m−1 under an emergent condition.
Table 4. Vegetal drag coefficient (CD) generated by shrub and semi-arid crops on overland flow conditions of the Brazilian semi-arid hillslopes. Values are averages of four repetitions
The relationships between CD and Reynolds and Froude numbers for overland flow on 8.9% and 4.9% slopes are shown in , respectively. shows that for overland flow on the 8.9% slope, the drag coefficients were best adjusted to Froude number by an exponential expression, with 10% significance for all tests, although with some dispersion. The relationship between drag coefficient and Reynolds number did not have a high determination coefficient (0.26) and showed more dispersion than the relationship between drag coefficient and Froude number.
Figure 8. (a) Relationship of drag coefficient (CD) and Reynolds number to all plant cover types, and to bare soil, on overland flow generated by simulated rains on a semi-arid hillslope of 8.9%; (b) relationship of CD and Froude number to all plant cover types, and to bare soil, on overland flow generated by simulated rains on a semi-arid hillslope of 8.9%. Values are averages of four repetitions
Figure 9. (a) Relationship of drag coefficient (CD) and Reynolds number to all plant cover types, and to bare soil, on overland flow generated by simulated rains on a semi-arid hillslope of 4.9%; (b) relationship of CD and Froude number to all plant cover types, and to bare soil, on overland flow generated by simulated rains on a semi-arid hillslope of 4.9%. Values are averages of four repetitions
shows all relationships between CD and Reynolds and Froude numbers obtained for bare soil, shrub, and cactus on the 4.9% slope. Again, the relationships were more significant with Froude numbers (r2 = 0.787, p = 10%) than with Reynolds numbers, but for this slope, the determination coefficient was higher than on the 8.9% slope, and the drag coefficient (r2 = 0.051) did not show any relation to Reynolds number.
These relationships show that the work performed by drag force counteracted the flow in gravitational waves for both slope conditions and for all plant types; therefore, Froude number rather than Reynolds number governed the resistance conditions in overland flow.
3.3 Inter-rill erosion from shrubs and semi-arid crops under seepage
The inter-rill erosion rates and runoff coefficients (C) are shown in , and show the seepage conditions. The sediment concentration was not significantly different under any condition because the concentration was a snap parameter due to sampling in 10 seconds, which often showed no difference. On the 8.9% slope, the highest soil loss value was observed on the bare soil, and a runoff coefficient greater than 1 occurred because of seepage that added the flow from subsurface water. Elephant grass, corn, and bare soil under simulated rains also showed no difference in terms of sediment concentration under semi-arid conditions. A statistically significant difference was found for inter-rill detatchment rates, by Cantalice et al. (Citation2019). In another study, Cantalice et al. (Citation2017) obtained differences in sediment concentration for pasture with different slopes and inter-rill detachment rates.
Table 5. Soil erosion rates and runoff coefficient (C) of overland flow on two semi-arid hillslopes, generated by simulated rainfalls on different surface conditions originated by bare soil, native Brazilian shrub (Caatinga), and semi-arid crops on 4.9 and 8.9% slope. Values are averages of four repetitions
The Brazilian native shrub and Guandu beans were the most protective vegetal cover as shown by their more expressive hydraulic resistance values, indicating that they intercepted and dispersed the rain, resulting in the slowest overland flow. The soil detachment inter-rill rates also showed the Brazilian native shrub and Guandu beans were the most protective plants in terms of avoiding inter-rill erosion.
On the 4.9% slope, the runoff coefficient (C) showed that exfiltration occurred in all types of soil use, which might have contributed to the increase of soil loss under shrub that equaled the loss from cactus soil. Again, the highest soil loss and soil detachment rates were observed for bare soil and were correlated to Froude number (). According to the statistical analysis derived from the experimental data, our results show for the first time that for this flow magnitude, the soil detachment inter-rill rate is also governed by the non-dimensional quantity – that is, by gravitational waves that occur in sheet flow associated with inter-rill erosion.
Figure 10. Relationship of soil detachment inter-rill rates and Froude number with shrub, cactus, and bare soil, on overland flow generated by simulated rains on a semi-arid hillslope of 4.9%. Values are averages of four repetitions
4 Conclusions
On two semi-arid hillslopes, exfiltration occurred, which added flow from subsurface water by seepage and caused an increase of the water discharge and consequently increased the Reynolds number. Here, we showed for the first time that on both hillslopes with different crops and native shrub, all hydraulic resistance conditions were more strongly correlated to Froude number than to Reynolds number; therefore, in this flow condition, sheet flow became a gravitational wave or was dominated by gravitational effects. We identified a range of overland flow Reynolds numbers from 1 to 100 and showed that hydraulic resistance was governed by gravitational waves by one decreasing exponential, according to the statistical analysis results derived from the experimental data.
The vegetal force drag also counteracted that in flow in gravitational waves; therefore, Froude number rather than Reynolds number governed the resistance conditions in overland flow for very low Reynolds numbers.
All regression analyses of the soil detachment inter-rill rates under Brazilian native shrub and Guandu beans showed that these were the most protective plants to avoid inter-rill erosion. Also, we demonstrated for the first time that for low Reynolds numbers, the flows associated with inter-rill erosion rates are also governed by Froude number – that is, gravitational waves that occur in the sheet flow are associated with inter-rill erosion.
Disclosure statement
No potential conflict of interest was reported by the authors.
Additional information
Funding
References
- Armstrong, A., et al., 2011. Variability of interrill erosion at low slopes. Earth Surface Processes and Landforms, 36 (1), 97–106. doi:https://doi.org/10.1002/esp.2024
- Balacco, G., 2013. The interrill erosion for a sandy loam soil. International Journal of Sediment Research, 28, 329–337. doi:https://doi.org/10.1016/S1001-6279(13)60043-8
- Cantalice, J.R.B., et al., 2015. Hydraulic roughness due to submerged, emergent and flexible natural vegetation in a semiarid alluvial channel. Journal of Arid Environments, 114, 1–7. doi:https://doi.org/10.1016/j.jaridenv.2014.10.012
- Cantalice, J.R.B., et al., 2017. Interrill erosion and roughness parameters of vegetation in rangelands. Catena, 148, 11–116. doi:https://doi.org/10.1016/j.catena.2016.04.024
- Cantalice, J.R.B., et al., 2019. Vegetative-hydraulic parameters generated by agricultural crops for laminar flows under a semi-arid environment of Pernambuco, Brazil. Ecological Indicators, 106, 105496.
- Chow, V.T., Maidment, D.R., and Mays, L.W., 1988. Applied hydrology. Hydrologic Processes, 2, 20–52.
- EMBRAPA – Empresa Brasileira de Pesquisa Agropecuária, 2013. Sistema brasileiro de classificação de solos. 3rd ed. Revista e ampliada. Brasília, DF: Embrapa, 353.
- Freitas, F.J., et al., 2008. Interrill erosion under shrub and crop systems. Revista Brasileira de Ciencia do Solo, 32, 1743–1751. doi:https://doi.org/10.1590/S0100–06832008000400039
- Fu, S., et al., 2011. The effect of slope on interril erosion at short slopes. Catema, 84, 29–34.
- Julien, P.Y., 2010. Erosion and sedimentation. New York, USA: Cambridge University Press, 280.
- Katz, D.M., Watts, F.J., and Burroughs, E.R., 1995. Effects of surface roughness and rainfall impact on overland flow. Journal of Hydraulic Engineering, 121 (7), 546–553. doi:https://doi.org/10.1061/(ASCE)0733-9429(1995)121:7(546)
- Leite, P.A.M., et al., 2018. The influence of forest regrowth on soil hydraulic properties and erosion in a semiarid region of Brazil. Ecohydrology, 11 (3), e1910. doi:https://doi.org/10.1002/eco.1910
- Littell, R.C., et al., 1996. SAS@ system for mixed models. Cary, NC: SAS Inst. Inc, 31–63.
- Liu, X., et al., 2011. Soil erosion control practices in Northeast China: a mini-review. Soil and Tillage Research, 117, 44–48. doi:https://doi.org/10.1016/j.still.2011.08.005
- Pan, C., et al., 2016. Overland flow resistances on varying slope gradients and partitioning on grassed slopes under simulated rainfall. Water Resources Research, 52 (4), 2490–2512. doi:https://doi.org/10.1002/2015WR018035
- Pieri, L., et al., 2007. Using the Water Erosion Prediction Project (WEPP) model to simulate field observed runoff and erosion in the Apennines mountain range Italy. Journal of Hydrology, 336 (1–2), 84–97. doi:https://doi.org/10.1016/j.jhydrol.2006.12.014
- Qian, F., et al., 2016. Hydraulic characteristics and sediment generation on slope erosion in the three gorges reservoir area, China. Journal of Hydrology and Hydromechanics, 64 (3), 237–245. doi:https://doi.org/10.1515/johh-2016-0029
- Savat, J., 1980. Resistance to flow in rough supercritical sheet flow. Earth Surface Processes, 5 (2), 103–122. doi:https://doi.org/10.1002/esp.3760050202
- Simons, D.B. and Şentürk, F., 1992. Sediment transport technology: water and sediment dynamics. Littleton, Colorado, USA: Water Resources Publication, 897.
- Singh, V.P., 1983. Analytical solutions of kinematic equations for erosion on a plane II. Rainfall of finite duration. Advances in Water Resources, 6, 88–95. doi:https://doi.org/10.1016/0309-1708(83)90045-3
- Tritton, D.J., 2012. Physical fluid dynamics. Oxford, UK: Springer Science & Business Media, 344.
- USDA N, 1998. Keys to soil taxonomy. Washington, DC: USDA.
- Wainwright, J., and Bracken, L.J., 2011. Runoff generation, overland flow and erosion on hillslopes. In: D. S. G. Thomas, ed. Arid Zone Geomorphology. Process, Form and Change in Drylands. Third Edition, West Sussex, UK: John Wiley & Sons, Ltd., 237–267.
- Wilson, C., 2007. Flow resistance models for flexible submerged vegetation. Journal of Hydrology, 342 (3–4), 213–222. doi:https://doi.org/10.1016/j.jhydrol.2007.04.022
- Woolhiser, D.A. and Liggett, J.A., 1967. Unsteady, one‐dimensional flow over a plane—the rising hydrograph. Water Resources Research, 3 (3), 753–771. Third quarter. doi:https://doi.org/10.1029/WR003i003p00753
- Wu, F.C., Shen, H.W., and Chou, Y.J., 1999. Variation of roughness coefficients for unsubmerged and submerged vegetation. Journal of Hydraulic Engineering, 125, 934–942. doi:https://doi.org/10.1061/(ASCE)0733-9429(1999)125:9(934)
- Zhao, C., et al., 2016. Effects of vegetation stems on hydraulics of overland flow under varying water discharges. Land Degradration and Development, 27, 748–757. doi:https://doi.org/10.1002/ldr.2423