?Mathematical formulae have been encoded as MathML and are displayed in this HTML version using MathJax in order to improve their display. Uncheck the box to turn MathJax off. This feature requires Javascript. Click on a formula to zoom.
ABSTRACT
We investigated the potential influence of land-use and climate change on urban hydrology for an urbanized watershed located in Columbia, South Carolina (USA). The Personal Computer Storm Water Management Model (PCSWMM) was used as an urban hydrology model to formulate the low-impact development (LID) controls on runoff for flood mitigation. We used ensemble projections provided by the North American Regional Climate Change Assessment Program (NARCCAP) for the climate change assessment. The results for future periods (2038–2069) show an increase in mean annual runoff from 40% to 70%. The LID mitigation strategies were compared based on the rain barrel, the rain garden, and a combination of the two approaches to evaluate the potential reduction in urban flooding. It is recommended that LID practices should be used synergistically with improved drainage facilities for successful stormwater management. This analysis will help stakeholders to develop strategies to minimize the socio-economic impacts due to urban flooding.
Editor S. Archfield Guest Editor S. Pande
1 Introduction
Due to the rapid population growth, and external factors like technological development and social reforms, urbanization in the USA has increased significantly. Since 1910, there has been a growth of nearly 500% in the urban population, while the rural population has grown by 19% (Hobbs and Stoops Citation2002). The urban population percentage was 75.3% and 82.3% for the years 1990 and 2018, respectively, and it is expected to reach 89.2% in 2050 (UN‐DESA (United Nations Department of Economic and Social Affairs) Citation2018). Urbanization occurs due to the conversion of natural landscapes to developed land for residential, commercial, or industrial purposes (Roy et al. Citation2008, Ahiablame and Shakya Citation2016). Urbanization increases imperviousness cover and, as a result, it decreases infiltration and increases stormwater runoff compared to natural or pervious surfaces (Harbor Citation1994, Seth and Norman Citation2001). Furthermore, the amount of sediment washed into streams exacerbates the impacts on water quality (Hall et al. Citation1999, Ren et al. Citation2003, Tu Citation2011) and causes pollution, thus harming the ecosystem and natural habitat of aquatic animals and plants (Chadwick et al. Citation2006, McKinney Citation2008, Seto et al. Citation2012). Various stormwater management facilities are typically designed based on the historical streamflow data, assuming that the future climate will remain stationary. The future stormwater runoff characteristics (e.g. peak flow) might not exceed the recorded information. However, climate change is likely to impact extreme precipitation characteristics (i.e. intensity, duration, and frequency), including the intensity-duration-frequency (IDF) curves widely used to design civil infrastructure systems (Mishra and Singh Citation2010, Vu and Mishra Citation2019, Konapala et al. Citation2020).
Urbanization and climate change are likely to alter urban hydrological processes (e.g. higher runoff, lower infiltration). Willuweit et al. (Citation2016) applied a Dynamic Urban Water Simulation Model to Dublin city in Ireland to explore the urban runoff pattern under changing urban growth and climate scenarios. They observed that the combined effect of climate and land-use change could potentially increase the monthly runoff by about 57%. Zahmatkesh et al. (Citation2015) used precipitation projections from the Intergovernmental Panel on Climate Change (IPCC) Coupled Model Intercomparison Project (CMIP5) in a New York City watershed. They predicted a substantial increase in future urban runoff volume and peak flow rate. In a study by Waters et al. (Citation2003), climate change contributed to a rise in the total runoff volume by 19% for a small urban catchment in Ontario using global climate model (GCM) simulations. Overall, these studies have shown that the effects of climate change on watersheds may vary. When coupled with urbanization, the two factors can operate synergistically, increasing stormwater runoff magnitude (Pyke et al. Citation2011).
The increase in runoff due to urbanization has been well documented. In a recent study, Akhter and Hewa (Citation2016) predicted a 50% and 320% increase in the mean annual runoff would follow from increasing the urbanization percentage by 10% and 70%, respectively, for Myponga Catchment in South Australia. Ahiablame and Shakya (Citation2016) projected a 63% increase in the runoff between 1992 and 2050 in the City of Normal-Sugar Creek Watershed in Central Illinois. Similarly, Yan and Edwards (Citation2013) studied three watersheds in Arkansas and identified an average increase in flood peak discharge by about 178% between 1993 and 2019. Huong and Pathirana (Citation2013) reported a rise in overall runoff by 21% due to a 55% increase in urban areas. A study conducted by Bhaduri et al. (Citation2001) revealed that for a 10% increase in imperviousness, the annual average runoff increased by 10%.
A variety of concepts have been developed over time to mitigate the increasing amount of urban runoff. For example, low-impact development (LID) focuses on local treatment, retention, re-use, infiltration, and conveyance of excess runoff with the overall goal of preserving the pre-development hydrology of a site (Prince George’s County (Maryland, Department of Environmental Resources Programs and Planning Division) Citation1999). As opposed to conventional stormwater management techniques, LID uses cost-effective and straightforward techniques (e.g. rain gardens and green roofs) that are not limited to protecting the watershed and maintaining its hydrological regime. The implementation of LID structures has proven to offer a more sustainable solution to stormwater management at both site scale and watershed scale (Roy et al. Citation2008, Lee et al. Citation2012, Guan et al. Citation2015). Previous studies have shown promising results for both individual and combined LID controls, such as porous/pervious pavements (Legret and Colandini Citation1999, Ahiablame and Shakya Citation2016), bioretention areas and rain gardens (Dietz and Clausen Citation2005, Davis Citation2008), rain barrels (Abi et al. Citation2010, Jones and Hunt Citation2010), grass swales (Abida and Sabourin Citation2006, Stagge et al. Citation2012), and vegetative roofs (Carter and Rasmussen Citation2006, Carter and Jackson Citation2007), among many others. Many studies have been conducted to examine the performance of LID for improving stormwater management (Trieu et al. Citation2001, Davis Citation2008, Line et al. Citation2012, Steffen et al. Citation2013). Studies by Davis (Citation2008), Line et al. (Citation2012), Chapman and Horner (Citation2010), and Debusk and Wynn (Citation2011) reported reductions in runoff of up to 58%, 49%, 74%, and 97%, respectively, with the use of bioretention areas. The LID techniques impact water flows, but water volume reduction is minimal in extreme events and sensitive to local conditions, such as size and duration of the rainfall event, and soil material and texture (Zhou Citation2014).
The rainfall inputs for model development used in previous studies are derived based on different assumptions for climate change impact assessment. For example, Gill et al. (Citation2007) used projected rainfall inputs from a stochastic weather generator model. They assumed the projected rainfall is based on the 99th percentile of these stochastic model outputs. Pyke et al. (Citation2011) applied the change factor (CF) approach to assume that precipitation is likely to increase/decrease uniformly by 20%. Zahmatkesh et al. (Citation2015) also used the CF approach, to add a CF (Delta) to the observation data (to create a dummy time series) and considered that the projected climate data. These rainfall inputs do not adequately represent future climate change scenarios, as they are simulated from the observed datasets. It is important to highlight that the spatio-temporal rainfall information plays a vital role in climate change impact assessment. It should be appropriately included during the model building process. To overcome such limitations, we used the dynamically downscaled climate data from regional climate models (RCMs) of the North American Regional Climate Change Assessment Program (NARCCAP), which can adequately capture the projected climate change scenarios.
This study provides a comprehensive analysis of the potential impacts of land-use, climate change, and LID practices on urban flooding. Furthermore, the study area was significantly affected by the most severe extreme flooding event during the first week of October 2015. The extreme rainfall event associated with this historical flooding event was considered a 1-in-1000-year event (Feaster et al. Citation2015, Vu and Mishra Citation2019) and is included in the model development. Different land-use and meteorological forcing scenarios obtained from dynamical downscaled GCMs are evaluated in this study. This study’s main objective is to investigate the sensitivity of stormwater runoff based on the historical and projected land-use and climate change scenarios in an urban watershed. This study also aims to evaluate LID practices that are used to mitigate the runoff at a watershed scale. The specific objectives are to (a) develop a well-calibrated stormwater management model for an urban watershed using a rainfall-runoff simulation model (the Personal Computer Storm Water Management Model or PCSWMM); (b) quantify the changes in runoff due to various land-use and climate change scenarios; and (c) evaluate the effectiveness of two primary LID practices (rain garden and rain barrels) in reducing runoff. This study seeks to help water resource managers make informed decisions that aim to minimize stormwater runoff significantly.
The concept of socio-hydrology is an emerging topic (Di Baldassarre et al. Citation2015, Pande and Sivapalan Citation2016), which has gained significant attention in recent decades. This study highlights that urban flood risk mitigation measures can be a useful tool for socio-hydrology. For example, a robust policy can be implemented to control density regulations, zoning, ecosystem zones, and adequate stormwater retention ponds to ensure flood water is adequately controlled.
2 Study area and methodology
2.1 Study area
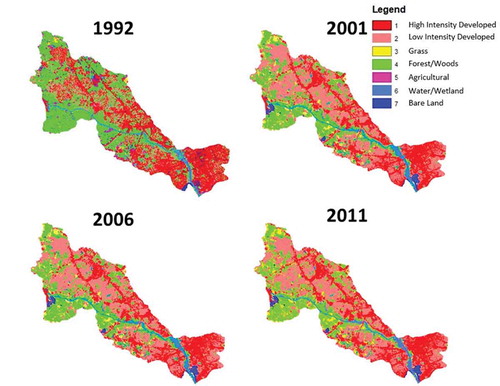
The study area comprises two sub-watersheds located in the state of South Carolina in the United States. These two sub-watersheds are the Upper Congaree River (80%) and the Outlet Saluda River (20%) that cover an area of 138 km2 (). The digital elevation model (DEM) was obtained from light detection and ranging remote sensing (LiDAR) at a resolution of 3 m from the South Carolina Department of Natural Resources (SCDNR). This study area is characterized by a variety of land-cover types, including forests and cultivated land. Most of the study area is developed with large-lot family housing units. The eastern part of the study area consists of the highly developed downtown Columbia region, with a mixture of park, residential, and commercial areas. From 1992 to 2011, there was a 24% increase in urban area (), and a detailed description of the percentage of urban, non-urban, and wetland watershed area is given in . On the contrary, the forest and the agricultural regions decreased by 45% and 97% over the same period. This study area was significantly affected by the flooding during the historical extreme rainfall event during the first week of October 2015. This extreme rainfall event can be considered a 1-in-1000-year event (Feaster et al. Citation2015, Vu and Mishra Citation2019).
Table 1. Land-use classification for the selected watershed
Figure 1. Location of the study area. It comprises two watersheds near the city of Columbia, South Carolina, USA
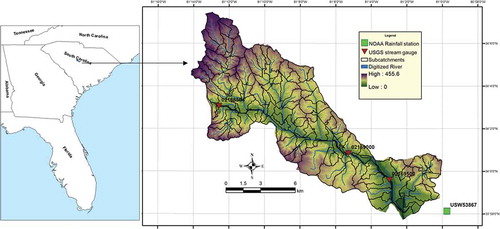
Figure 2. The land-use patterns during 1992, 2001, 2006, and 2011 for the study area
2.2 Hydrometeorological datasets
Daily average streamflow data were obtained from the US Geological Survey (USGS) website for three stations (US02168504, US02169000, and US02169500) located in the study area (). The stations US02168504 and US02169500 were treated as inflow and outflow boundary conditions, respectively, in model development. The data available for station US02169500 were used for model calibration and validation. According to our calculations, the relative contribution of inlet station US02168504 is about 28% of the outlet station US02169500. The streamflow hydrograph’s base flow component was separated using a Web-based Hydrograph Analysis Tool (WHAT) (Lim et al. Citation2005). Precipitation data were obtained from the National Oceanic and Atmospheric Administration (NOAA) and verified using data from the PRISM Climate Group (http://www.prism.oregonstate.edu/). The rain gauge station (ID: USW00053867) is located about 12 km southeast of the basin centroid (). Similar studies by Cantone and Schmidt (Citation2011), Broekhuizen et al. (Citation2019), and Lee et al. (Citation2018) also used one representative rainfall station for the urban region. Average monthly evaporation data were collected from the National Weather Services – Climate Prediction Center. Land-use maps were taken from the National Land Cover Dataset (NLCD) for 1992, 2001, 2006, and 2011. The land use was reclassified () as high intensity (medium intensity land use), low intensity (open space and developed low-intensity land use), grass/pasture (grassland/herbaceous and pasture/hay land uses), forest/woods (deciduous forest and evergreen forest), agricultural (cultivated crops), water/wetland (open water, woody wetlands, and emergent herbaceous wetlands), or barren land (bare rock, bare sand, and bare clay). This was used to calculate each sub-catchment’s percentage imperviousness using NOAA’s Impervious Surface Analysis Tool (ISAT) using an Environmental Systems Research Institute (ESRI) ArcGIS Pro platform. Population data were obtained from the United States Census Bureau in the form of TIGER/Line (Topologically Integrated Geographic Encoding and Referencing) shapefiles.
2.3 Projected land-use maps
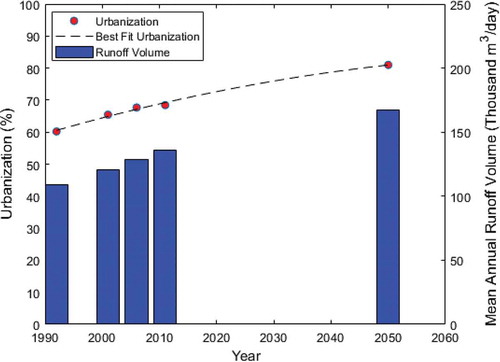
To simulate the climate change impact on local water resources management, we predicted the land-use map for the year 2050 using the best-fit curve approach. We assume that the land-use map projected for the year 2050 can correspond to the future climate change scenarios for 2038–2069. First, the scatter plot between the percentage of urban areas from NLCD 1992, 2001, 2006, and 2011 and a best-fit curve was constructed. It was assumed that urbanization in the year 2050 would follow a similar statistical pattern based on the best-fit curve. The best-fit curve implies an upward trend in urbanization, where the total urban area for 2050 is 80% (as opposed to 68% in 2011), indicating an urban area of 120 km2. Subsequently, a land-use map of the projected year 2050 was constructed based on 2011. The analysis was done using ESRI ArcGIS Pro, and the critical parameters were defined as land-use, slope, and road proximity (Kumar and Shaikh Citation2013). The Grid & Raster Editor tool available in ArcGIS Pro was used to manually change the pixel values from forest or agricultural land to urban landscaping.
2.4 Stormwater runoff modeling: PCSWMM and model sensitivity analysis
The US Environmental Protection Agency (US EPA) Storm Water Management Model (SWMM) is a computer program that simulates dynamic rainfall-runoff for a single event and long-term (continuous or period-of-record) runoff quantity and quality (James et al. Citation2005). PCSWMM is a proprietary stormwater modeling software programme that integrates the SWMM computational engine with a geographic information system (GIS). For the model development, PCSWMM version 7.1.2480 from Computational Hydraulics International company (CHI) was used. Using DEM from SCDNR, the PCSWMM’s Watershed Delineation Tool (WDT) was run to delineate sub-catchments (). The WDT tool works similarly to other watershed delineation tools, except it uses the concept of target sub-catchment size rather than a minimum area for channelization. Based on the flow direction, slope and contributing area layers were generated for each sub-catchment. Lastly, the streams and flowpath layers are created, which show the stream networks and their direction. The streams and flowpath layers are used to develop the Conduits layer, which is a key element to represent channels that move water from one node to another in the conveyance system in PCSWMM. To represent the Conduits layer’s irregular cross-section, a Transect object is used to define how depth varies with the distance across the cross-section. Transects are created using Transect Creator and Transect Editor tools, which use the elevation data from the provided DEM layer. Other input parameters used in the Conduits layer are Manning’s roughness, inlet and outlet node inverts, and length.
The watershed was divided into 106 sub-catchments, 7473 nodes, and 7950 links () to adequately represent the land uses, topography, and drainage pattern of the watershed. The stormwater management infrastructure (pipes, gutters, swales, catch basins, etc.) was not considered in this model. It was assumed that these structures’ stormwater would eventually drain to the natural flowpaths (Abdul-Aziz and Al-Amin Citation2016). The model-simulated surface runoff at each sub-catchment, node, and link was calculated. The SWMM model has long been used in various urban hydrology prediction and management applications (Tsihrintzis and Hamid Citation1998, Jang et al. Citation2007, Li et al. Citation2010b).
In this study, a sensitivity analysis was performed to determine the model-sensitive parameters after assigning user-defined uncertainty values (or ranks) for each parameter (see the Appendix, ). The range of uncertainty values was derived from the “Rules for responsible modeling” (James Citation2003). The available data record is 16 years (1 January 2000 to 31 December 2015) on a daily scale. The model was calibrated using the Sensitivity-based Radio Tuning Calibration (SRTC) tool for 10 years (1 January 2006 to 31 December 2015) and validated for 6 years (1 January 2000 to 31 December 2005). The daily rainfall data from NOAA and land-use data from NLCD 2011 were used for model calibration and validation. The average daily runoff obtained from the model was compared to runoff values of daily flow from USGS station 02169000. The model performance was evaluated using the Nash-Sutcliffe efficiency (NSE) coefficient, Root Mean Square Error (RMSE) and coefficient of determination (R2) values for both daily and monthly scales.
2.5 SWMM LID modeling
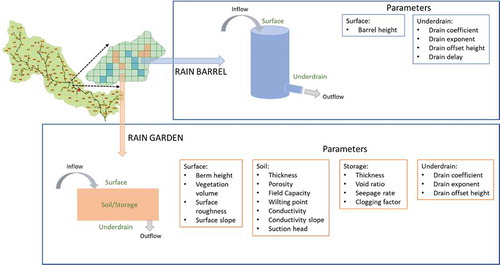
In SWMM, a combination of vertical layers is used to represent LID controls. Each layer’s properties are defined on a per-unit-area basis, allowing them to be implemented in multiple sub-catchments of different sizes. Evaporation, infiltration, runoff, and water storage through each layer are tracked by performing a moisture balance. In this study, two LID elements (rain garden and rain barrel) were used. In PCSWMM, a rain garden is represented using a combination of surface, soil, storage, and drain parameters (see the Appendix, , ). A rain barrel is represented using only storage and drain parameters (see the Appendix, , ). The surface overflow of the LID components was directed back to the sub-catchment, and flow from the underdrain was directed into the outlet of the sub-catchment. It was also assumed that there are no clogging issues and no underdrain. The number of rain garden units was determined according to the sub-catchment impervious cover. For a rain barrel case, each one was assumed to have a capacity of 350 L and to be 1.2 m tall and 1.5 cm in diameter (Ahiablame and Shakya Citation2016). It was set up to receive 50% of runoff from the roof, and draining time was assigned as 6 h (see the Appendix, ). The number of rain barrels was calculated using the population data and by assuming a homogeneous population density.
2.6 Climate projections from NARCCAP
This study assesses the impact of climate change on local water resource allocation using the ensemble output from the RCMs of NARCCAP (Mearns et al. Citation2012). Phase II of NARCCAP utilized the boundary conditions from four atmosphere-ocean global climate models (AOGCMs) and six RCMs. The simulations were run for baseline climate 1968–1999 and the climate projection 2038–2069 was forced using the Special Report on Emissions Scenarios (SRES) A2 scenario. According to the Fourth Assessment Report (AR4) of IPCC (Citation2007), the SRES A2 scenario is referred to a very heterogeneous world of continuously increasing population and regionally oriented economic development with slow economic growth and technological change to preserve local identities. A total of 12 pairs of AOGCMs and RCMs are formed in NARCCAP, followed by a balanced statistical design. Similar to Kim et al. (Citation2017), this study selects a subset of five pairs of AOGCMs-RCMs that can provide the best ensemble study for climate change impact over South Carolina. The abbreviations for the selected GCMs/RCMs and the five chosen pairs for NARCCAP models are presented in .
Table 2. North American Regional Climate Change Assessment Program (NARCCAP models used for the study
The NARCCAP model outputs provide 3-hourly interval precipitation data over a spatial resolution of 50 km for the North American region. Even though dynamical downscaling data produces a finer resolution compared to driving GCMs, there still exists model bias for each RCM. To remove these precipitation biases from the RCMs, the non-parametric quantile mapping approach (or distribution mapping) was used. According to Teutschbein and Seibert (Citation2012), the quantile mapping approach is the best bias-correction method for both precipitation and temperature variables. This approach has been used in various RCM bias-correction studies. The formulation for the quantile mapping approach is shown in EquationEquation (1)(1)
(1) for a given precipitation time series “x” for a particular month:
in which is the bias-corrected precipitation; F is the fitting function (in this case, gamma distribution); F−1 is the inverse of the fitting function; “o” and “m” stand for “observed” and “modeled”; and “c” is the “current” climate. EquationEquation (1)
(1)
(1) was used to correct the bias between the observations and the climate model at the baseline period. For climate projection, the equidistance quantile mapping approach is applied as shown in EquationEquation (2)
(2)
(2) with the information from observations and the climate model at baseline and in the future period (Li et al. Citation2010a, Vu et al. Citation2017a, Srivastav et al. Citation2014, Mirhosseini et al. Citation2013):
In which “p” stands for “projected.”
2.7 Scenario analysis
Different scenarios were investigated to evaluate the potential impact of the projected climate and land-cover change using the calibrated hydrological model PCSWMM. Scenario 1 has four cases (U1–U4), where the urbanization with the change in urban coverage of the land-cover map varies from 10% to 70% (). Using NLCD land cover for the years 1992, 2001, 2006, 2011, and 2050 (scenario 2), cases LU1 to LU5 were created to evaluate the actual change in the past. The effectiveness of LID practices for reducing runoff was evaluated using scenario 3 for the land-use 2011 (cases L1–L3). Furthermore, cases C1 to C5 of scenario 4 were used to study the climate change impacts from different rainfall projections without the incorporation of LID structures into the model. For all scenarios, we assume that the contribution of inflow station US02168504 is stationary.
Table 3. Different scenarios used in this study
3 Results
3.1 PCSWMM: model calibration and validation
The sensitivity analysis was conducted using the SRTC tool. It was observed that the sub-catchment width, slope, percentage of imperviousness, and curve number were the most sensitive parameters. Our result is consistent with the findings of Ahiablame and Shakya (Citation2016), Akhter and Hewa (Citation2016), and Abdul-Aziz and Al-Amin (Citation2016). The NSE goodness-of-fit index (Nash and Sutcliffe Citation1970) and coefficient of determination (R2) were used to evaluate the performance of the PCSWMM hydrological model using daily streamflow at the downstream station, US02169500. The coefficient of determination R2 is defined as the squared value of the correlation coefficient. The NSE is considered to be the most appropriate relative error or goodness-of-fit measure available, owing to its straightforward physical interpretation (Legates and McCabe Jr Citation1999). The NSE and R2 values for calibration period (2006–2015) are 0.79 and 0.81, respectively, and for the validation period (2000–2005) they are 0.76 and 0.80, respectively ()). NSE and R2 values in the vicinity of 0.8 are considered a good fit indicator for model performance on a daily scale (Vu et al. Citation2017b).
Figure 3. (a) Comparing the simulated and observed flow during the calibration and validation at a daily time scale. (b) Simulation of extreme flood event during the first week of October 2015
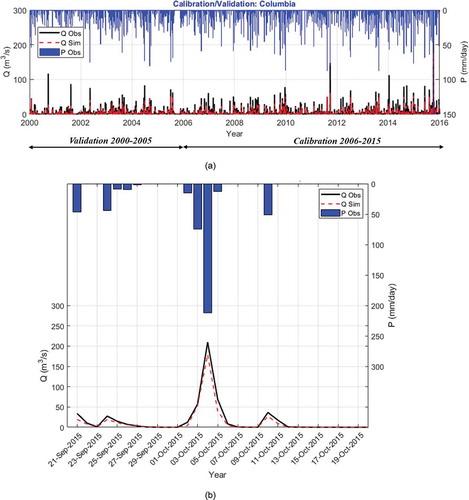
We compared additional goodness-of-fit indices such as NSE for Q0.2 and RMSE for the logarithm of streamflow (Nicolle et al. Citation2014, Vu et al. Citation2017b) between the simulated and observed runoff. The NSE results for Q0.2 for calibration and validation are 0.96 and 0.94, while the RMSE on ln(Q) are 0.52 and 0.53, respectively. This additional goodness of fit on low flow suggests the study region’s PCSWMM model’s better performance during the dry season. The calibrated PCSWMM model still underestimated the high flow for a specific year, in 2012 and 2014 ()). The model also underestimated the peak flow for 2001, 2002, and 2004. Erickson et al. (Citation2010) explained that this underestimation of runoff volume in the SWMM model could be associated with the “off the top” approach, which suggests that evaporation is subtracted during a rainfall event before infiltration and runoff are estimated (James et al. Citation2005). This may lead to the underestimation of runoff (Schomberg et al. Citation2000). Similar findings are observed in previous studies by Pinos and Timbe (Citation2019), Broekhuizen et al. (Citation2019), and Larabi et al. (Citation2018). In this study, the calibrated PCSWMM model matched well with the historical flooding event in 2015 ()). Both NSE and R2 for the simulation of the thousand-year return period flooding event in 2015 are above 0.98 compared to observed data. This is similar to other event-based simulations, as in Borah et al. (Citation2007), Mejia and Moglen (Citation2010), and Hossain et al. (Citation2019).
3.2 Impact of urbanization and land-use change on runoff
Two land-use scenarios are evaluated in this study. In the first scenario, four cases (U1–U4) are investigated by increasing the urbanization area by 10% to 70% with respect to the baseline land cover (NLCD year 2011). In the second scenario, four actual land-use cases (LU1–LU4) based on the NLCD for the years 1992, 2001, 2006, and 2011 are considered, and in addition to that, the projected land-use (LU5) for the year 2050 is also included ().
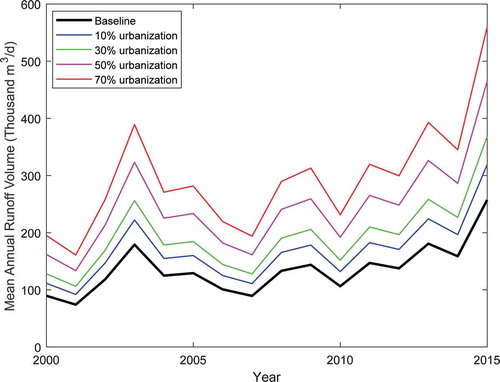
The calibrated model PCSWMM was simulated for the whole study period of 2000–2015 using four land-cover cases (Scenario 1, ) by increasing urbanization from the baseline period (NLCD 2011). Due to the transition from the pervious to the impervious surface, the infiltration and groundwater flow is reduced; hence, more runoff is expected to occur. Compared to baseline (using NLCD 2011), all urbanization cases show an increasing trend in the mean annual runoff. The mean annual runoff simulated based on the four (U1–U4) cases () indicated a steady increase when increasing the impervious area. The increase in impervious cover has a significant impact on the extreme event; in particular, the peak flow during the 2015 historical flood indicates that by increasing (relative to a base period of 2011) the impervious surface by 10%, 30%, 50%, and 70%, the corresponding annual flow is likely to increase by 25%, 45%, 80%, and 120%, respectively.
Figure 4. Annual flow for different urbanization scenarios (U1–U4) compared to the baseline scenario
Different land-use maps (LU1–LU5) obtained from NLCD for four different years (1992, 2001, 2006, 2011) and the projected map for 2050 were used as input to the calibrated PCSWMM model to simulate flow during the study period 2000–2015. The average annual runoff was computed for LU1 to LU5 based on the percentage of urban areas for each NLCD year. The percentage of urban areas for the year 2050 was extrapolated using the exponential fitting curve based on the four NLCD survey years (). As the percentage of the urban area (%) increases, the simulated mean annual runoff volume also increases, to the magnitude of 108 000, 120 000, 128 000, 135 000, and 167 000 m3/day corresponding to the year 1992, 2001, 2006, 2011, 2050, respectively (). In comparison with the land-use map in 1992, the projected land-use in 2050 has an increased mean annual runoff volume of 54%. In a nutshell, urbanization leads to an increase in the impervious area, reducing groundwater flow and increasing surface runoff.
Figure 5. Average annual runoff volume for different land-use change scenarios (LU1–LU5)
3.3 Impact of LID on runoff
Two commonly used LID practices (rain gardens and rain barrels) are evaluated to minimize excessive runoff under extreme weather conditions. The rain barrel (case L1) collects water from shingle roofs into buckets, whereas the rain garden (case L2) temporarily stores excess water in underground storage. A combination of both rain garden and rain barrel (case L3) is investigated, although this seems to be a more expensive selection. The calibrated PCSWMM model was used to investigate the three LID cases (L1, L2, and L3) based on the NLCD 2011 for the study period 2000–2015 () in comparison with the scenario with no LID application. In this study, the simulation was based on daily runoff, showing the effect of LID controls on the volumes of the flood events but not on the peak flows.
Figure 6. Total annual runoff for different Low Impact Development (LID) cases
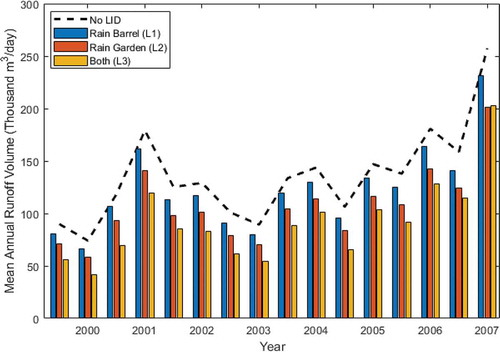
Overall, by incorporating the LID practices, the mean annual runoff volume was reduced for all simulated years; however, the performance of LIDs varies widely. Compared to without LIDs, the rain barrel approach (L1) reduced the total annual runoff by about 10%. The rain garden approach (L2) can further capture the roof’s rainfall in its underground storage, thus reducing the total annual runoff to 21%. The combined system (case L3) can hold the excess runoff to its maximum capacity of 32%. In any LID scenario, it is observed that during small rainfall conditions, its storage layer is sufficient to store the runoff, generating a lesser amount of runoff. However, during increased rainfall conditions, the LID elements’ storage capacity is insufficient, thus causing the increased runoff values. Although this runoff is still less than the runoff observed in the baseline scenario, the percentage of runoff volume reduction is not significant due to the LID elements’ size limitation.
3.4 Impact of climate change on runoff
The previous sections discussed the relationship between urbanization, land-cover changes, stormwater control using LID practices, and surface runoff. This section analyses the potential influence of climate change scenarios and land-cover projection on urban runoff compared to the baseline climate. In scenario 4, five cases (C1–C5) are evaluated based on the GCM rainfall downscaled from the five selected NARCCAP models, as tabulated in . The baseline climate data is bias-corrected with observed data using the non-parametric quantile mapping approach. The projected climate data is bias-corrected using the equidistance quantile mapping approach. The bias-corrected precipitation is then used as input to the calibrated PCSWMM model for (1) baseline climate 1968–1999 using the land-cover map from NLCD 1992 and (2) projected climate 2038–2069 using the land cover map from NLCD 2050. The daily runoff output from the PCSWMM model is used for further evaluation.
In this study, the mean annual runoff volumes computed for the baseline and projected scenarios are evaluated (). The results displayed in clearly show the uncertainty among NARRCAP models. For instance, using the same GCM, CGCM3, the RCM3 indicated a slightly higher mean annual runoff, compared with CRCM, captured at the Columbia station. The anomaly in the projected runoff for CGCM3-RCM3 with respect to baseline is about 65%, compared to 55% for CGCM3-CRCM.
Figure 7. Total annual runoff for baseline and climate projection
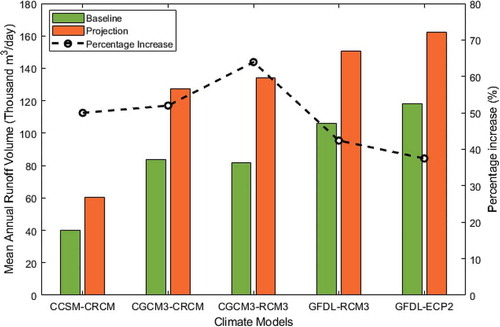
also demonstrates the climate sensitivity among different GCMs. For example, the Canadian GCM CGCM3 produces more rainfall than the American GCM CCSM, which was downscaled using the same CRCM. The GFDL is wetter than CGCM3 (downscaled by the same RCM3). However, the climate sensitivity uncertainty is different in the anomaly calculation. The anomaly is significantly higher in CGCM3-RCM3 (65%) compared to GFDL-RCM3 (40%), but it is the same for other CCSM-CRCM and CGCM3-CRCM (both at 55%). Overall, there has been a significant increase in runoff volume based on the projected climate and land-use scenarios compared to the baseline runoff. The percentage change ranges from 40% to 70% in mean annual runoff at the selected streamgauge station. It is noted that the projected land-use in 2050 can potentially increase the mean annual runoff volume of up to 54% compared to the land-use map in 1992.
4 Conclusions
This study utilizes the urban hydrological model PCSWMM in simulating the surface runoff for the Upper Congaree River and Outlet Saluda River near Columbia, South Carolina. The city witnessed a thousand-year-event rainfall in October 2015, resulting in $2 billion of loss and damages. Due to the rapid urbanization and the reduced hydrological time of concentration, the time to peak and the magnitude of surface runoff increased, leading to difficulty in draining the massive volume of stormwater in a short amount of time. The PCSWMM is used to simulate the potential influence of climate change, land uses, and LID practices on urban flooding. Various scenarios are evaluated to demonstrate the ability of LIDs to mitigate urban runoff due to the rapid increase in urbanization and climate change. The following observations were made in this study:
Urbanization leads to an increasingly impervious surface, which resulted in reduced infiltration and groundwater flow and higher surface runoff. Mainly, during a thousand-year-return-period storm event (i.e. the one that occurred in the first week of October 2015), the existing infrastructure could not withstand the most severe flooding. If the impervious cover increased by 10%, 30%, 50%, or 70%, the annual flow might increase by approximately 25%, 45%, 80%, or 120%, respectively, compared to the baseline land cover NLCD 2011.
Flood mitigation level using LID practices is evaluated based on three approaches: rain barrel, rain garden, and a combination of the two. For this particular catchment area, LID plays a significant role in mitigating the water runoff, with an average reduction of 10%, 21%, and 32%, respectively, for the three approaches. Rain gardens proved to be more effective than rain barrels to reduce runoff, while the combination of the two LIDs performed best. Cost-effectiveness plays a pivotal role when choosing LID practices.
In comparison with baseline climate (using baseline land cover), it is expected that the percentages of mean annual runoff volume will increase by 40–70% based on the projected land-use (2050) and climate change scenarios (2038–2069).
In addition to installing LID components, the improvement of existing storm drainage infrastructures also needs to be prioritized. When integrated with improved traditional drainage forms, LIDs can successfully manage stormwater runoff under the future urbanization and climate change scenario. This study can be further extended to evaluate other LID controls like porous pavements, vegetative swales, etc. Potential future work can focus on developing a robust downscaling procedure for urban hydrology-related applications by adequately addressing uncertainties associated with global climate models and sparse data and capturing the extreme rainfall events and sub-daily rainfall for urban flooding applications. This extreme rainfall information can help to improve instantaneous peak flow from daily flow data to assess the LID effects not only on runoff volumes but also on instantaneous peak flow.
Disclosure statement
No potential conflict of interest was reported by the authors.
Additional information
Funding
References
- Abdul-Aziz, O.I. and Al-Amin, S., 2016. Climate, land use and hydrologic sensitivities of stormwater quantity and quality in a complex coastal-urban watershed. Urban Water Journal, 13 (3), 302–320. doi:https://doi.org/10.1080/1573062X.2014.991328.
- Abi, M.P., Suidan, M.T., and Shuster, W.D., 2010. Modeling techniques of best management practices: rain barrels and rain gardens using EPA SWMM-5. Journal of Hydrologic Engineering, 15 (6), 434–443. doi:https://doi.org/10.1061/(ASCE)HE.1943-5584.0000136.
- Abida, H. and Sabourin, J.F., 2006. Grass swale-perforated pipe systems for stormwater management. Journal of Irrigation and Drainage Engineering, 132 (1), 55–63. doi:https://doi.org/10.1061/(ASCE)0733-9437(2006)132:1(55).
- Ahiablame, L. and Shakya, R., 2016. Modeling flood reduction effects of low impact development at a watershed scale. Journal of Environmental Management, 171, 81–91. doi:https://doi.org/10.1016/j.jenvman.2016.01.036
- Akhter, M.S. and Hewa, G.A., 2016. The use of PCSWMM for assessing the impacts of land use changes on hydrological responses and performance of WSUD in managing the Impacts at Myponga Catchment, South Australia. Water, 8 (11), 1–17. doi:https://doi.org/10.3390/w8110511.
- Bhaduri, B., et al., 2001. Long-term hydrologic impact of urbanization: a tale of two models. Journal of Water Resources Planning and Management, 127 (1), 13–19. doi:https://doi.org/10.1061/(ASCE)0733-9496(2001)127:1(13).
- Borah, D.K., et al., 2007. Storm event and continuous hydrologic modeling for comprehensive and efficient watershed simulations. . Journal of Hydrologic Engineering, 12 (6), 605–616. doi:https://doi.org/10.1061/(ASCE)1084-0699(2007)12:6(605).
- Broekhuizen, I., et al., 2019. Urban drainage models for green areas: structural differences and their effects on simulated runoff. Journal of Hydrology X, 5, 1–13. doi:https://doi.org/10.1016/j.hydroa.2019.100044
- Cantone, J. and Schmidt, A., 2011. Improved understanding and prediction of the hydrologic response of highly urbanized catchments through development of the Illinois urban hydrologic model. Water Resources Research, 47 (8), 8. doi:https://doi.org/10.1029/2010WR009330.
- Carter, T.L. and Jackson, C.R., 2007. Vegetated roofs for stormwater management at multiple spatial scales. Landscape and Urban Planning, 80 (1–2), 84–94. doi:https://doi.org/10.1016/j.landurbplan.2006.06.005.
- Carter, T.L. and Rasmussen, T.C., 2006. Hydrologic behavior of vegetated roofs. Journal of the American Water Resources Association, 42 (5), 1261–1274. doi:https://doi.org/10.1111/j.1752-1688.2006.tb05611.x.
- Chadwick, M.A., et al., 2006. Urbanization affects stream ecosystem function by altering hydrology, chemistry, and biotic richness. Ecological Applications, 16 (5), 1796–1807. doi:https://doi.org/10.1890/1051-0761(2006)016[1796:UASEFB]2.0.CO;2.
- Chapman, C. and Horner, R.R., 2010. Performance assessment of a street-drainage bioretention system. Water Environment Research, 82 (2), 109–119. doi:https://doi.org/10.2175/106143009X426112.
- Davis, A.P., 2008. Field performance of bioretention: hydrology impacts. Journal of Hydrologic Engineering, 13 (2), 90–95. doi:https://doi.org/10.1061/(ASCE)1084-0699(2008)13:2(90).
- Debusk, K.M. and Wynn, T.M., 2011. Storm-water bioretention for runoff quality and quantity mitigation. Journal of Environmental Engineering, 137 (9), 9. doi:https://doi.org/10.1061/(ASCE)EE.1943-7870.0000388.
- Di Baldassarre, G., et al., 2015. Debates—perspectives on socio-hydrology: capturing feedbacks between physical and social processes. Water Resource Research, 51, 4770–4781. doi:https://doi.org/10.1002/2014WR016416
- Dietz, M.E. and Clausen, J.C., 2005. A field evaluation of rain garden flow and pollutant treatment. Water, Air, and Soil Pollution, 167 (1–4), 123–138. doi:https://doi.org/10.1007/s11270-005-8266-8.
- Erickson, T.O., Herb, W.R., Stefan, H.G., 2010. Streamflow modeling of miller creek, Duluth, Minnesota. Project Report No. 536. St. Anthony Falls Laboratory.
- Feaster, T.D., Shelton, J.M., and Robbins, J.C. 2015. Preliminary peak stage and streamflow data at selected USGS streamgaging stations for the South Carolina flood of October 2015 (ver. 1.1, November 2015): U.S. Geological Survey Open-File Report 2015–1201, 19. doi:https://doi.org/10.3133/ofr20151201.
- Gill, S.E., et al., 2007. Adapting cities for climate change: the role of the green infrastructure. Built Environment, 33 (1), 115–133. doi:https://doi.org/10.2148/benv.33.1.115.
- Guan, M., Sillanpää, N., and Koivusalo, H., 2015. Assessment of LID practices for restoring pre-development runoff regime in an urbanized catchment in southern Finland. Water Science and Technology, 71 (10), 1485–1491. doi:https://doi.org/10.2166/wst.2015.129.
- Hall, R.I., et al., 1999. Effects of agriculture, urbanization, and climate on water quality in the northern great plains. Limnology and Oceanography, 44 (3part2), 739–756. doi:https://doi.org/10.4319/lo.1999.44.3_part_2.0739.
- Harbor, J.M., 1994. A practical method for estimating the impact of land-use change on surface runoff, groundwater recharge and wetland hydrology. Journal of the American Planning Association, 60 (1), 95–108. doi:https://doi.org/10.1080/01944369408975555.
- Hobbs, F. and Stoops, N., 2002. U.S. Census Bureau, census 2000 special reports, series CENSR-4, demographic trends in the 20th century. Washington, DC: U.S. Government Printing Office. Available from: https://www.census.gov/prod/2002pubs/censr-4.pdf [ Last accessed Jun 2019].
- Hossain, S., Hewa, G.A., and Hewage, S.W., 2019. A comparison of continuous and event-based rainfall–runoff (RR) modelling using EPA-SWMM. Water, 11 (3), 611. doi:https://doi.org/10.3390/w11030611.
- Huong, H.T.L. and Pathirana, A., 2013. Urbanization and climate change impacts on future urban flooding in Can Tho city, Vietnam. Hydrology and Earth System Sciences, 17 (1), 379–394. doi:https://doi.org/10.5194/hess-17-379-2013.
- IPCC, 2007. Climate change 2007: the physical science basis. In: S. Solomon, et al., eds. Contribution of working group I to the fourth assessment report of the intergovernmental panel on climate change. Cambridge: Cambridge University Press, 996.
- James, W., 2003. Rules for responsible modeling. Guelph, Ontario: CHI.
- James, W., Rossman, L.E., and James, R.W.C., 2005. User’s guide to SWMM5. Water Systems Models. 13th edn. CHI Press Publication. Available from: https://www.chiwater.com/Files/UsersGuideToSWMM5Edn13.pdf. [ Last accessed Jun 2018].
- Jang, S., et al., 2007. Using SWMM as a tool for hydrologic impact assessment. Desalination, 212 (1–3), 344–356. doi:https://doi.org/10.1016/j.desal.2007.05.005.
- Jones, M.P. and Hunt, W.F., 2010. Performance of rainwater harvesting systems in the southeastern United States. Resources, Conservation and Recycling, 54 (10), 623–629. doi:https://doi.org/10.1016/j.resconrec.2009.11.002.
- Kim, Y., Band, L.E., and Ficklin, D.L., 2017. Projected hydrological changes in the North Carolina piedmont using bias-corrected North American Regional climate change assessment program (NARCCAP) data. Journal of Hydrology: Regional Studies, 12, 273–288. doi:https://doi.org/10.1016/j.ejrh.2017.06.005
- Konapala, G., et al., 2020. Climate change will affect global water availability through compounding changes in seasonal precipitation and evaporation. Nature Communications, 11 (1), 3044. doi:https://doi.org/10.1038/s41467-020-16757-w.
- Kumar, M. and Shaikh, V.R., 2013. Site suitability analysis for urban development using GIS based multicriteria evaluation technique. Journal of the Indian Society of Remote Sensing, 41 (2), 417–424. doi:https://doi.org/10.1007/s12524-012-0221-8.
- Larabi, S., St-Hilaire, A. and Chebana, F., 2018. A new concept to calibrate and evaluate a hydrological model based on functional data analysis. Journal of Water Management Modeling, 26, C442, 1–7. doi:https://doi.org/10.14796/JWMM.C442.
- Lee, J.G., et al., 2012. A watershed-scale design optimization model for stormwater best management practices. . Environmental Modelling & Software, 37, 6–18. doi:https://doi.org/10.1016/j.envsoft.2012.04.011
- Lee, J.G., Nietch, C.T., and Panguluri, S., 2018. Drainage area characterization for evaluating green infrastructure using the storm water management model. Hydrology and Earth System Sciences, 22 (5), 2615–2635. doi:https://doi.org/10.5194/hess-22-2615-2018.
- Legates, D.R. and McCabe Jr, G.J., 1999. Evaluating the use of “goodness-of-fit” Measures in hydrologic and hydroclimatic model validation. Water Resources Research, 35 (1), 233–241. doi:https://doi.org/10.1029/1998WR900018.
- Legret, M. and Colandini, V., 1999. Effects of a porous pavement with reservoir structure on runoff water: water quality and fate of heavy metals. Water Science and Technology, 171 (2), 111–117. doi:https://doi.org/10.2166/wst.1999.0098.
- Li, H., Sheffield, J., and Wood, E.F., 2010a. Bias correction of monthly precipitation and temperature fields from intergovernmental panel on climate change AR4 models using equidistant quantile matching. Journal of Geophysical Research, 115 (D10101), 1–20.
- Li, Y.W., et al., 2010b. Optimization of rainwater drainage system based on SWMM model. China Water & Wastewater, 26 (23), 40–43.
- Lim, K.J., et al., 2005. Automated web GIS based hydrograph analysis tool, WHAT. Journal of the American Water Resources Association, 12 (6), 1407–1416. doi:https://doi.org/10.1111/j.1752-1688.2005.tb03808.x.
- Line, D.E., et al., 2012. Effectiveness of LID for commercial development in North Carolina. Journal of Environmental Engineering, 42 (5), 680–688. doi:https://doi.org/10.1061/(ASCE)EE.1943-7870.0000515.
- McKinney, M.L., 2008. Effects of urbanization on species richness: a review of plants and animals. Urban Ecosystems, 11 (2), 161–176. doi:https://doi.org/10.1007/s11252-007-0045-4.
- Mearns, L.O., et al., 2012. The North American regional climate change assessment program: overview of phase I results. Bulletin of the American Meteorological Society, 93 (9), 1337–1362. doi:https://doi.org/10.1175/BAMS-D-11-00223.1.
- Mejia, A.I. and Moglen, G.E., 2010. Impact of the spatial distribution of imperviousness on the hydrologic response of an urbanizing basin. Hydrological Processes, 24 (23), 3359–3373. doi:https://doi.org/10.1002/hyp.7755.
- Mirhosseini, G., Srivastava, P., and Stefanova, L., 2013. The impact of climate change on rainfall intensity–duration–frequency (IDF) curves in Alabama. Regional Environmental Change, 13 (S1), 25–33. doi:https://doi.org/10.1007/s10113-012-0375-5.
- Mishra, A.K. and Singh, V.P., 2010. Changes in extreme precipitation in Texas. Journal of Geophysical Research, 115 (D14), D14106. doi:https://doi.org/10.1029/2009JD013398.
- Nash, J.E. and Sutcliffe, J.V., 1970. River flow forecasting through conceptual models part I — a discussion of principles. . Journal of Hydrology, 60 (1), 282–290. doi:https://doi.org/10.1016/0022-1694(70)90255-6.
- Nicolle, P., et al., 2014. Benchmarking hydrological models for low-flow simulation and forecasting on French catchments. Hydrology and Earth System Sciences, 18 (8), 2829–28570. doi:https://doi.org/10.5194/hess-18-2829-2014.
- Pande, S. and Sivapalan, M., 2016. Progress in socio-hydrology: a meta-analysis of challenges and opportunities. Wiley interdisciplinary reviews. Water, 4, e1193.
- Pinos, J. and Timbe, L., 2019. Performance assessment of two-dimensional hydraulic models for generation of flood inundation maps in mountain river basins. Water Science and Engineering, 12 (1), 11–18. doi:https://doi.org/10.1016/j.wse.2019.03.001.
- Prince George’s County (Maryland, Department of Environmental Resources Programs and Planning Division), 1999. Low-impact development design strategies—an integrated design approach. Largo, Maryland: Maryland Department of Environmental Resource, Program and Planning Division.
- Pyke, C., et al., 2011. Assessment of low impact development for managing stormwater with changing precipitation due to climate change. Landscape and Urban Planning, 103 (2), 166–173. doi:https://doi.org/10.1016/j.landurbplan.2011.07.006.
- Ren, W., et al., 2003. Urbanization, land use, and water quality in Shanghai. Environment International, 29 (5), 649–659. doi:https://doi.org/10.1016/S0160-4120(03)00051-5.
- Roy, A.H., et al., 2008. Impediments and solutions to sustainable, watershed-scale urban stormwater management: lessons from Australia and the United States. Environmental Management, 42 (2), 344–359.
- Schomberg, J., Richards, C. and G. Host, 2000. Miller Creek stormwater modeling. Natural Resources Research Institute: Technical Report # NRRI/TR-2000/06, 85 pp.
- Seth, R. and Norman, E.P., 2001. Effects of urbanization on streamflow in the Atlanta area (Georgia, USA): a comparative hydrological approach. Hydrological Processes, 15 (8), 1441–1457. doi:https://doi.org/10.1002/hyp.218
- Seto, K.C., Güneralp, B., and Hutyra, L.R., 2012. Global forecasts of urban expansion to 2030 and direct impacts on biodiversity and carbon pools. Proceedings of the National Academy of Sciences, 109 (40), 16083–16088. doi:https://doi.org/10.1073/pnas.1211658109.
- Srivastav, R.K., Schardong, A., and Simonovic, S.P., 2014. Equidistance quantile matching method for updating IDF curves under climate change. Water Resources Management, 28 (9), 2539–2562. doi:https://doi.org/10.1007/s11269-014-0626-y.
- Stagge, J.H., et al., 2012. Performance of grass swales for improving water quality from highway runoff. Water Research, 17 (1), 6731–6742. doi:https://doi.org/10.1016/j.watres.2012.02.037.
- Steffen, J., et al., 2013. Water supply and stormwater management benefits of residential rainwater harvesting in U.S. cities. JAWRA Journal of the American Water Resources Association, 49 (4), 810–824. doi:https://doi.org/10.1111/jawr.12038.
- Teutschbein, C. and Seibert, J., 2012. Bias correction of regional climate model simulations for hydrological climate-change impact studies: review and evaluation of different methods. Journal of Hydrology, 456-457, 12–29. doi:https://doi.org/10.1016/j.jhydrol.2012.05.052
- Trieu, P., et al., 2001. Combined sewer overflow rooftop type analysis and rain barrel demonstration project. Washington, DC: CSO Control Program District of Columbia Water and Sewer Authority, 85.
- Tsihrintzis, V.A. and Hamid, R., 1998. Runoff quality prediction from small urban catchments using SWMM. Hydrological Processes, 12 (2), 311–329. doi:https://doi.org/10.1002/(SICI)1099-1085(199802)12:2<311::AID-HYP579>3.0.CO;2-R.
- Tu, J., 2011. Spatially varying relationships between land use and water quality across an urbanization gradient explored by geographically weighted regression. Applied Geography, 31 (1), 376–392. doi:https://doi.org/10.1016/j.apgeog.2010.08.001.
- UN‐DESA (United Nations Department of Economic and Social Affairs), 2018. World urbanization prospects, the 2018 revision. New York, NY: United Nations.
- Vu, M.T., et al., 2017b. Hydro-meteorological drought assessment under climate change impact over the Vu Gia–Thu Bon river basin, Vietnam. Hydrological Sciences Journal, 62 (10), 10. doi:https://doi.org/10.1080/02626667.2017.1346374.
- Vu, M.T., Raghavan, V.S., and Liong, S.-Y., 2017a. Deriving short-duration rainfall IDF curves from a regional climate model. Natural Hazards, 85 (3), 1877–1891. doi:https://doi.org/10.1007/s11069-016-2670-9.
- Vu, T.M. and Mishra, A.K., 2019. Nonstationary frequency analysis of the recent extreme precipitation events in the United States. Journal of Hydrology, 575, 999–1010. doi:https://doi.org/10.1016/j.jhydrol.2019.05.090
- Waters, D., et al., 2003. Adaptation of a storm drainage system to accommodate increased rainfall resulting from climate change. Journal of Environmental Planning and Management, 46 (5), 755–770. doi:https://doi.org/10.1080/0964056032000138472.
- Willuweit, L., O’Sullivan, J.J., and Shahumyan, H., 2016. Simulating the effects of climate change, economic and urban planning scenarios on urban runoff patterns of a metropolitan region. Urban Water Journal, 13 (8), 803–818. doi:https://doi.org/10.1080/1573062X.2015.1036086.
- Yan, H. and Edwards, F.G., 2013. Effects of land use change on hydrologic response at a watershed scale, Arkansas. Journal of Hydrologic Engineering, 18 (12), 1779–1785. doi:https://doi.org/10.1061/(ASCE)HE.1943-5584.0000743.
- Zahmatkesh, Z., et al., 2015. Low-impact development practices to mitigate climate change effects on urban stormwater runoff: case study of New York City. Journal of Irrigation and Drainage Engineering, 141 (1), 04014043. doi:https://doi.org/10.1061/(ASCE)IR.1943-4774.0000770.
- Zhou, Q., 2014. A review of sustainable urban drainage systems considering the climate change and urbanization impacts. Water, 6 (4), 976–992. doi:https://doi.org/10.3390/w6040976.
Appendix
Table A1. Range and ranking of parameters used for model development
Table A2. Values of parameters used in rain garden modeling
Table A3. Values of parameters used in rain barrel modeling
Figure A1. Components of Low Impact Development (LID) representation along with different parameters for a rain barrel and rain garden