
 ?Mathematical formulae have been encoded as MathML and are displayed in this HTML version using MathJax in order to improve their display. Uncheck the box to turn MathJax off. This feature requires Javascript. Click on a formula to zoom.
ABSTRACT
Quantifying the effects of climate variability and human activities on runoff change has attracted widespread attention. However, very few researchers have used multiple methods to analyse the spatial differences in their relative contributions on the sub-basin scale. In this study, we used three main methods, multiregression, climate elasticity, and the Water and Energy transfer Process in Large river basins (WEP-L) hydrological model, to explore the spatial differences in the relative contributions of climate variability and human activities to runoff change in the Jumahe River Basin (JRB). The results indicate that the annual mean runoff decreased significantly in the JRB and its three sub-basins during 1964–2015. The three methods produced similar estimates in the JRB, and human activities were the main reason for runoff reduction. The WEP-L model provides the most satisfactory results compared with the other two methods. The influence of human activity increased from upstream to downstream, whereas that of climate change decreased. These results can help to provide a basis for sustainable water resource management.
Editor S. Archfield Associate editor R. Singh
1 Introduction
There is a wide consensus that the water cycle is spatially and temporally affected by both climate variability and human activities (Jones et al. Citation2006, Song et al. Citation2013, Dams et al. Citation2015, Lucas-Borja et al. Citation2020). Climate change can directly influence runoff by changing precipitation and temperature, and can indirectly affect runoff through other elements, such as an increase in wind speed or net solar radiation, which can lead to an increase in evapotranspiration and decreased runoff (Bao et al. Citation2012a, Huang et al. Citation2016). Human activities alter runoff through agricultural irrigation, land-use and land-cover changes, hydraulic engineering, and water withdrawal (Xu et al. Citation2014, Wu et al. Citation2017). Owing to the influence of the changing environment, runoff decline has occurred in many areas and has caused several ecological and environmental issues in China (Hu et al. Citation2012, Wang et al. Citation2012, Gao et al. Citation2016, Hou et al. Citation2018). Therefore, quantitative assessment of the impacts of climate change and human activities on runoff reduction is not only crucial to understanding the causes of this reduction, but also provides a useful reference for water resource management and ecological environmental protection.
Many hydrologists have focused on quantifying the influences of both factors (Wang and Hejazi Citation2011, Zuo et al. Citation2016, Cong et al. Citation2017, Dey and Mishra Citation2017, Sinha et al. Citation2020). To date, the methods applied in these studies can be classified into three groups: statistical analysis, climate elasticity, and hydrological modelling.
The statistical analysis method is based on long-term series of hydroclimatic data and aims to determine the relationships between runoff and climatic factors. For example, Tian et al. (Citation2009) applied the regression analysis method to illustrate the runoff reduction in the Hutuo River basin between 1960 and 1999, and found that human activities were the foremost factor leading to the runoff decline. Based on the slope change ratio of the cumulative quantity (SCRCQ) approach, Wang et al. (Citation2012) indicated that human activities contributed about 92.07% of the discharge reduction in the Yellow River basin from 1950 to 2009.
The climate elasticity method usually applies the precipitation and potential evapotranspiration (PET) elastic coefficient to evaluate the influence of climate variability. This method is a useful approach that is easier to carry out with limited datasets (Zeng et al. Citation2014). For example, Wang et al. (Citation2013) evaluated the influences of climate variability and human activities on runoff decline in the Haihe River basin from 1957 to 2000, using the climate elasticity approach, and concluded that human activities were the main cause of this decline. Gao et al. (Citation2016) determined the discharge responses to variations in land use and climate in the Loess Plateau between 1961 and 2009, using the Budyko framework (an analytical derivation used in climate elasticity methods), and found that land-use change contributed 64.75% to the runoff reduction.
Hydrological models, especially distributed hydrological models based on physical mechanisms, can simulate complex hydrological processes, and these methods can provide details of the water cycle with respect to different spatiotemporal patterns (Cong et al. Citation2009, Zeng et al. Citation2015). These methods can reconstruct natural runoff time series and differentiate the effects of human activities from climate variability. For example, Dong et al. (Citation2014) applied the Soil and Water Assessment Tool (SWAT) distributed model to examine the influences of climate variability and human activities on runoff variation in the Jinghe River basin in China during 1957–2008. The results indicated that 85.7% of the runoff reduction was attributable to human activities, whereas only 14.3% was due to climate variation. Zeng et al. (Citation2015) used two hydrological models (SWAT and the Simple Hydrology model (SIMHYD)) to jointly evaluate the influences of climate variability and human activities on the runoff decline in the Luan River basin in northern China during 1958–2009, and found that human activities contributed 57.9% and 53.2% of the change, respectively.
The results obtained with different methods are not completely consistent and may even be quite different, as shown in . Wang et al. (Citation2013) used hydrological sensitivity analysis to quantify the impact of climate change and human activities on runoff in the Luan River basin from 1957 to 2000 and concluded that human activities accounted for 67% of the runoff decline. Conversely, Bao et al. (Citation2012b) used the variable infiltration capacity (VIC) model to quantify the impact of climate change and human activities on runoff in the same river basin during the same time period, and attributed 58.5% of the runoff decline to climate change. Wang et al. (Citation2009) identified human activities as the main driver for the decrease in runoff in the Chaobai River basin by using the distributed time-variant gain model (DTVGM). On the other hand, Ma et al. (Citation2010) attributed this decrease to climate change by using the geomorphology-based hydrological model (GBHM) and the climate elasticity method. Tian et al. (Citation2009) used the linear regression statistical method of rainfall–runoff to quantify the impact of climate change and human activities on runoff in the Hutuo River basin from 1960 to 1999, and concluded that human activities were the foremost factor leading to the decline in runoff. Wang et al. (Citation2013) used the climate elasticity method to quantify the impact of climate change and human activities on runoff in the same basin in 1957–2000, and found that the contribution of climate change was 72%. The Luan River basin, Chaobai River basin and Hutuo River basin are all located within the Haihe River basin, and the results obtained for the three sub-basins – despite all three being located in the same basin, and despite being studied within similar research periods – can be contradictory if calculated by different methods.
Table 1. Summary of the studies separating the impacts of climate variability and human activities on runoff change by using different methods
In light of the advantages and disadvantages of various methods, and the differences in the calculation results, multiple methods can be applied simultaneously to reduce the uncertainty and improve the reliability of the results (Liang et al. Citation2015, Wu et al. Citation2017). In addition, previous studies mostly considered the study area as a whole, and only a few compared different sub-basins (Xu et al. Citation2013), especially in the case of large basins, where climate and human activities vary at the sub-basin level. Analysing the spatial differences in the contribution rates of influencing factors can help us to better understand the causes of runoff changes in the basin (Sun et al. Citation2014).
We undertook the present study with the following goals: (1) to use three methods – namely, the multiregression method, climate elasticity method, and distributed hydrological model method – to better understand the influence of climate change and human activities on runoff variations, and to identify the applicability of the different methods and their respective merits and limitations in detail; and (2) to explore the spatial variability of the relative contributions from climate variability and human activities on runoff change. The Jumahe River Basin (JRB) was selected as the study area. Here, the annual runoff has decreased significantly since 1979, causing a series of water and eco-environmental issues (Hu et al. Citation2012, Xu et al. Citation2014). In our study, the JRB was divided into three sub-basins to analyse the spatial differences in runoff trends and contribution rates.
2 Study area and data
2.1 Study area
The JRB is an important water source area and ecological barrier for the North China Plain (NCP), and it is also an important food production base. The NCP is experiencing some of the most severe groundwater depletion globally, due to high-intensity exploitation for irrigation. Because of the lack of surface water in the NCP, agricultural irrigation has depended largely on deep groundwater reserves. Consequently, the capability of deep groundwater to maintain sustainable agricultural development in this region has been seriously challenged, due to the continuous decline in deep groundwater levels, land subsidence, and groundwater quality deterioration (Hu et al. Citation2012, Li and Ren Citation2019). The JRB is located in the middle of the Haihe River basin, between 39.1 and 40.1°N and between 114.6 and 116.2°E, and has a drainage area of 10 001 km2. The altitude increases from 10 m at the Xingaifang hydrological station in the southeast to 2824 m in the northwest (). The JRB has a typical monsoon climate; precipitation is highly variable by season, with more than 80% of the annual precipitation (600 mm in 1964–2015) concentrated from June to September. The average annual temperature is 9.6°C (in the period 1964–2015). Most of the study area (98%) is covered by forests, farmlands, grasslands, and built land.
Figure 1. The Jumahe River basin in China. Location of the meteorological and hydrological stations
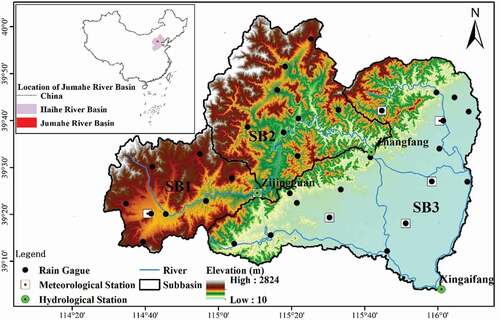
To analyse the spatial differences in the effects of climate variability and human activities on runoff variation, we divided the JRB into three sub-basins based on the locations of the three hydrological stations. The sub-basins were marked as SB1 (upstream region of the Zijingguan hydrological station), SB2 (the region between the Zijingguan and Zhangfang hydrological stations), and SB3 (region between the Zhangfang and Xingaifang hydrological stations), as shown in . SB1 is a mountain canyon, the Zhangfang station is the dividing point between the mountains and plains, above the Zhangfang station is the mountainous area, and SB3 is the plain. The area above the Zhangfang station is mainly forestland and grassland (together 84.9% in 2014), whereas the downstream area is mainly cultivated land and built land (together 60.3% in 2014). The respective areas of the three sub-basins are 1760, 3050 and 5191 km2.
2.2 Data preparation
Daily precipitation data from 34 rain gauge stations were collected from Hydrological Yearbooks. Meteorological data from seven stations were obtained from the National Meteorological Information Center (http://data.cma.cn), and the datasets included precipitation, temperature, sunshine duration, relative humidity, and wind speed. Because of the large differences in altitude in the mountainous part of the basin, air temperature was interpolated using the Tyson polygon interpolation method (Thiessen Citation1911), which includes the impact of altitude. Other meteorological elements were interpolated using the inverse distance-weighted method. PET data were calculated using the Blaney-Criddle method (Blaney and Criddle Citation1950), which requires only temperature and sunshine duration data to make the calculation. The parameters are few, and the application is simple; because it can reflect regional radiation conditions, it has been widely applied in China (Zhang and Cong Citation2016). The monthly discharge data at the Zijingguan, Zhangfang, and Xingaifang hydrological stations were collected from Hydrological Yearbooks. The discharge of SB1 and the entire JRB equaled the streamflow gauged at the Zijingguan and Xingaifang stations. For SB2 the discharge was calculated as the difference between discharges at the Zhangfang and Zijingguan stations, and the discharge of SB3 was calculated as the difference between discharges at the Xingaifang and Zhangfang stations. All the raingauge, meteorological, and hydrological stations are represented in , and the analysed datasets cover the period 1964–2015. Population and gross domestic product (GDP) data from 1964 to 2015 were obtained from the Beijing Municipality and Hebei Province Statistical Yearbook. Water consumption data were taken from the Haihe River Water Resources Bulletin (1980, 1985, 1990, 1995, 2000, and 2006–2014). Land-use patterns in 1980, 1995, 2000, 2005, and 2014 were obtained from the land-use map of China, and were regrouped into six categories: farmlands, grasslands, forests, water, built land, and unused land.
3 Methodology
3.1 General framework
In this study, we used the linear regression approach to analyse the overall trends of the hydroclimatic series, and the Mann-Kendall test (Mann Citation1945, Kendall Citation1975) was applied to determine the significance of the trends in the hydroclimatic series. The Pettitt test (Pettitt Citation1979) was performed to determine the change point of the observed runoff in the JRB during 1964–2015, which was found to be 1979 for all three hydrological stations. Consequently, the hydroclimatic time series were split into two periods: 1964–1979 (the baseline period) and 1980–2015 (the variation period). The differences in the average annual runoff between the two periods were calculated using the following equation:
where is the total change in annual mean runoff, and
and
are the annual mean runoff values during the variation and baseline periods, respectively. For the given river basin, the total changes in runoff were the result of the joint effects of climate variability and human activities. Thus,
can be decomposed as follows
where and
are the annual mean runoff variations caused by climate variability and human activities, respectively.
where and
are the percentage contributions of climate variability and human activities to the runoff variations, respectively. To evaluate the impacts of the two elements, only one of the variables (
or
) should be calculated. The following sections describe in detail the multiregression method, the climate elasticity method, and the hydrological model method used to distinguish these two factors.
3.2 Multiregression method
In the multiregression method, the annual mean runoff is related to annual precipitation and PET for the baseline period as follows:
where is the observed runoff of the baseline period;
and
are the precipitation and PET, respectively, of the baseline period; and
,
, and c are three parameters calculated by the least-squares method.
According to EquationEquation (4)(4)
(4) , the runoff during the variation period was reconstructed as follows:
where is the reconstructed runoff for the variation period, and
and
are the precipitation and PET, respectively, in the variation period.
Thus, the effect of human activities on runoff variation can be calculated as follows:
where and
are the observed and reconstructed annual mean runoffs, respectively, for the variation period. Thus, the impact of climate variability on runoff variation can be calculated as follows
3.3 Climate elasticity method
Schaake (Citation1990) proposed the concept of climate elasticity, and continuous improvements have been made since then (Sankarasubramanian et al. Citation2001, Zheng et al. Citation2009). The elastic coefficient of runoff can be defined as the ratio of the runoff variation rate to the rate of change in climatic elements (Yang and Yang Citation2011). Usually, it is assumed that human activities can be ignored in the baseline period, and therefore, the annual runoff changes are mainly influenced by precipitation and PET, so the changes in runoff resulting from climate variability can be calculated as follows (Zeng et al. Citation2014):
where and
are the runoff elasticities of precipitation and PET, respectively,
and
are variations in precipitation and PET, respectively. If
and
can be estimated, the effect of climate variability on the runoff can be calculated. After quantifying the effects of climate variability using Equation (8), the influence of human activities can be calculated using EquationEquation (2)
(2)
(2) . Six Budyko-based functions were used to calculate
and
. The Budyko-based method is an analytical derivation method based on the Budyko hypothesis (Budyko Citation1948, Citation1974), and
and
can be calculated as follows:
where is the aridity index;
and
can be estimated using different formulas; and six commonly used formulas are applied, as shown in .
Table 2. Six commonly used formulas for the Budyko hypothesis
The parameters θ in the Fu (Citation1981) function and ω in the Zhang et al. (Citation2001) function are the main parameters. We calibrated these two parameters by comparing the long-term annual actual evapotranspiration (AET) calculated using the Fu and Zhang functions, and the water balance equation (WBE) for the baseline period 1964–1979, using values of θ = 3.5 and ω = 3 in SB1, SB2, SB3, and JRB. A comparison of the AET calculated by the Fu function, the Zhang function, and the WBE for the three sub-basins and the JRB are shown in . All the coefficients of determination (R2) are greater than 0.92, and all the gradients of the scatter points simulated by the Fu and Zhang functions and calculated by WBE are close to 1 (), indicating that the results simulated by the Fu and Zhang functions are realistic and acceptable.
Figure 2. Correlations between the annual AET calculated directly from the WBE and that simulated using the Fu and Zhang functions in the three sub-basins and JRB for 1964–1979
3.4 Hydrological model method
The hydrological model has been applied to evaluate the hydrological response to changing environments, because of physical mechanisms and the ability to simulate hydrological processes at different spatiotemporal scales. In this study, we used a distributed hydrological model called “Water and Energy transfer Process in Large river basins” (WEP-L) to separate the influences of climate variability and human activities on runoff changes. The WEP-L model simulates hydrological processes, including evapotranspiration, infiltration, surface runoff, subsurface runoff, groundwater flow, overland flow, river flow routing, snow melt, and water use. The simulated energy transfer processes include longwave radiation, shortwave radiation, sensible heat flux, latent heat flux, artificial heat discharge, and soil heat flux. The modelling approaches adopted for the hydrological and energy processes are described in detail by Jia et al. (Citation2006, Citation2012) and Peng et al. (Citation2013). For simulation of the hydrological processes, evapotranspiration is calculated with the help of the Penman-Monteith equation, whereas infiltration excess during heavy rain is simulated using the generalized Green-Ampt model, and saturation excess during the remaining periods is simulated through balance analysis in unsaturated soil layers. Runoff routings for land and rivers are carried out by applying the one-dimensional kinematic wave approach from upstream to downstream. Groundwater flows and multilayered aquifers were numerically simulated in mountainous and plain areas separately by considering water exchange with surface water, soil moisture, and runoff, and snow melt was simulated by employing a temperature index (Jia et al. Citation2012). The hydrological model was calibrated and validated during the baseline period. The Nash-Sutcliffe efficiency coefficient (Nash), the relative error (Re), and the correlation coefficient (R) were selected as the model performance indicators (Xu et al. Citation2019). Subsequently, the model was applied to simulate the hydrological processes during the variation period without considering human activities, and the natural runoff was reconstructed. Therefore, the differences between the observed and simulated runoff were the impacts of human activities.
where and
are the observed and simulated runoff values, respectively, for the variation period. Thus, the influence of climate variability on the runoff variations can be calculated using Equation (7).
4 Results
4.1 Changes in runoff, precipitation, temperature, and PET
The variation in the annual mean runoff, precipitation, temperature, and PET in the JRB and the three sub-basins during 1964–2015 is shown in ; the black dotted lines represent the annual mean values during the two periods.
Figure 3. Variations of the annual mean runoff, precipitation, temperature and PET in the three sub-basins and JRB during 1964–2015. The dotted line represents the variation trend and the dashed line represents the mean value during the baseline and variation periods
Notably, the annual mean runoff in the three sub-basins and JRB decreased significantly during 1964–2015 (P < 0.05), at rates of −2.08 mm/year in SB1, −2.64 mm/year in SB2, −1.10 mm/year in SB3, and −1.74 mm/year in JRB. During the variation period the annual mean runoff decreased by 42.0% in SB1, 87.1% in SB2, 113.4% in SB3, and 80.0% in JRB. Runoff in the SB3 was below zero during the variation period. This means that the runoff generated by local precipitation and upstream output was not sufficient to support local water consumption.
There was a slight decreasing trend in precipitation (P > 0.05) in the three sub-basins and the JRB over the study period. The average annual precipitation during the variation period decreased by 5.8% in SB1, 9.7% in SB2, 9.0% in SB3, and 8.5% in the JRB. In the JRB the mean annual precipitation values were 637.65 mm and 583.63 mm during the baseline and variation periods, respectively ().
Temperature increased significantly (P < 0.05) during the study period, with rates of 0.025°C/year in SB1, 0.009°C/year in SB2, 0.026°C/year in SB3, and 0.021°C/year in the JRB. PET decreased significantly during 1964–2015 (P < 0.001), at a rate of −1.86 mm/year in SB1, −2.53 mm/year in SB2, −3.23 mm/year in SB3, and −2.71 mm/year in the JRB. It is clear that the annual runoff change rate was much higher than the changes in precipitation rates, temperature, and PET.
4.2 Assessment of the effects of climate variability and human activities on the runoff decline
4.2.1 Multiregression method
One of the methods we used to quantify the influence of the changing environment on runoff reduction in the three sub-basins and the JRB in this study was the multiregression approach. This approach uses the observed annual runoff, precipitation, and PET during the baseline period to establish relationships between runoff and precipitation and runoff and PET. Using EquationEquation (4)(4)
(4) , the reconstruction equation for the three sub-basins and JRB during the baseline period was established, and the mean annual runoff during the baseline period was determined and is presented in . The differences between the reconstructed and measured runoff during the baseline period were −2.76 mm in SB1, 0.76 mm in SB2, 4.47 mm in SB3, and −6.82 mm in the JRB, with a difference of less than 10%. These results indicate that the multiregression method accurately simulated runoff and reconstructed natural runoff during the variation period. As shown in , the reconstructed mean annual runoff was much larger than the observed runoff during the variation period. The results indicate that human activities were the foremost element causing runoff decline, accounting for 65.6% of the change in SB1, 83.3% in SB2, 91.6% in SB3, and 69.4% in the JRB.
Table 3. Effects of climate variability and human activities on the runoff decline in JRB and the three sub-basins calculated using the multiregression method
4.2.2 Climate elasticity method
We applied the climate elasticity approach to separate the effects of climate variability and human activities on annual runoff decline. First, we used EquationEquation (9)(9)
(9) to calculate the runoff elasticity for precipitation and PET, respectively. Next, using Equation (8), the influence of climate variability on annual runoff reduction was evaluated, and the results are presented in . For the JRB, the results of the runoff elasticity to precipitation were 2.63, 2.74, 2.68, 2.58, 3.30, and 3.47, according to the Schreiber, Ol’dekop, Budyko, Pike, Fu, and Zhang functions, respectively. Climate change decreased runoff by 4.77, 4.88, 4.82, 4.83, 5.48, and 5.66 mm with the six climate elastic methods. The rates of contribution of climate change were 7.4%, 7.6%, 7.5%, 7.3%, 8.5%, and 8.8%, respectively, with a mean value of 7.9%. The average climate change contribution rates of the six climate elastic methods were 13.7% in SB1, 7.9% in SB2, and 2.8% in SB3. Human activities accounted for 86.3% of the change in runoff in SB1, 92.1% in SB2, and 97.2% in SB3. These results suggest that the influence of climate variability on runoff reduction is much weaker than that of human activities.
Table 4. Influences of climate variability and human activities on the runoff decline in the three sub-basins and JRB calculated using the climate elasticity approach
4.2.3 Hydrological model method
Runoff has decreased significantly since 1980, and we collected only the observed runoff data, not the natural runoff data. We hypothesized that compared with 1980–2015, human activities in 1964–1979 had less impact, and thus the hydrological processes in the JRB could be considered natural or quasi-natural. Therefore, we calibrated and validated the observed runoff data from the period 1964–1979 and simulated natural hydrological processes from 1964 to 2015. The time period 1964–1974 was chosen as the calibration period, and 1975–1979 was chosen as the validation period, for which monthly discharges were simulated. The calibration and validation criteria were as follows: Nash and R are as close to 1 as possible, and Re is as close as possible to 0. shows that the monthly observed and simulated discharges at the Zijingguan, Zhangfang, and Xingaifang hydrological stations were in good agreement during the baseline period. presents the results for the performance indicators. For the calibration period, the Nash values for the three stations were 0.72, 0.81, and 0.72, respectively, whereas those for the validation period were 0.80, 0.81, and 0.70, respectively. For both the calibration and validation periods, the Re values were lower than 10%, whereas the R values were higher than 0.85. These results showed that the WEP-L model performed well in the simulation of monthly runoff and could be applied to separate the influences of climate variability and human activities on runoff variation during the validation period.
Table 5. The performances of the WEP-L model
Figure 4. Simulation results of monthly discharge for the calibration (1964–1974) and validation periods (1975–1979) in JRB
The separated influences of climate variability and human activities on runoff decline area shown in . The total decline in runoff was −64.48 mm in the JRB, and the measured and simulated runoff values in the variation period were 16.10 and 51.95 mm, respectively. Based on Equation (10), the variation in runoff caused by human activities was −35.85 mm (55.6%), whereas climate variability caused −28.63 mm (44.4%) of the runoff variation. These results show that the effect of human activities in the JRB is stronger than the impact of climate change. For the three sub-basins, the contributions of climate change to changes in runoff were 67.8% in SB1, 45.6% in SB2, and 35.3% in SB3. In contrast, human activities accounted for 32.2%, 54.4%, and 64.7% of the change in each of these sub-basins. Thus, the results of the WEP-L model indicate that climate variability played a leading role in runoff reduction in SB1, whereas human activities were the main cause of runoff reduction in SB2, SB3, and the JRB.
Table 6. Influences of climate variability and human activities on runoff decline in the three sub-basins and JRB calculated using the WEP-L model
4.3 Spatial differences in the relative contributions of climate variability and human activities to the runoff decline
In related studies, the watershed is often treated as a whole unit in order to analyse the different contributions to runoff change. However, for basins with large areas and significant spatial differences in environmental change, the factors influencing runoff change in different sub-regions may be quite different. Analysis of the spatial relationships of runoff variation is helpful to understand the causes of runoff change.
In this study, we used three methods to evaluate the influences of climate variability and human activities on runoff reduction for the three sub-basins, and the relative contributions of the two elements (climate change and human activities) affecting runoff decline are shown in . In SB1, the contribution of human activities to the runoff decline was 65.6%, 87.0%, 86.6%, 86.8%, 87.0%, 85.5%, 85.2%, and 32.2% for the multiregression, Schreiber, Ol’dekop, Budyko, Pick, Fu, Zhang, and WEP-L model, respectively. In SB2, contributions of human activities to the runoff reduction were 83.3%, 92.7%, 92.4%, 92.5%, 92.7%, 91.4%, 91.1%, and 54.4%. In SB3, the contributions of human activities to runoff decline were 91.6%, 97.3%, 97.3%, 97.3%, 97.4%, 97.0%, 96.8%, and 64.7%, respectively. These results suggest that human activities were the main reason for runoff reduction during the variation period in the three sub-basins.
Table 7. Relative contributions of climate variability and human activities to the runoff decline in the three sub-basins
Moreover, as shown in , the spatial gradient of the relative contributions of climate change and human activities to runoff decline in the three sub-basins. The results were calculated using the multiregression method, where the relative contribution of human activities increased from 65.6% in SB1 to 83.3% in SB2, and 91.6% in SB3; in contrast, the relative contribution of climate variability showed an inversely decreasing trend. The results of the climate elasticity method and the WEP-L hydrological model method are presented in ) and (c), respectively, with similar patterns. The results of the three methods suggest a consistent conclusion: that the contribution of human activities increases from 61.4% (average value of the three methods, as shown in )) in SB1 to 76.6% in SB2, and 84.5% in SB3, whereas the contribution of climate variability shows an inverse trend. The influence of climate variability and human activities on runoff decline presents a significant spatial gradient, and the contributions of human activities to the runoff decline presented an increasing trend from upstream to downstream, whereas the contribution of climate variation to the runoff decline showed a decreasing trend from downstream to upstream.
Figure 5. Spatial gradients showing the relative contribution of climate variability and human activities to the runoff decline in the three sub-basins
5 Discussion
5.1 Comparison of the results from different methods
In this study, we used three methods – namely, the multiregression method, the climate elasticity method, and the hydrological model method – to evaluate the influences of climate change and human activities on runoff decline in the JRB. The relative contributions were determined based on the three methods (); values of the climate elasticity method were calculated as the average of the six Budyko-based methods. The results indicate that human activities were the foremost element causing a runoff decrease in the JRB overall, and that climate variability had a dominant role in decreasing the SB1 runoff, as suggested by the results obtained using the WEP-L model method ()). Regardless of location, the rates of contribution of human activities obtained using the climate elasticity method were the largest, followed by the multiregression method, and the results from the WEP-L model method were the lowest (). These differences result from the fact that different methods differ in terms of input data, underlying principles, and applicability. For example, we estimated PET using the Blaney-Criddle equation, which does not consider the effects of wind speed and humidity, and the multiregression method and climate elasticity method used this estimated PET to calculate the impact of climate change on runoff. In contrast, the WEP-L model included the effects of wind speed and humidity. On the other hand, the WEP-L model required daily datasets, whereas the other two methods required annual datasets; that is to say, the WEP-L model could consider the inter-annual and intra-annual effects of climate change, but the other two methods could not.
Figure 6. Comparison of contributions of climate variability and human activities to the runoff decline (values of the climate elasticity approach were the average of the nonparametric method and six Budyko-based methods)
The reconstructed annual runoff series in the baseline period (because it is close to the observed runoff) is critical to the assessment results; therefore, the calculated results will be more accurate. We used the multiregression method and climate elasticity method to reconstruct the annual runoff series during the baseline period, and the annual runoff series during the baseline period simulated by the WEP-L model. In we show the data on the performances of the reconstruction and simulation of the annual runoff series in the baseline period, as calculated using the three methods (multiregression, climate elasticity, and WEP-L model). In both the JRB and the three sub-basins, the WEP-L model has the highest Nash and coefficient of determination (R2), and the relative error (Re) is the lowest among the three methods. Nash is the lowest and Re is the largest for the climate elasticity method. These results indicate that the WEP-L model performs the best; in comparison, the climate elasticity method showed the poorest performance among the three methods.
Table 8. The performances of reconstruction and simulation of the annual runoff series in the baseline period calculated by the three methods (multiregression method, climate elasticity method, WEP-L model)
By comparing the data requirements and calculation processes, we have demonstrated that the three methods have different advantages and disadvantages for quantifying the effects of climate variability and human activities on runoff change ().
Table 9. Relative merits of the three methods (multiregression method, climate elasticity method, WEP-L model) used in this study
The multiregression method is based on the observed hydroclimatic data, analysed via statistical regression to estimate the impact of climate change on runoff. This method requires only a long time series of hydroclimatic data and is easy to calculate. However, it lacks the discretization of physical mechanisms, and the results mainly depend on the observed runoff and precipitation data, and the length of the data may affect the results of climate change effects on runoff (Zheng et al. Citation2009). In previous studies, researchers confirmed that it is usually suitable only for measured hydroclimatic data with long time series in relatively large-scale basins, and when the reconstruction of the runoff series in the baseline period performs well, which limits its application range (Miao et al. Citation2011, Kong et al. Citation2016, Wu et al. Citation2017, Zhao et al. Citation2018). For example, Wu et al. (Citation2017) used the simple linear regression method and the SWAT model to examine runoff reduction in the Yanhe River basin, and found that the two methods obtained contradictory results. This was because the performance in the simple linear regression method was not satisfactory (coefficient of determination R2 = 0.48). In the present study, the R2 values obtained from the multiregression method were 0.60, 0.66, 0.54, and 0.64 in SB1, SB2, SB3, and the JRB, respectively (). These results indicate that 60%, 66%, 54%, and 64% of the observed variations in runoff in SB1, SB2, SB3, and the JRB could be described by the linear relationship. For the three sub-basins and the JRB, the Nash values were 0.75, 0.68, 0.58, and 0.67 for the three sub-basins and the JRB, respectively, and the absolute value of the Re was less than 10% for the three sub-basins and the JRB (). Compared to the results of the WEP-L model, the values of Nash and R2 were lower, whereas the Re was higher for the multiregression method. This means that the reconstruction of the runoff series in the baseline period did not perform well for the multiregression method compared to the WEP-L model.
The climate elasticity method requires less data and is easy to use, but employs a more physical mechanism compared to the multiregression method. However, due to the lack of physical properties considered in this method, it is not possible to further quantify the impact of changes in specific underlying surface conditions on the runoff change, or to describe the inter-annual and intra-annual effects of climate change. It is only applicable to the impacts of runoff change and annual average precipitation change. In fact, runoff variation is also sensitive to other precipitation characteristics (e.g. seasonality, intensity, and concentration), and the occurrence of extreme runoffs may also affect the accuracy of the climate elasticity method (Bao et al. Citation2012a, Wang et al. Citation2013). The climate elasticity method calculates the impact of climate change first, and the remaining part is considered to be caused by human activities, so that the variation in runoff due to human activities cannot be explicitly expressed in the elasticity coefficients (Sun et al. Citation2014, Dey and Mishra Citation2017, Zhao et al. Citation2018).
The distributed hydrological model gives a clear paramterization of physical mechanisms and a more precise description of the hydrological processes in the basin. It can include the temporal and spatial variability of meteorological conditions and basin properties, as well as the annual and inter-annual changes in meteorological elements, which provide more detailed spatial and temporal results. It can also be applied in different scenario simulations. However, this method requires more input data (e.g. topography, soil, land use, and hydroclimatic data). It is time-consuming to build, calibrate, and validate, and there are some uncertainties in the model structure and parameters (Zeng et al. Citation2014, Zhao et al. Citation2014). In both the JRB and the three sub-basins, the WEP-L model has the highest Nash and R2, and Re is the lowest among the three methods. These results indicate that the WEP-L model can explain most of the observed runoff compared with the other two methods. Regardless of the underlying principles, advantages, disadvantages, and applicability of the three categories of methods, the results obtained here show that evaluating the influences of climate change and human activities on the runoff decline in the three sub-basins and JRB using the WEP-L model provides the most satisfactory results.
However, the WEP-L model is most applicable to the JRB, whereas the other two methods do not perform as well. It is unknown whether these three methods will produce the same results in other basins. Different methods have different underlying principles, data requirements, and calculation procedures, and they exhibit different merits and limitations for estimating the impacts of climate variability and human activities on runoff change. Thus, researchers and decision makers should consider the data requirements, merits, and limitations of different methods to choose the most suitable one. For example, if we do not have enough data (e.g. geographical data, land use, and soil data), we can choose the multiregression method or the climate elasticity method. If we have enough data to produce more promising results and reflect the physical processes at different spatiotemporal scales, we can choose the hydrological model. It is worth noting that the method should have good performance in explaining the relationship between observed runoff and reconstructed runoff during the baseline period.
5.2 Comparison of spatial differences
The relative contributions of human activities to the runoff decline increased from 61.4% in SB1 to 76.6% in SB2 and to 84.5% in SB3 ()). From upstream to downstream the relative contributions of human activities to the runoff decline presented an increasing trend, whereas the relative contributions of climate variability decreased. This result could be explained by changes in population, GDP, water consumption, and land use. In this study, we collected data for five periods of land use (1980, 1995, 2000, 2005, and 2014) in the JRB. Land-use maps for 1980 and 2014 in the JRB are shown in . In terms of land-use patterns, forests and grasslands are predominant in SB1 and SB2, and SB3 is primarily farmland and built land. Because population and GDP data in the JRB were difficult to obtain, we used the available data for Beijing Municipality and Hebei Province (JRB contains parts of these two administrative units); the variations in population and GDP in Beijing and Hebei thus may also reflect changes in population and GDP in the studied basin. The population and GDP in Beijing and Hebei in 1964 and 2015 are shown in ). Both increased significantly, especially after 1979. Population increased at rates of 0.26 and 0.67 million per year in Beijing and Hebei, respectively, while GDP increased at rates of 32.64 and 46.42 billion yuan/year in Beijing and Hebei, respectively. With population growth and economic development resulting in greater water demand and hence decreased runoff, as shown in ), water consumption was only 1.47 × 10⁸ m3 in 1980, whereas it increased to 8.34 × 10⁸ m3 in 2014 – nearly 6 times higher.
Figure 7. Map of land use in JRB in (a) 1980 and (b) 2014
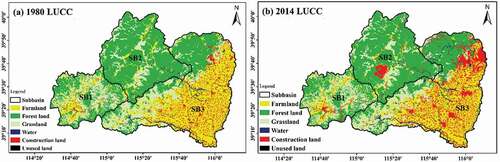
Figure 8. Changes in (a) population and GDP, and (b) the annual water consumption
shows the land-use area in the five periods in the three sub-basins and JRB (because the water and unused land areas were very small compared to the other land-use types, they are not displayed). We observed that changes in the farmland, forest, and grassland areas were small, while there was a clear increase in the built land area. Along with an increase in the area of built land, the amount of infiltrated and evaporated water decreased, which led to increased runoff (Hou et al. Citation2018). Therefore, decreasing runoff cannot be attributed to land-use changes, whereas the growth of population and GDP tended to increase the human use of water and hence decreased runoff; thus, the higher the population and GDP, the greater the decrease in runoff (Liu et al. Citation2017). At the same time, the exploitation of groundwater to irrigate farmlands and industrial needs resulted in a gradual lowering of the groundwater table, which increased the amount of infiltration loss during precipitation and reduced runoff. When combined with the topographic map, it can be seen that the farmlands and construction lands were located mainly downstream, so the population growth and economic development were faster downstream than those upstream. In other words, the downstream area consumed more water than the upstream area did. Therefore, human activities have a greater impact on runoff reduction in the downstream than in the upstream area. Similarly, Yang and Tian (Citation2009) indicated that water use was the dominant factor in runoff reduction in the Haihe River Basin.
Figure 9. Land-use area in the five periods in the three sub-basins and JRB
6 Conclusions
In this study, we analysed the hydroclimatic series and used three methods to quantify the impacts of climate variability and human activities on runoff variations in the JRB and its three sub-basins. Based on this information, we also compared the spatial differences in the relative contributions of climate variability and human activities to runoff variations. The major findings of this study are as follows:
The observed runoff decreased significantly and precipitation decreased slightly between 1964 and 2015. Meanwhile, the temperature increased significantly at a rate of 0.021°C/year in the JRB, while PET decreased significantly at a rate of −2.71 mm/year in JRB.
For the JRB and its three sub-basins, the multiregression method and the climate elasticity method indicated that human activities were the major factor reducing runoff. Human activities were the foremost element causing a decrease in runoff in the JRB. Evaluating the influences of climate change and human activities on the runoff decline in the JRB and the three sub-basins using the WEP-L model provides the most satisfactory results compared with the other two methods.
The results show that the contribution of human activities increased from 61.4% in the upper part of the basin to 76.6% in the middle part and 84.5% in the lower part, whereas the contribution of climate change showed an inverse trend.
Disclosure statement
No potential conflict of interest was reported by the authors.
Additional information
Funding
References
- Bao, Z.X., et al., 2012a. Sensitivity of hydrological variables to climate change in the Haihe River basin, China. Hydrological Processes, 26 (15), 2294–2306. doi:https://doi.org/10.1002/hyp.8348
- Bao, Z.X., et al., 2012b. Attribution for decreasing streamflow of the Haihe River basin, northern China: climate variability or human activities? Journal of Hydrology, 460, 117–129. doi:https://doi.org/10.1016/j.jhydrol.2012.06.054
- Blaney, H.F. and Criddle, W.D., 1950. Determining water requirements in irrigated areas from climatological irrigation data. Washington, D C: US Department of Agriculture, Soil Conservation Service.
- Budyko, M.I., 1948. Evaporation under natural conditions. Leningrad, Russia: Gidrometeorizdat.
- Budyko, M.I., 1974. Climate and life. Orlando, FL: Academic Press.
- Cong, Z.T., et al., 2017. Attribution of runoff change in the alpine basin: a case study of the Heihe Upstream Basin, China. Hydrological Sciences Journal, 62 (6), 1013–1028. doi:https://doi.org/10.1080/02626667.2017.1283043
- Cong, Z.T., et al., 2009. Hydrological trend analysis in the Yellow River Basin using a distributed hydrological model. Water Resources Research, 45 (7), W00A13. doi:https://doi.org/10.1029/2008WR006852
- Dams, J., et al., 2015. Multi-model approach to assess the impact of climate change on runoff. Journal of Hydrology, 529, 1601–1616. doi:https://doi.org/10.1016/j.jhydrol.2015.08.023
- Dey, P. and Mishra, A., 2017. Separating the impacts of climate change and human activities on streamflow: a review of methodologies and critical assumptions. Journal of Hydrology, 548, 278–290. doi:https://doi.org/10.1016/j.jhydrol.2017.03.014
- Dong, W., et al., 2014. Relative effects of human activities and climate change on the river runoff in an arid basin in northwest China. Hydrological Processes, 28 (18), 4854–4864. doi:https://doi.org/10.1002/hyp.9982
- Fu, B.P., 1981. On the calculation of the evaporation from land surface. Chinese Journal of Atmospheric Sciences, 5 (1), 23–31. [in Chinese].
- Gao, G.Y., et al., 2016. Determining the hydrological responses to climate variability and land use/cover change in the Loess Plateau with the Budyko framework. Science of the Total Environment, 557-558, 331–342. doi:https://doi.org/10.1016/j.scitotenv.2016.03.019
- Hou, J.W., et al., 2018. An estimate of human and natural contributions to changes in water resources in the upper reaches of the Minjiang River. Science of the Total Environment, 635, 901–912. doi:https://doi.org/10.1016/j.scitotenv.2018.04.163
- Hu, S.S., et al., 2012. Assessing the impacts of climate variability and human activities on streamflow in the water source area of Baiyangdian Lake. Journal of Geographical Sciences, 22 (5), 895–905. doi:https://doi.org/10.1007/s11442-012-0971-9
- Huang, Z.W., Yang, H.B., and Yang, D.W., 2016. Dominant climatic factors driving annual runoff changes at the catchment scale across China. Hydrology and Earth System Science, 20 (7), 2573–2587. doi:https://doi.org/10.5194/hess-20-2573-2016
- Jia, Y.W., et al., 2012. Attribution of water resources evolution in the highly water-stressed Hai River Basin of China. Water Resources Research, 48 (2), W02513. doi:https://doi.org/10.1029/2010WR009275
- Jia, Y.W., et al., 2006. Development of the WEP-L distributed hydrological model and dynamic assessment of water resources in the Yellow River basin. Journal of Hydrology, 331 (3–4), 606–629. doi:https://doi.org/10.1016/j.jhydrol.2006.06.006
- Jones, R.N., et al., 2006. Estimating the sensitivity of mean annual runoff to climate change using selected hydrological models. Advances in Water Resources, 29 (10), 1419–1429. doi:https://doi.org/10.1016/j.advwatres.2005.11.001
- Kendall, M.G., 1975. Rank correlation measures. London: Charles Griffin.
- Kong, D.X., et al., 2016. Impact assessment of climate change and human activities on net runoff in the Yellow River Basin from 1951 to 2012. Ecological Engineering, 91, 566–573. doi:https://doi.org/10.1016/j.ecoleng.2016.02.023
- Li, P. and Ren, L., 2019. Evaluating the effects of limited irrigation on crop water productivity and reducing deep groundwater exploitation in the North China Plain using an agro-hydrological model: II. Scenario simulation and analysis. Journal of Hydrology, 574, 715–732. doi:https://doi.org/10.1016/j.jhydrol.2019.03.034
- Liang, W., et al., 2015. Quantifying the impacts of climate change and ecological restoration on streamflow changes based on a Budyko hydrological model in China’s Loess Plateau. Water Resources Research, 51 (8), 6500–6519.
- Liu, J.Y., et al., 2017. Contribution of multiple climatic variables and human activities to streamflow changes across China. Journal of Hydrology, 545 (3), 145–162. doi:https://doi.org/10.1016/j.jhydrol.2016.12.016
- Lucas-Borja, M.E., et al., 2020. Impacts of land-use and climate changes on surface runoff in a tropical forest watershed (Brazil). Hydrological Sciences Journal, 65 (11), 1956–1973. doi:https://doi.org/10.1080/02626667.2020.1787417
- Ma, H., et al., 2010. Impact of climate variability and human activities on streamflow decrease in the Miyun Reservoir catchment. Journal of Hydrology, 389 (3), 317–324. doi:https://doi.org/10.1016/j.jhydrol.2010.06.010
- Mann, H.B., 1945. Non-parametric tests against trend. Econometrica, 13 (3), 245–259. doi:https://doi.org/10.2307/1907187
- Miao, C.Y., et al., 2011. A preliminary estimate of human and natural contributions to the changes in water discharge and sediment load in the Yellow River. Global Planet Change, 76 (3–4), 196–205. doi:https://doi.org/10.1016/j.gloplacha.2011.01.008
- Ol’dekop, E.M., 1911. On evaporation from the surface of river basins: transactions on meteorological observations. Lur-evskogo (in Russian), report. Tartu, Estonia: University of Tartu.
- Peng, H., et al., 2013. Assessing climate change impacts on the ecohydrology of the Jinghe River basin in the Loess Plateau, China. Hydrological Sciences Journal, 58 (3), 1–20. doi:https://doi.org/10.1080/02626667.2013.774457
- Pettitt., A., 1979. A nonparametric approach to the change point problem. Journal of the Royal Statistical Society, 28 (2), 126–135.
- Pike, J.G., 1964. The estimation of annual runoff from meteorological data in a tropical climate. Journal of Hydrology, 2 (2), 116–123. doi:https://doi.org/10.1016/0022-1694(64)90022-8
- Sankarasubramanian, A., Vogel, R.M., and Limbrunner, J.F., 2001. Climate elasticity of streamflow in the United States. Water Resources Research, 37 (6), 1771–1781. doi:https://doi.org/10.1029/2000WR900330
- Schaake, J.C., 1990. From climate to flow. In: Climate change and U.S. water resources. New York, USA: John Wiley, 177–206.
- Schreiber, P., 1904. Über die Beziehungen Zwischen dem Niederschlag und der Wasserführung der Flüsse in Mitteleuropa. Zeitschrift fur Meteorologie, 21 (10), 441–452.
- Sinha, R.K., Eldho, T.I., and Subimal, G., 2020. Assessing the impacts of land cover and climate on runoff and sediment yield of a river basin. Hydrological Sciences Journal, 65 (12), 2097–2115. doi:https://doi.org/10.1080/02626667.2020.1791336
- Song, X.M., et al., 2013. Review for impacts of climate change and human activities on water cycle. Journal of Hydrologic Engineering, 44 (7), 779–790.
- Sun, Y., et al., 2014. Exploring the spatial variability of contributions from climate variation and change in catchment properties to streamflow decrease in a mesoscale basin by three different methods. Journal of Hydrology, 508 (2), 170–180. doi:https://doi.org/10.1016/j.jhydrol.2013.11.004
- Thiessen, A.H., 1911. Precipitation averages for large areas. Monthly Weather Review, 39, 1082–1084.
- Tian, F., Yang, Y.H., and Han, S.M., 2009. Using runoff slope-break to determine dominate factors of runoff decline in Hutuo River Basin, North China. Water Science & Technology, 60 (8), 2135–2144. doi:https://doi.org/10.2166/wst.2009.578
- Wang, D.B. and Hejazi, M., 2011. Quantifying the relative contribution of the climate and direct human impacts on mean annual streamflow in the contiguous United States. Water Resources Research, 47 (10), W00J12. doi:https://doi.org/10.1029/2010WR010283
- Wang, G.S., Xia, J., and Chen, J., 2009. Quantification of effects of climate variations and human activities on runoff by a monthly water balance model: a case study of the Chaobai River basin in northern China. Water Resources Research, 45 (7), W00A11. doi:https://doi.org/10.1029/2007WR006768
- Wang, S.J., et al., 2012. Contributions of climate change and human activities to the changes in runoff increment in different sections of the Yellow River. Quaternary International, 282, 66–77. doi:https://doi.org/10.1016/j.quaint.2012.07.011
- Wang, W.G., et al., 2013. Quantitative assessment of the impact of climate variability and human activities on runoff changes: a case study in four catchments of the Haihe River basin, China. Hydrological Processes, 27 (8), 1158–1174. doi:https://doi.org/10.1002/hyp.9299
- Wu, J.W., et al., 2017. Detecting the quantitative hydrological response to changes in climate and human activities. Science of the Total Environment, 586, 328–337. doi:https://doi.org/10.1016/j.scitotenv.2017.02.010
- Xu, F., et al., 2019. Vertical zonality of the water cycle and the impacts of land use changes on runoff in the Qingshui River basin of Wutai Mountain, China. Hydrological Sciences Journal, 64 (16), 2080–2092. doi:https://doi.org/10.1080/02626667.2019.1655146
- Xu, X.Y., et al., 2014. Attribution analysis based on the Budyko hypothesis for detecting the dominant cause of runoff decline in Haihe basin. Journal of Hydrology, 510 (6), 530–540. doi:https://doi.org/10.1016/j.jhydrol.2013.12.052
- Xu, X.Y., et al., 2013. Assessing the impacts of climate variability and human activities on annual runoff in the Luan River basin, China. Hydrology Research, 44 (5), 940–952. doi:https://doi.org/10.2166/nh.2013.144
- Yang, H.B. and Yang, D.W., 2011. Derivation of climate elasticity of runoff to assess the effects of climate change on annual runoff. Water Resources Research, 47 (7), W07526. doi:https://doi.org/10.1029/2010WR009287
- Yang, Y.H. and Tian, F., 2009. Abrupt change of runoff and its major driving factors in Haihe River Catchment, China. Journal of Hydrology, 374 (3), 373–383. doi:https://doi.org/10.1016/j.jhydrol.2009.06.040
- Zeng, S.D., Xia, J., and Du, H., 2014. Separating the effects of climate change and human activities on runoff over different time scales in the Zhang River basin. Stochastic Environmental Research and Risk Assessment, 28 (2), 401–413. doi:https://doi.org/10.1007/s00477-013-0760-8
- Zeng, S.D., et al., 2015. Effects of climate change and human activities on surface runoff in the Luan River Basin. Advances in Meteorology, 2015, 1–12. doi:https://doi.org/10.1155/2015/740239
- Zhang, L., Dawes, W.R., and Walker, G.R., 2001. Response of mean annual evapotranspiration to vegetation changes at catchment scale. Water Resources Research, 37 (3), 701–708. doi:https://doi.org/10.1029/2000WR900325
- Zhang, L.X. and Cong, Z.T., 2016. Calculation of reference evapotranspiration based on FAO-Blaney-Criddle method in Hetao Irrigation district. Transactions of the Chinese Society of Agricultural Engineering, 32 (16), 95–101. [in Chinese with English abstract].
- Zhao, G.J., et al., 2018. Assessing response of sediment load variation to climate change and human activities with six different approaches. Science of the Total Environment, 639, 773–784. doi:https://doi.org/10.1016/j.scitotenv.2018.05.154
- Zhao, G.J., et al., 2014. Quantifying the impact of climate variability and human activities on streamflow in the middle reaches of the Yellow River basin. China. Journal of Hydrology, 519, 387–398. doi:https://doi.org/10.1016/j.jhydrol.2014.07.014
- Zheng, H.X., et al., 2009. Responses of streamflow to climate and land surface change in the headwaters of the Yellow River Basin. Water Resources Research, 45 (7), 641–648. doi:https://doi.org/10.1029/2007WR006665
- Zuo, D.P., et al., 2016. Assessing the effects of changes in land use and climate on runoff and sediment yields from a watershed in the Loess Plateau of China. Science of the Total Environment, 544, 238–250. doi:https://doi.org/10.1016/j.scitotenv.2015.11.060