
 ?Mathematical formulae have been encoded as MathML and are displayed in this HTML version using MathJax in order to improve their display. Uncheck the box to turn MathJax off. This feature requires Javascript. Click on a formula to zoom.
ABSTRACT
In this study, contributions of climate change and human activity to streamflow changes were estimated to enable decision makers to develop adaptation strategies for management of regional water resources. Flow trends and climate variables were analysed with the Mann-Kendall method. The year 1986 was selected to perform the Pettitt test to identify the change point of the runoff time series. Then, three methods were used for impact differentiation: climatic elasticity, least-squares support-vector machine (LS-SVM), and the soil and water assessment tool (SWAT). The results showed that climate change (38–67%) and human activities (33–62%) influence runoff reduction. Thus three management scenarios are introduced to reduce the effects of climate change and human activity: (1) adjusting wheat and barley cultivation levels; (2) maintaining wheat and barley cultivation levels and replacing other crops with potatoes; (3) increasing irrigation efficiency. All scenarios showed an increase in runoff, but the first scenario had the most impact.
Editor S. Archfield; Associate editor K. Ryberg
1 Introduction
Climate change has altered the pattern and spatial distribution of rainfall and the proportion of evapotranspiration (Beniston Citation2002). The impacts of climate change and local human activities, such as land-use change, dam construction, and river diversion, influence the hydrological processes of catchments and regional water resources (Yang et al. Citation2020).
Due to climate change impacts and extensive local human activities, there is a decreasing trend in runoff of the Zayandehrud River in central Iran (Sayedipour et al. Citation2015). Zayandehrud is a vitally important river for agricultural development, domestic water supply, and the overall economic activity of Isfahan Province in central Iran. However, population growth and higher industrial activities have increased the demand and competition for water resources in its basin (Madani and Mariño Citation2009).
In order to formulate adaptive policies, it is imperative to quantify the share of the changes in runoff due to climate change vs. human activities. There are four commonly used methods to evaluate the hydrological effects of environmental changes, namely paired watershed methods (Wei et al. Citation2013), hydrological model simulations (Han et al. Citation2019), analytical approaches (Liu et al. Citation2019, Zhang et al. Citation2020), and numerical modelling (Jiang et al. Citation2011). Paired watershed methods have advantages in analysing the hydrological effects of different weather conditions in small watersheds, although extending them to mesoscale or large scale is challenging because of the various natural conditions in large basins (He et al. Citation2019). Hydrological models have been widely used to assess the impacts of climate change and local human activity on water resources. The commonly used models include SWAT (Arnold et al. Citation2012), Variable Infiltration Capacity (VIC) (Yan et al. Citation2020), and Topography-based hydrological Model (TOP) (Beven Citation1997), to name a few.
In previous studies, researchers have effectively used SWAT for runoff assessment (Schuol et al. Citation2008), water quality simulation (Abbaspour et al. Citation2007), sediment yield estimation (Rostamian et al. Citation2008), climate change (Rouholahnejad Freund et al. Citation2017), and management of erosion-prone areas (Fukunaga et al. Citation2015). Ahn and Merwade (Citation2014) analysed the effects of climate change and human activity in four US states using SWAT. Their results showed that human activities had more devastating impacts than climate change in all the studied states. Chang et al. (Citation2016) used a TOP hydrological model to quantify the contributions of climate change and human activity to Xiang River flow changes in China and reported that they are responsible for 40.4% and 59.6%, respectively, of streamflow variation in the studied area.
Climate elasticity is a prevalent method that has been widely used to separate the impacts of climate change from human activities on runoff variation (Xin et al. Citation2019). The climate elasticity of runoff can be defined as the change in runoff proportional to changes in climatic variables like precipitation and evapotranspiration (Fu et al. Citation2007). In this method, runoff sensitivity is evaluated by estimating the elasticity coefficients of climatic variables for the pre-change-point period. The specific change of the streamflow caused by climate change for the post-change-point period would be obtained from the elasticity coefficient of the climatic factors (Lee and Yeh Citation2019). Mu et al. (Citation2020) used climate elasticity to quantify the effects of climate change and human activity on six river streamflows in China; their results indicate that total streamflow decreased by 24.5% with a 10% decrease in precipitation, whereas a 10% decrease in potential evapotranspiration would induce a 37.7% increase in total streamflow. Furthermore, human activities accounted for 87% of the reduction in total streamflow, while 13% was attributed to climate change.
Alongside analytical and hydrological modelling methods, machine learning (ML) is a state-of-the-art approach that has started to play an essential role in the hydrological time-series process. Since ML can fit complex high-dimensional relationships, it can be developed as a reliable high-precision model, even if black-boxing makes the physical process ambiguous (Sadler et al. Citation2018). Least-squares support-vector machine (LS-SVM; Suykens and Vandewalle Citation1999) is a numerical model used to simulate the runoff. Nourani et al. (Citation2017) developed an LS-SVM model to forecast daily multistation streamflow. The results confirmed the LS-SVM model’s ability in streamflow modelling. Adnan et al. (Citation2020) assessed the performance of LS-SVM, optimally pruned extreme learning machine (OP-ELM), multivariate adaptive regression splines (MARS), and M5 model tree (M5Tree) in predicting monthly streamflow using precipitation and temperature as input data. The results indicated that LS-SVM and MARS-based models’ accuracies in streamflow modelling were higher than those of the other two models. It should be noted that using three different methods provides more comprehensive results so that managers can make more accurate decisions.
Given the effects of climate change and human activity, the best management scenarios should be introduced to reduce their impacts. However, climate change and human activity impacts on runoff are affected by many anthropogenic factors, such as incorrect cultivation practices, crop patterns, and shifting cultivation practices. Currently, there is concern about the sustainability of conventional arable land cultivation worldwide (Khatri and Tyagi Citation2015). Therefore, to increase runoff, different approaches should be considered to change crop cultivation type.
In this study, the relationship between streamflow and climate data upstream of Zayandehrud Dam is evaluated. Quantifying climate change and human activity impacts on runoff reduction, not only in this watershed but also in the country generally, is considered a challenging issue for decision makers. As the upstream area of Zayandehrud Dam is shared by two provinces in central Iran, challenges have always existed regarding water demands. Chaharmahale Bakhtiari province attributes runoff reduction to climate change, whereas Isfahan Province, as a downstream part of the basin, attributes runoff reduction to human activity and increasing water consumption in the upstream portion of the basin. Firstly, to help managers with their water supply allocation, some information about factors that cause runoff decline in the basin are given and quantified. Secondly, modelling uncertainties must be quantified to allow managers to make more sensible decisions. For this reason, we evaluated the impacts of climate change and human activity on runoff using three different approaches, namely climate elasticity, data-driven LS-SVM, and SWAT.
Finally, this study provides a determinative management solution to reduce the contributions of climate change and human activities to increasing runoff by considering crop patterns and irrigation productivity. In this study, ‘climate change’ refers to changes in precipitation and potential evapotranspiration, and ‘human activities’ refers to land-use changes, direct exploitation of surface water resources, and hydraulic structure constructions.
2 Study area
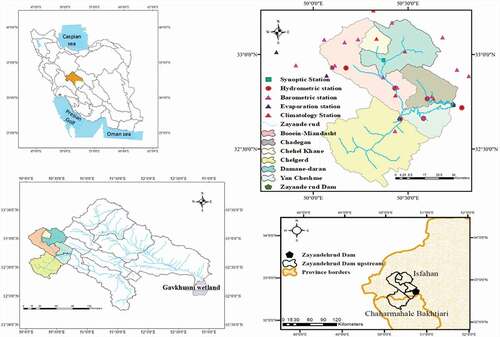
Zayandehrud basin is located in central Iran (). Of the 26 917 km2 area of the basin, 93% is located in Isfahan Province, and 7% is located in Chaharmahale Bakhtiari Province. However, only the area upstream of Zayandehrud Dam makes a significant contribution to the river streamflow. Zayandehrud Dam upstream has several sub-basins, of which Boeen-Damaneh, Chelgerd-Ghale-Shahrokh, and Chadegan are among the most important. Runoffs from these sub-basins flow into Eskandari, Ghale-Shahrokh, and Manderjan hydrometric stations, respectively. The Zayandehrud Dam upstream has an area of approximately 4262 km2 and is positioned between latitudes 33.19 and 32.30°N and between longitudes 50.03 and 50.76°E. The altitude of this area ranges from 1989 to 3935 m a.s.l.
Figure 1. An overview of Zayandehrud basin and sub-basins upstream of Zayandehrud Dam
3 Study dataset
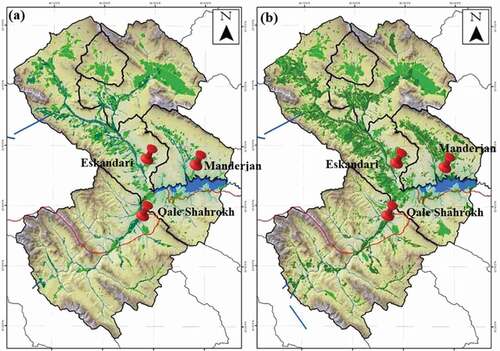
Climate data were available for 11 raingauging stations, six climatological stations, two synoptic stations, and one evapotranspiration station. A Digital Elevation Model (DEM) map with a cell size of 50 m was obtained from the US National Aeronautics and Space Agency (NASA) database. For land use, we employed a digital vegetation map prepared by the Iranian Forests and Rangelands Organization, with 15 land-use classes and a spatial resolution of 1:250 000, for the year 1996 (the year of the hydrological change point). Cultivation areas upstream of Zayandehrud Dam increased from 1982 to 2015 (). A soil map of the Zayandehrud basin with a spatial resolution of 1:500 000 was derived from soil studies and profiles prepared by the Iranian Ministry of Agriculture in 2009.
Figure 2. Comparison of area under cultivation in the upstream part of Zayandehrud basin: (a) 1982; (b) 2015. (Isfahan Regional Water Authority (IRWA) Citation2020)
Daily precipitation and minimum and maximum temperature from 1980 to 2016 were obtained from Isfahan Regional Water Authority and Iran Meteorological Organization, respectively. The basin management information, including cropping, ploughing, harvesting, and irrigation, was obtained from the Iranian Ministry of Agriculture. Monthly discharges of Eskandari, Ghale-Shahrokh, and Manderjan hydrometric stations from 1980 to 1996 were obtained from the Isfahan Regional Water Authority and used to calibrate and validate the models.
4 Methodology
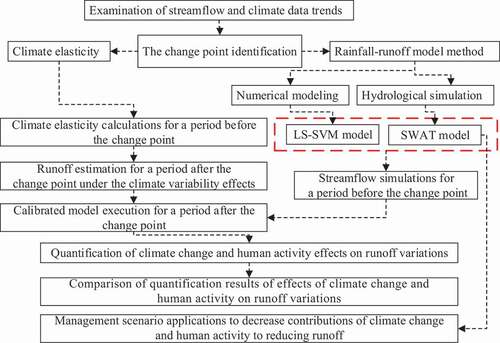
Trend and change-point analyses were carried out for flow upstream of Zayandehrud Dam. Then, to separate human activities from climate change effects, climatic elasticity, numerical modelling (LS-SVM), and hydrological simulation (SWAT) methods were used ().
Figure 3. An overview of the research process
4.1 Mann-Kendall trend test
The Mann-Kendall trend test was used to evaluate the statistical significance of observed changes in streamflow. The non-parametric Mann-Kendall test was used to assess streamflow and climate data trends. For the time series X1, …, Xn, the Mann-Kendall test uses the following equation (Kendall Citation1938, Mann Citation1945):
where sgn is the sign function of (S), and if S > 0, observations in the time series tend to be larger than those that appear earlier in the time series, while the reverse is true if S < 0.
The variance of S (Var(S)) is given by:
where t varies over the set of tied ranks, and ft is the number of times that the rank t appears.
The S statistic usually has a normal distribution, in which case its standardized form can be calculated using EquationEquation (3)(3)
(3) (Kendall Citation1975):
The Z statistic determines a significant trend, where positive and negative values indicate opposite trend directions.
4.2 Change-point test
To determine the magnitude of the effects of climate change and human activity on runoff changes, we need to identify the change point of the runoff time series (Dey and Mishra Citation2017). In this study, we used the Pettitt method to find change points in continuous time series of climatic data. In this approach, a time series is represented by two sets of samples: x1, …, xt and xt+1, …, xn. The Pettitt indices Ut,n can be calculated from the following equations (Pettitt Citation1979):
The most probable change point τ is found where its value satisfies:
and the significance probability (Pt) associated with value Kt is approximately evaluated as
Given a certain significance level α, if P < α, we reject the null hypothesis and conclude that Xτ is a significant change point at level α. For reference, throughout our numerical analysis we use a significance level of α = 0.05 to interpret the results.
4.3 Separation of climate change from human activity as contributors to variation in runoff
4.3.1 Climate elasticity analysis
Climate elasticity analysis considers the change in runoff (ΔQ) to be a function of climate variability (C) and other properties (H) (Hu et al. Citation2012):
where H represents the combined effects of natural features, soil, land use, land cover, and human activities such as drainage networks, water transfers, and dam construction. Assuming the topography and soil of the area remain unchanged, H represents only the effects of human activity. By this assumption, runoff variation is expressed as
where ΔQ is the total runoff variation due to climate variability ΔQc and human activities ΔQH. Since ΔQ is determined from observed data, by obtaining ΔQc (e.g. by using the climate elasticity method) ΔQH can then be calculated.
Sankarasubramanian and Vogel (Citation2003) proposed a non-parametric method for estimating climate elasticity directly from observed data:
where εi is the climate elasticity index, and ΔQi and ΔXi are changes in annual runoff and climate variable relative to their long-term averages and
, respectively. We note that when X approaches
, the denominator in EquationEquation (9)
(9)
(9) approaches zero, causing a numerical problem. To solve this problem, Zheng et al. (Citation2009) proposed rewriting EquationEquation (9)
(9)
(9) as follows:
Therefore, the climate elasticity of runoff is the coefficient of linear regression in EquationEquation (10)(10)
(10) . A positive value of the elasticity coefficient indicates that Q increases with an increase in this variable, whereas a negative value indicates that Q decreases with an increase in this variable.
4.3.2 Rainfall–runoff model method
This approach involves creating, calibrating, and validating a model of the study region for a period before the change point (natural period), then implementing the calibrated model on climate data related to the period after the change point with the same land-use map. The final step involves quantifying and comparing the effects of human activity with those of climate change using the following equations (Dey and Mishra Citation2017):
where WT is the total runoff variation, i.e. the difference between the average runoff in the natural period and the average runoff in the impacted period; WN is the average runoff in the natural period; WL is the average runoff of the river in the impacted period; WM is the average runoff simulated by the model for a period after the change point; WC is the portion of runoff variation that can be attributed to climate change; WH is the portion of runoff variation that can be attributed to human activities; and QC and QH are runoff variation percentages that can be attributed to climate change and human activities, respectively.
4.3.2.1 Hydrological modelling of the basin
We used the SWAT model for a hydrological simulation of the study region. The primary purpose of the SWAT model is to simulate spatiotemporal effects of different land management methods on water and sedimentation quantity and quality in complex basins based on climatic conditions, land use, and soil type over long periods (Neitsch et al. Citation2011). The main inputs of this model are topography, soil characteristics, land use, climate, and land management practices. This model divides the basin into several sub-basins, each sub-divided again into several hydrological response units (HRUs). Each HRU consists of unique land use, soil type, and slope classes.
We calibrated the SWAT model using river discharge, crop yield, evapotranspiration, and aquifer level changes. SWAT model calibration and validation were performed in a comprehensive multistep process. For this purpose, first, SWAT Calibration Uncertainty Procedures (SWAT-CUP) was used (Abbaspour et al. Citation2004, Abbaspour Citation2007) to perform sensitivity analysis, calibration, and validation of the hydrological model.
Calibration and validation were performed with monthly data for a natural period from 1980 to 1995. This process firstly involved calibrating the model from 1980 to 1991 and then validating it from 1992 to 1995 with three years of the warm-up period. Of the several types of calibration algorithms available in SWAT-CUP, the SUFI-2 algorithm was used for this purpose.
Two critical statistics for the calibration process with SWAT-CUP are p-factor and r-factor. P-factor is the percentage of observed data br acketed by the 95% prediction uncertainty (95PPU). The closer the p-factor is to 1, the more accurate the simulation. R-factor is the average distance between the upper and lower 95PPU. Naturally, the closer the r-factor is to 0, the smaller the uncertainty band, and the lower the uncertainty.
According to Abbaspour et al. (Citation2007), the acceptable values for these factors are an r-factor around 1 and a p-factor > 0.7 for flow. For crops and sediment, a p-factor of > 0.5 and an r-factor of up to 2 could also be acceptable.
Simulation results are evaluated using the coefficient of determination (R2) and the Nash-Sutcliffe model efficiency coefficient (ENS). After simulating runoff with the SWAT model, the effects of human activity and climate change on runoff variation were quantified using EquationEquations (11)(11)
(11) to (15).
4.3.2.2 Least-squares support-vector machine (LS-SVM)
The modern definition of support-vector machine was proposed by Cortes and Vapnik (Citation1995) based on statistical learning theory and structural risk minimization. De Brabanter et al. (Citation2002) proposed LS-SVM, which instead of using quadratic programming like the classic SVM, utilizes linear equations to achieve higher computational accuracy. Let be a given dataset where xiϵRp is the input vector and yiϵR is the output vector, and let Φ be the nonlinear mapping of samples to the feature space. Under these assumptions, the regression function used in the SVM model is given by:
where T refers to matrix transpose; φ(xi) is a nonlinear mapping of inputs to high-dimensional feature space; and W and b are regression function weight and bias, respectively, which are determined by minimizing the objective function (J(W,e)) in Equation (17).
Subject to
where γ is an error adjustment parameter, and ei is an error of the training dataset. Finally, the model estimation function (LS-SVM) is defined as follows:
where K(xi,xj) is called the kernel function and is a function of the interior multiplication of mappings to feature space, given by Suykens et al. (Citation2002) as follows:
For the sensitivity analysis of LS-SVM models, it is common to test linear, polynomial, and radial-basis kernel functions and selecting the one with the least error and best performance in simulation. The LS-SVM regression (with Radial Basis Function kernel) was constructed with two kernel parameters, γ (gamma) and σ2 (sig2); to obtain the best performance of the model, these parameters should be optimized. This study used a simplex algorithm to optimize kernel parameters, and the runoff was simulated with the independent variables precipitation and potential evapotranspiration.
As using raw data in the model is likely to reduce the operational speed and accuracy, to increase the performance of the LS-SVM model all data must be normalized to an interval of [0.1, 0.9] using the following equation, and then results must be transformed back to their original state after simulation.
where xi is a standardized value, x is the original value, and xmin and xmax are the minimum and maximum values of the data, respectively.
MATLAB 2014 software was used to run the LS-SVM model (1980–1995), the training period (1980–1991), the validation period (1992–1995), and was executed again from 1997 to 2016. Simulations results are evaluated using R2 and root mean square error (RMSE) in the model calibration and test phases. EquationEquations (11)(11)
(11) to (15) were used to quantify the effects of human activity and climate change on runoff variation.
4.4 Management scenarios to decrease human activity and climate change impacts on runoff reduction
Changing the cropping pattern is a crucial strategy in reducing water consumption in agriculture. Given that both climate change and human activities effectively reduce runoff, three scenarios have been applied to reduce the effects of these two factors. These three scenarios, which are focused on reducing agricultural demand for water, are described below. Some economic and social issues may arise from this change, which are outside the scope of this study.
Scenario (I): Changing cropping pattern; preserving existing wheat and barley fields and replacing other crops with wheat and barley
Given that the region’s dominant crops are diverse, such as wheat, barley, alfalfa, and rice, this scenario emphasizes planting crops with the lowest water requirements. This strategy involves replacing water-intensive crops such as sugar beet, alfalfa, and cucurbits with low-water crops such as barley and wheat. The HRU definition was adjusted to reflect the change in the areas under cultivation to apply this strategy in the SWAT model.
Scenario (II): Changing cropping pattern; preserving existing wheat and barley fields and replacing other crops with potatoes
This scenario was applied to reduce the impact of climate change on agricultural productivity and aimed to preserve the crops most resistant to climate change. Wheat, barley, and potatoes, which are resistant to climate change, are the region’s dominant crops. Hence, they should be preserved, and other crops are replaced with potatoes.
Scenario (III): Increasing irrigation efficiency
The opposition of farmers to changing crops is an important issue when defining management scenarios, because changing crops may not have the forecasted economic benefits for farmers. This scenario aims to implement management without changing existing crop patterns by simply modifying the irrigation method to reduce water consumption.
The results of the defined scenarios are evaluated and compared using two approaches. The first approach estimates the gross water requirement of the dominant crops in each sub-basin without using the simulation model, and the second approach uses SWAT model capability to increase inflow at stations upstream of Zayandehrud Dam.
5 Results
5.1 Trends in the time series of river runoff and climatic data
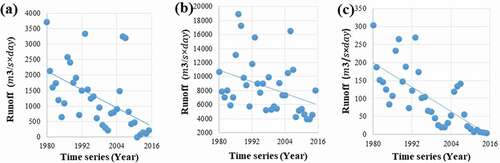
Runoff to the three stations – Eskandari, Ghale-Shahrokh, and Manderjan – indicates a decreasing trend from 1980 to 2016 (). Based on the runoff trend analysis, the Z statistics for the upstream stations were −4.2, −2.7, and −5.40, respectively, with p values below the significance level (α), which indicates statistically significant decreasing trends.
Figure 4. Runoff time series trend (1980–2016): (a) Eskandari station; (b) Ghale-Shahrokh station; (c) Manderjan station
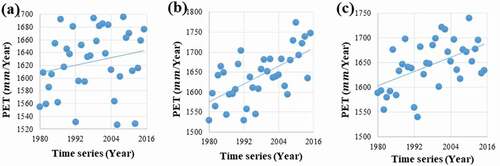
Regarding the p value being much lower than α, one can confidently note a significant trend in all stations (). As shown in , the trend test for precipitation indicates no significant trend. For all three stations, the Z statistics were less than 1. p values for Eskandari, Ghale-Shahrokh, and Manderjan stations were 0.957, 0.438, and 0.361, respectively, which are all higher values than α. Thus, the significant trend assumption in precipitation was declined (), but unlike precipitation, an increasing trend in the evapotranspiration data is observed in , and the Z statistics were 1.56, 3.8, and 2.51. The small p values for Ghale-Shahrokh and Manderjan stations can be interpreted as strong evidence against the null hypothesis, which is the absence of a significant trend. However, in the case of Eskandari station, the evidence against the trend’s existence is not as strong, and as such, the null hypothesis cannot be rejected at a 5% significance level in this case ().
Table 1. Mann-Kendall test results of data collected from the chosen stations (1980–2016)
Figure 5. Precipitation time series trend (1980–2016): (a) Eskandari station; (b) Ghale-Shahrokh station; (c) Manderjan station
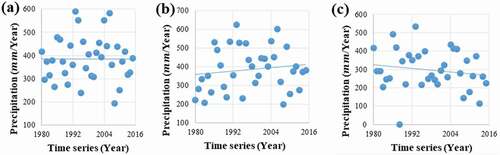
Figure 6. Evapotranspiration time series trend (1980–2016): (a) Eskandari station; (b) Ghale-Shahrokh station; (c) Manderjan station
5.2 Change-point examination in river runoff time series
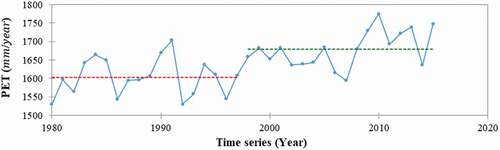
The Pettitt test was used to identify the change point in the runoff time series from 1980 to 2016. The results of this test (, ) show that the change point of the time series was in 1996 for Eskandari and Manderjan stations, but Ghale-Shahrokh station had change points in both 1996 and 2007. The change point for potential evapotranspiration at this station was also determined to be 1996 (). As there must be only one change point per station, we took 1966 as the change point for Ghale-Shahrokh station. After determining the change points, river runoff data were divided into pre- (1980–1996) and post- (1997–2016) change-point periods.
Table 2. Pettitt test results of data collected from the chosen stations (1980–2016)
Figure 7. Pettitt test results for hydrometric station runoff upstream of Zayandehrud Dam (1980–2016): (a) Eskandari station; (b) Ghale-Shahrokh station; (c) Manderjan station
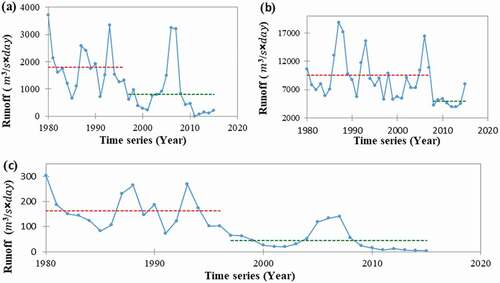
Figure 8. Pettitt test results for potential evapotranspiration (PET) at Ghale-Shahrokh station (1980–2016)
Since the p values are much lower than α, 1996 has been selected as the change point ().
5.3 Modelcalibration and validation
Models should be calibrated and validated in the natural period before quantifying the effects of climate change and human activity.
5.3.1 SWAT model calibration and validation
Sensitivity analysis was performed using SWAT-CUP software, and 20 sensitive parameters were identified, then initial and calibrated parameter ranges were estimated. Results showed that CN2 was the most sensitive parameter in all stations ().
Table 3. Initial and final intervals of sensitive parameters ofthe SWAT model before and after calibration for the three hydrometric stations in Zayandehrud Dam upstream
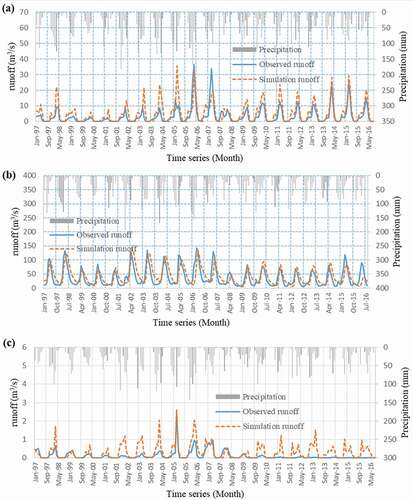
The calibrated results showed that Eskandari and Ghale-Shahrokh stations had NS = 0.78 and R2 = 0.79 (). However, in Manderjan (NS = 0.54 and R2 = 0.6), due to low flows causing a lack of accuracy, the results were not as satisfying as the others. Model validation results () indicated acceptable model performance. show the best time series of simulated runoff per SWAT model, observational runoff, and monthly average precipitation during the calibration and validation periods. As time passes and exceeds the change point, the distance between simulated runoff peaks and the observational runoff increases, showing that the significance of investigating the impacts of climate change and human activity on the variation in runoff is much more important.
Table 4. Calibration and validation results of the SWAT model for Zayandehrud Dam upstream stations
Figure 9. Time series of observed runoff, best runoff simulated by the SWAT model, and total monthly precipitation in the natural period with three years of warm-up (1983–1995) at three stations upstream of Zayandehrud Dam: (a) Eskandari station; (b) Ghale-Shahrokh station; (c) Manderjan station
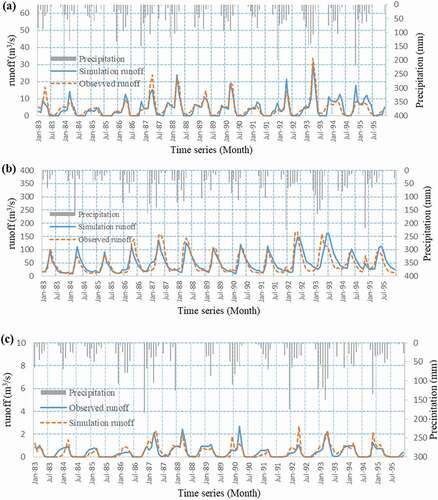
Figure 10. Time series of observed runoff, best runoff simulated by the SWAT model, and total monthly precipitation in the impact period (1997–2016) at three stations upstream of Zayandehrud Dam: (a) Eskandari station; (b) Ghale-Shahrokh station; (c) Manderjan station
5.3.2 LS-SVM model training and validation
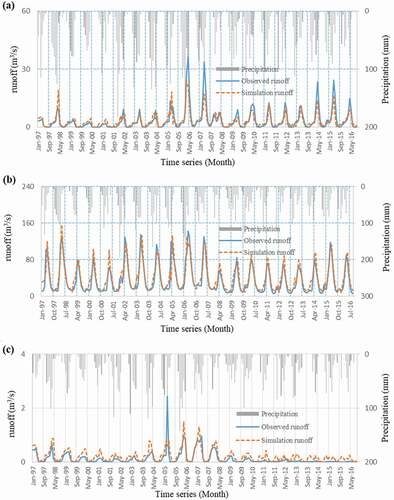
The validation of the LS-SVM model resulted in R2 > 0.7 for all stations (). This demonstrates a good model performance. The model was able to properly simulate the runoff in all stations (). Furthermore, a comparison of runoff with cumulative precipitation shows that runoff correlates with total rainfall with a delay of one or two months.
Table 5. Training and validation results of LS-SVM model for Zayandehrud Dam upstream stations
Figure 11. Time series of observed runoff, runoff simulated by LS-SVM model, and total monthly precipitation in the natural period (1980–1995) at three stations upstream of Zayandehrud Dam: (a) Eskandari station; (b) Ghale-Shahrokh station; (c) Manderjan station
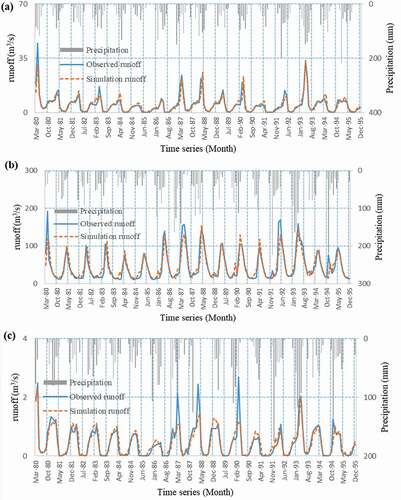
Figure 12. Time series of observed runoff, runoff simulated by LS-SVM model, and total monthly precipitation in the impact period (1997–2016) at three stations upstream of Zayandehrud Dam: (a) Eskandari station; (b) Ghale-Shahrokh station; (c) Manderjan station
5.4 Differentiating effects of climate change and human activity on streamflow
5.4.1 Climate elasticity method
The impact period runoff (ΔQtotal) was decreased by 580.8, 3249.7, and 124.4 () compared to the natural period in Eskandari, Ghale-Shahrokh, and Manderjan stations, respectively. Precipitation (
) in Eskandari and Manderjan decreased by 11.8 and 35.5 (
), respectively but it increased to 24.6 (
) for Ghale-Shahrokh, although potential evapotranspiration (
) in all stations increased, by 26, 68.4, and 55 (
), respectively (). To separate the effects of climate change and human activity on runoff variation using the climate elasticity method, first, the elasticity coefficients of precipitation (εp) and potential evapotranspiration (εPET) were calculated ().
Table 6. Climate change and human activity effects on declining runoff in the studied area as determined by the climate elasticity method
Figure 13. Estimation of precipitation elasticity (εP) and potential evapotranspiration elasticity (εPET) according to relevant alteration in runoff (), precipitation (
), and potential evapotranspiration (
) at three stations upstream of Zayandehrud Dam: (a) Eskandari station; (b) Ghale-Shahrokh station; (c) Manderjan station
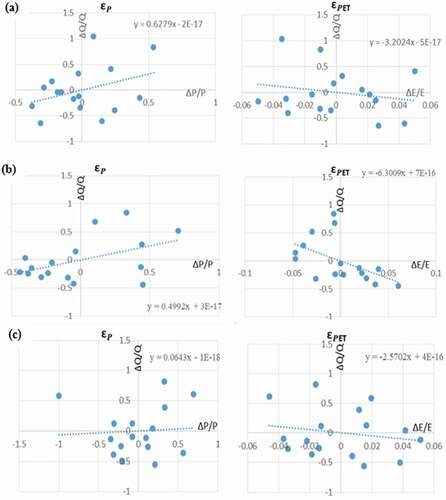
The precipitation elasticity coefficients were positive for all stations and highest in Eskandari (0.63), while the potential evapotranspiration elasticity coefficient was negative and had the greatest effect on runoff reduction at Ghale-Shahrokh station (−6.3). Human activities (ΔQH) were the more influential factor in reducing runoff in Eskandari (77.6%) and Manderjan (87.3%) stations; however, the more significant factor in Ghale-Shahrokh was climate change (ΔQC = 73.9%) ().
5.4.2 Rainfall–runoff model method
The weighted average coefficient of each station gives an accurate impression of the rainfall–runoff for the entire basin (). The coefficients are calculated based on the observational runoff averages of each station. In each method, a single value was obtained for climate change and human activity contributions in the study area. The results showed that climate change (37.87–66.67%) and human activity (33.33–62.13%) effectively reduce runoff according to all three methods.
Table 7. Climate change and human activity effects on Zayandehrud Dam upstream stations runoff as determined by three different methods
Results show that human activities contribute more to runoff reduction than climate change does in Eskandari (67.70–84%) and Manderjan (51–87.30%) stations. However, in Ghale-Shahrokh, climate change had a more significant impact. Because the ratio of area under cultivation to total sub-basin area for the Eskandari station is far higher than at the Ghale-Shahrokh and Manderjan stations, land-use changes are more influential to the discharge at the Eskandari station than at the other two stations.
5.5 Effects of management scenarios in decreasing the impacts of human activity and climate change on runoff reduction
All three management scenarios () show increases in the annual discharge relative to the existing condition, but scenario (I) has the highest increase of the three stations. The application of management scenarios while increasing annual river discharge reduced the gross water requirement. The scenarios, particularly in Eskandari Station, significantly impacted the gross water requirement, decreasing it from 306.97 MCM per year to 193.02, 274, and 246.78 MCM per year for Scenarios (I), (II), and (III), respectively ().
Table 8. Management scenario results for mitigating climate change and human activity effects on runoff reduction
Figure 14. Runoff time series for three stations upstream of Zayandehrud Dam before and after the application of three management scenarios using the SWAT model: (a) Eskandari station; (b) Ghale-Shahrokh station; (c) Manderjan station
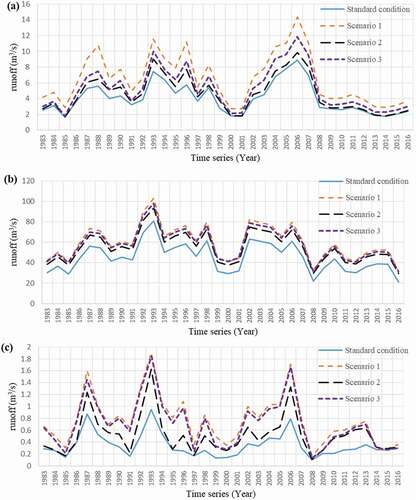
The SWAT model also showed that scenario (I) was the most effective management strategy in reducing the effect of human activity on runoff reduction in several sub-basins. However, this model revealed that the impact of human activity on runoff could also be substantially reduced by increasing the irrigation efficiency (without any change in crop pattern). Specifically, scenarios (I, II) increased the runoff to Eskandari station by 38.28% and 11.62%, respectively; however, scenario (III) increased it by 20.7% without changing the cropping pattern, merely by increasing irrigation efficiency ().
6 Discussion
6.1 Uncertainty in hydrological simulation
The uncertainty in this study arises from several sources. Firstly, uncertainty arises from the input data such as precipitation, temperature, runoff, land use, and soil. A second source of uncertainty is the insufficient number of stations and their distributions at the basin level. Thirdly, the models’ calibration period is too short to analyse the basin behaviour adequately. Furthermore, Zayandehrud contains three water transfer tunnels, which makes it a complex basin to model. However, the most critical case of uncertainty is regarding the primary assumption in this study, where, in contrast to real situations, it is assumed that the effects of human activity and climate change on runoff variation are independent of each other.
6.2 Impacts of climate change and human activity on runoff variation
The significant trend in the decreasing flow represents the effects of climate change and human activity on runoff reduction (). shows that human activities significantly reduce runoff in all three hydrometric stations, particularly Eskandari. Our assessment of runoff decline concluded that human activity was the leading contributing factor, consistent with most previous studies, including Chu et al. (Citation2019) and Wang et al. (Citation2019). The contribution of human activity to runoff reduction at Eskandari and Manderjan stations was greater than that at Ghale-Shahrokh. shows a significant increase in the agricultural area of Eskandari and Manderjan stations upstream of the dam, which significantly contributes to runoff decrease. However, the mountainous area made it difficult to increase the area under cultivation upstream of the Ghale-Shahrokh Station, so this was not substantially different between 1982 and 2015.
The contribution of climate change was as significant as that of human activities, similar to the study of Farsi and Mahjouri (Citation2019), who found an impact of human activity on runoff reduction in Zayandehrud. Among the most important human factors in runoff reduction, excessive increase in cultivation area is number one. indicates that the area under cultivation had significantly increased in 2015 compared to 1982. According to satellite images, the area under cultivation in the area upstream of Zayandehrud Dam is currently about 65 000 hectares. The same data show that in 1982, the agricultural land upstream of Zayandehrud Dam covered less than 33 000 hectares, of which 31 000 hectares were in Isfahan province and 2000 in Chaharmahal-Bakhtiari province. The most critical point in these data is the conversion of rainfed farming to irrigated farming, primarily orchards, which have played an important role in water consumption for this area. The intensive change of human activities is mainly represented by land-use changes, such as crop type, affecting the hydrological process (Woldesenbet et al. Citation2017). Human activity impacts on runoff can be reduced by utilizing crop pattern management. For example, replacing wheat and barley with other crops (sugar beet, alfalfa, and cucurbits) upstream of Eskandari, Ghale-Shahrokh, and Manderjan hydrometric stations increased the runoff by 38.28%, 25%, and 47%, respectively. Another issue in the application of management scenarios is the economy, which was not considered in this study. However, it should be noted that by increasing irrigation efficiency alone, without any changes in the cropping pattern of the area, the runoff could be increased by up to 20.70%, 23.23%, and 42.85%, respectively, in the three stations.
7 Conclusion and summary
Given the increasing global water scarcity threat, differentiating contributions of climate change from human activity to changes in river runoff will help planners and policymakers make better decisions on water resource management. This study investigated the contributions of climate change and human activity to changes in the runoff flowing into Zayandehrud Dam during 1980–2016. The Mann-Kendall trend test revealed the existence of a significant negative trend in these runoff inflows. The Pettitt test identified the change point for a time series of this study as 1996. Therefore, the runoff data were divided into two periods, before (1980–1995) and after (1997–2016) the change point. In this study, precipitation elasticity was significantly different from the potential evapotranspiration, showing the more significant effect of global warming on runoff reduction.
Knowing the contribution of each runoff reduction factor is the most important tool for managers in applying management scenarios, especially in challenging and complex watersheds. The area upstream of Zayandehrud Dam is shared between two provinces with disagreements on the causes of runoff reduction. In these circumstances, quantifying impacts of climate change and human activity is vital in helping managers make proper decisions. Furthermore, to provide a range of possibilities instead of single ones, we employed three methods – climate elasticity, LS-SVM, and SWAT models – to analyse the effects of climate change and human activity on runoff. The results of all methods illustrated that both climate change (37.87–66.67%) and human activities (33.33–62.13%) influenced the runoff reduction.
Three management scenarios were applied to decrease climate change and human activity impacts on runoff. This procedure could be helpful in the majority of arid and semi-arid catchments. The effects of the three management scenarios on runoff were also examined in this study. Results showed that all scenarios increased the input runoff to Zayandehrud Dam upstream stations. It was concluded that adjusting wheat and barley cultivation levels alone represented the highest discharge increase change percentiles in Eskandari (38.28%), Ghale-Shahrokh (25%), and Manderjan (47%).
Although a watershed in central Iran was considered as a case study here, this approach can be applied to other basins, especially arid and semi-arid basins facing water-demand challenges to differentiate effects of climate change and human activity on runoff reduction and to assess the aforementioned scenarios based on the proposed methodology. Despite existing complexities, this methodology can be used for catchments and can be considered for larger case studies.
Disclosure statement
No potential conflict of interest was reported by the author(s).
References
- Abbaspour, K.C., et al., 2007. Modelling hydrology and water quality in the pre-alpine/alpine Thur watershed using SWAT. Journal of Hydrology, 333 (2–4), 413–430. doi:https://doi.org/10.1016/j.jhydrol.2006.09.014.
- Abbaspour, K.C., 2007. User manual for SWAT-CUP, SWAT calibration and uncertainty analysis programs. Vol. 93, Eawag, Duebendorf, Switzerland: Swiss Federal Institute of Aquatic Science and Technology.
- Abbaspour, K.C., Johnson, C.A., and Van Genuchten, M.T., 2004. Estimating uncertain flow and transport parameters using a sequential uncertainty fitting procedure. Vadose Zone Journal, 3 (4), 1340–1352. doi:https://doi.org/10.2136/vzj2004.1340.
- Adnan, R.M., et al., 2020. Least square support vector machine and multivariate adaptive regression splines for streamflow prediction in mountainous basin using hydro-meteorological data as inputs. Journal of Hydrology, 586, 124371. doi:https://doi.org/10.1016/j.jhydrol.2019.124371
- Ahn, K.H. and Merwade, V., 2014. Quantifying the relative impact of climate and human activities on streamflow. Journal of Hydrology, 515, 257–266. doi:https://doi.org/10.1016/j.jhydrol.2014.04.062
- Arnold, J.G., et al., 2012. SWAT: model use, calibration, and validation. Transactions of the ASABE, 55 (4), 1491–1508. doi:https://doi.org/10.13031/2013.42256.
- Beniston, M., ed., 2002. Climatic change: implications for the hydrological cycle and for water management. Dordrecht: Springer Science & Business Media. doi:https://doi.org/10.1007/0-306-47983-4.
- Beven, K., 1997. TOPMODEL: a critique. Hydrological Processes, 11 (9), 1069–1085. doi:https://doi.org/10.1002/(SICI)1099-1085(199707)11:9<1069::AID-HYP545>3.0.CO;2-O.
- Chang, J., et al., 2016. Assessing the impact of climate variability and human activities on streamflow variation. Hydrology and Earth System Sciences, 20 (4), 1547. doi:https://doi.org/10.5194/hess-20-1547-2016.
- Chu, H., et al., 2019. Identification of the impact of climate change and human activities on rainfall–runoff relationship variation in the Three-River Headwaters region. Ecological Indicators, 106, 105516. doi:https://doi.org/10.1016/j.ecolind.2019.105516
- Cortes, C. and Vapnik, V., 1995. Support-vector networks. Machine Learning, 20 (3), 273–297. doi:https://doi.org/10.1007/BF00994018.
- De Brabanter, J., et al., 2002. Least squares support vector machines. K U Leuven, Belgium: World Scientific. doi:https://doi.org/10.1142/5089.
- Dey, P. and Mishra, A., 2017. Separating the impacts of climate change and human activities on streamflow: a review of methodologies and critical assumptions. Journal of Hydrology, 548, 278–290. doi:https://doi.org/10.1016/j.jhydrol.2017.03.014
- Farsi, N. and Mahjouri, N., 2019. Evaluating the contribution of the climate change and human activities to runoff change under uncertainty. Journal of Hydrology, 574, 872–891. doi:https://doi.org/10.1016/j.jhydrol.2019.04.028
- Fu, G., Charles, S.P., and Chiew, F.H., 2007. A two-parameter climate elasticity of streamflow index to assess climate change effects on annual streamflow. Water Resources Research, 43 (11), 11. doi:https://doi.org/10.1029/2007WR005890.
- Fukunaga, D.C., et al., 2015. Application of the SWAT hydrologic model to a tropical watershed at Brazil. Catena, 125, 206–213. doi:https://doi.org/10.1016/j.catena.2014.10.032
- Han, Z., et al., 2019. Impacts of climate change and human activities on the flow regime of the dammed Lancang River in Southwest China. Journal of Hydrology, 570, 96–105. doi:https://doi.org/10.1016/j.jhydrol.2018.12.048
- He, Y., et al., 2019. Quantitative contribution of climate change and human activities to runoff changes in the Bahe River watershed of the Qinling Mountains, China. Sustainable Cities and Society, 51, 101729. doi:https://doi.org/10.1016/j.scs.2019.101729
- Hu, S., et al., 2012. Assessing the impacts of climate variability and human activities on streamflow in the water source area of Baiyangdian Lake. Journal of Geographical Sciences, 22 (5), 895–905. doi:https://doi.org/10.1007/s11442-012-0971-9.
- Isfahan Regional Water Authority (IRWA), 2020. National program of water shortage adaption. Isfahan, Iran: Ministry of Energy.
- Jiang, S., et al., 2011. Quantifying the effects of climate variability and human activities on runoff from the Laohahe basin in northern China using three different methods. Hydrological Processes, 25 (16), 2492–2505. doi:https://doi.org/10.1002/hyp.8002.
- Kendall, M.G., 1938. A new measure of rank correlation. Biometrika, 30 (1/2), 81–93. doi:https://doi.org/10.2307/2332226.
- Kendall, M.G., 1975. Rank correlation methods. 2nd. London and High Wycombe: Charles Griffin and Company Ltd.
- Khatri, N. and Tyagi, S., 2015. Influences of natural and anthropogenic factors on surface and groundwater quality in rural and urban areas. Frontiers in Life Science, 8 (1), 23–39. doi:https://doi.org/10.1080/21553769.2014.933716.
- Lee, C.H. and Yeh, H.F., 2019. Impact of climate change and human activities on streamflow variations based on the Budyko framework. Water, 11 (10), 2001. doi:https://doi.org/10.3390/w11102001.
- Liu, Y., et al., 2019. Combined effect of climate change and human activities on the hydrological processes of an urban river: case study of the Xiaoqing River, China. Hydrological Sciences Journal, 64 (16), 2105–2114. doi:https://doi.org/10.1080/02626667.2019.1618463.
- Madani, K. and Mariño, M.A., 2009. System dynamics analysis for managing Iran’s Zayandeh-Rud river basin. Water Resources Management, 23 (11), 2163–2187. doi:https://doi.org/10.1007/s11269-008-9376-z.
- Mann, H.B., 1945. Nonparametric tests against trend. Econometrica, 13 (3), 245–259. doi:https://doi.org/10.2307/1907187.
- Mu, X., et al., 2020. Streamflow into Beijing and its response to climate change and human activities over the period 1956–2016. Water, 12 (3), 622. doi:https://doi.org/10.3390/w12030622.
- Neitsch, S.L., et al., 2011. Soil and water assessment tool theoretical documentation version 2009. Texas: Texas Water Resources Institute. http://hdl.handle.net/1969.1/128050
- Nourani, V., Andalib, G., and Sadikoglu, F., 2017. Multi-station streamflow forecasting using wavelet denoising and artificial intelligence models. Procedia Computer Science, 120, 617–624. doi:https://doi.org/10.1016/j.procs.2017.11.287
- Pettitt, A.N., 1979. A non-parametric approach to the change-point problem. Applied Statistics, 28 (2), 126–135. doi:https://doi.org/10.2307/2346729.
- Rostamian, R., et al., 2008. Application of a SWAT model for estimating runoff and sediment in two mountainous basins in central Iran. Hydrological Sciences Journal, 53 (5), 977–988. doi:https://doi.org/10.1623/hysj.53.5.977.
- Rouholahnejad Freund, E., Abbaspour, K.C., and Lehmann, A., 2017. Water resources of the Black Sea catchment under future climate and landuse change projections. Water, 9 (8), 598. doi:https://doi.org/10.3390/w9080598.
- Sadler, J.M., et al., 2018. Modelling urban coastal flood severity from crowd-sourced flood reports using Poisson regression and Random Forest. Journal of Hydrology, 559, 43–55. doi:https://doi.org/10.1016/j.jhydrol.2018.01.044
- Sankarasubramanian, A. and Vogel, R.M., 2003. Hydroclimatology of the continental United States. Geophysical Research Letters, 30 (7). doi:https://doi.org/10.1029/2002GL015937.
- Sayedipour, M., Ostad-Ali-Askari, K., and Shayannejad, M., 2015. Recovery of run off of the sewage refinery, a factor for balancing the Isfahan-Borkhar plain water table in drought crisis situation in Isfahan Province-Iran. American Journal of Environmental Engineering, 5 (2), 43–46. doi:https://doi.org/10.5923/j.ajee.20150502.02.
- Schuol, J., et al., 2008. Estimation of freshwater availability in the West African sub-continent using the SWAT hydrologic model. Journal of Hydrology, 352 (1–2), 30–49. doi:https://doi.org/10.1016/j.jhydrol.2007.12.025.
- Suykens, J.A., et al., 2002. Weighted least squares support vector machines: robustness and sparse approximation. Neurocomputing, 48 (1–4), 85–105. doi:https://doi.org/10.1016/S0925-2312(01)00644-0.
- Suykens, J.A. and Vandewalle, J., 1999. Least squares support vector machine classifiers. Neural Processing Letters, 9 (3), 293–300. doi:https://doi.org/10.1023/a:1018628609742.
- Wang, X., He, K., and Dong, Z., 2019. Effects of climate change and human activities on runoff in the Beichuan River Basin in the northeastern Tibetan Plateau, China. Catena, 176, 81–93. doi:https://doi.org/10.1016/j.catena.2019.01.001
- Wei, X., and Liu, W., and Zhou, P., 2013, December. Quantifying the relative contributions of forest change and climatic variability to hydrology in large watersheds: a critical review of research methods. In. Water, 5(2), 728–746 . doi:https://doi.org/10.3390/w5020728
- Woldesenbet, T.A., et al., 2017. Hydrological responses to land use/cover changes in the source region of the Upper Blue Nile Basin, Ethiopia. Science of the Total Environment, 575, 724–741. doi:https://doi.org/10.1016/j.scitotenv.2016.09.124
- Xin, Z., et al., 2019. Quantifying the relative contribution of climate and human impacts on seasonal streamflow. Journal of Hydrology, 574, 936–945. doi:https://doi.org/10.1016/j.jhydrol.2019.04.095
- Yan, X., et al., 2020. Quantifying contributions of climate change and local human activities to runoff decline in the upper reaches of the Luanhe River basin. Journal of Hydro-environment Research, 28, 67–74. doi:https://doi.org/10.1016/j.jher.2018.11.002
- Yang, Y., et al., 2020. Analyzing the contributions of climate change and human activities on runoff in the Northeast Tibet Plateau. Journal of Hydrology: Regional Studies, 27, 100639. doi:https://doi.org/10.1016/j.ejrh.2019.100639
- Zhang, H., et al., 2020. Comprehensive evaluation of the effects of climate change and land use and land cover change variables on runoff and sediment discharge. Science of the Total Environment, 702, 134401. doi:https://doi.org/10.1016/j.scitotenv.2019.134401
- Zheng, H., et al., 2009. Responses of streamflow to climate and land surface change in the headwaters of the Yellow River Basin. Water Resources Research, 45 (7). doi:https://doi.org/10.1029/2007WR006665.