?Mathematical formulae have been encoded as MathML and are displayed in this HTML version using MathJax in order to improve their display. Uncheck the box to turn MathJax off. This feature requires Javascript. Click on a formula to zoom.
ABSTRACT
Climate change is likely to have a major impact on future hydrological regimes, impacting numerous sectors reliant on surface waters. We use the Soil and Water Assessment Tool (SWAT) to model future (2021–2080) streamflow and water quality variables (nitrogen, phosphorus, suspended sediment, and dissolved oxygen), in five catchments in Wales, under a worst-case scenario of future greenhouse gas concentrations (Representative Concentration Pathway 8.5). Results show a decline in annual average flows (−4% to −13%) but larger changes seasonally (spring, up to 41% increase; autumn, up to 52% reduction). The magnitude and frequency of high flow events increasesg in spring (magnitude: Sen’s slope range 0.165–0.589, p < .01), with more low flows in autumn (Sen’s slope range 0.064–0.090, p < .01). Water quality declines, with higher nitrogen, phosphorus, and sediment concentrations and lower dissolved oxygen levels. The findings have economic and environmental implications for abstractors, as water resources could become more unreliable, seasonal, and polluted.
Editor S. Archfield Associate editor M. Batalini de Macedo
1 Introduction
Globally, river catchments are likely to face significant changes due to a variety of factors, including climate change, land use/land cover change, increased population and urbanization, and greater demand for water (Rockström et al. Citation2009, Gleick and Palaniappan Citation2010, Heathwaite Citation2010, Cosgrove and Loucks Citation2015, Bijl et al. Citation2016). The Intergovernmental Panel on Climate Change (IPCC), in their Fifth Assessment Report (AR5), project a rise in both surface temperatures and the number and intensity of extreme precipitation events under all future greenhouse gas emissions scenarios throughout the 21st century (IPCC Citation2014). For the UK, a small increase is projected in average precipitation by 2100, compared to the 1986–2005 baseline; average temperatures are also expected to increase (IPCC Citation2014). Furthermore, the UK Climate Projections 2018 (UKCP18) Science Overview Report suggests a move towards warmer, wetter winters, and hotter, drier summers, as well as an increase in extreme weather events (Lowe et al. Citation2018). These changes will have implications for catchments in terms of annual and seasonal average flows, high and low flows, and water quality.
Several studies have analysed future seasonal and annual average streamflows for the UK, mostly using UK Climate Projections data (UKCIP02, UKCP09, and UKCP18). While less work has thus far been published using the new UKCP18 data, Kay et al. (Citation2020) compared estimates of change under both the new and previous (UKCP09) projections and found the results to be similar, but with higher uncertainty in the most recent version. A study using UKCP09 data by Watts et al. (Citation2015) suggests that precipitation increases in winter are likely to be greatest along the western coast of the UK, while the largest summer decreases in precipitation are expected in southern England, with little change in the annual average. Investigating the impact of these changes on river flows in the short and long term respectively, Christierson et al. (Citation2012) and Prudhomme et al. (Citation2012) both projected annual averages flows to remain relatively stable. Both studies also project a reduction in spring flows, with a small increase in the winter. However, the most consistent trend seen is a decrease in summer flows across the UK, especially in the north and west (Christierson et al. Citation2012, Prudhomme et al. Citation2012). These results are consistent with the findings of Chun et al. (Citation2009) and Charlton and Arnell (Citation2014) which both predict that while UK annual average streamflows will decline, the magnitude of change will be less than that seen seasonally. For Wales specifically, the results of these UK-wide studies, in terms of seasonal streamflow changes, are consistent with the projections of Afzal et al. (Citation2021), for the Ebbw catchment in south Wales.
For extreme streamflow events in the UK (large discharge events/flooding and long-term drought), it is likely that climate change will alter their frequency, duration, and severity (IPCC Citation2014, Watts et al. Citation2015, Sayers et al. Citation2016, Miller and Hutchins Citation2017, Lane and Kay Citation2021). Extreme streamflow changes are mainly driven by changes in precipitation regime. For example, Hanlon et al. (Citation2021) link future daily rainfall levels, using UKCP18 projections, to increasing numbers of flood days, as well as increasing drought severity, by the 2080s under low and high future emissions scenarios. Rau et al. (Citation2020) found that extreme hourly precipitation is set to increase under a high future emission scenario, especially in the long term (2070–2100), by up to 112% in some areas. Collet et al. (Citation2018) demonstrated, using the future flows hydrology database (Prudhomme et al. Citation2013), that for western areas of Britain especially, an increase in the frequency, duration, and magnitude of future flood events is likely when comparing the period 1961–1990 to 2069–2098. A large, but less likely, increase in the duration and magnitude of droughts is also shown (Collet et al. Citation2018). Similarly, Charlton and Arnell (Citation2014) showed an increase in high flows and decrease in low flows in six study catchments using the UKCP09 data. These changes were particularly linked to changes in winter precipitation for high flows, and summer temperature and precipitation for low flows (Charlton and Arnell Citation2014). Using UKCP09 data, Afzal et al. (Citation2021) also demonstrate an increase in the frequency and severity of drought events under future medium- and high-emission scenarios.
The aforementioned projections for alterations in streamflows will likely often have a deleterious impact on water quality, although the magnitude of these changes will depend on individual catchment characteristics. Whitehead et al. (Citation2009a), for example, showed that patterns in future water quality varied greatly across six UK catchments based on the geology, topography, urbanization, agricultural land use, and point source inputs of each catchment. Furthermore, within-catchment variation was also demonstrated, with the River Tweed showing a trend of decreasing nitrate levels in the upland headwaters in summer, but increasing levels in the lower reaches (Whitehead et al. Citation2009a). A further study by Whitehead et al. (Citation2009b) discussed the future drivers of water quality changes, including variations in streamflow regime as well as water temperature alterations. These changes influence stream power, and therefore the erosion and transport of sediment, as well as the dilution and movement of pollutants; instream chemical process rates are also affected by water temperature changes.
Delpla et al. (Citation2009) found that increases in the magnitude of rain events, as well as changing drought–rewetting cycles, are likely to increase the amount of organic matter reaching streams. These findings correspond with those of Ockenden et al. (Citation2017), who showed a positive trend between total phosphorus load and annual rainfall, and with those of Ponting et al. (Citation2021) in relation to increased organic and inorganic matter reaching rivers through flood events. Mortazavi‐Naeini et al. (Citation2019) demonstrated a positive relationship between suspended sediment concentrations and extreme winter floods, as well as an increase in total phosphorus levels during low-flow events. Finally, Watts and Anderson (Citation2016) suggest that generally lower summer flow will increase the likelihood of algal blooms and lower dissolved oxygen levels, while subsequent summer flood events will increase the wash of pollutants such as nutrients into river systems.
This work aims, via hydrological modelling, to investigate alterations to streamflow and water quality brought about by climate change in five catchments in Wales, UK. This is arguably an understudied region of the UK in this context, especially when compared to drier regions, such as southeast England. It is a key area to study, however, due to the importance of the river networks to the region. An obvious example of this is public water supply, 95% of which is taken from surface water sources, with some zones already seeing a seasonal deficit (DCWW Citation2019a). Furthermore, Wales exports large quantities of water to metropolitan areas in central and northern England (Warren and Holman Citation2012, DCWW Citation2016), meaning that alterations in future flow regime could have impacts beyond the country’s borders. In addition, understanding future flow characteristics is important to sectors such as hydroelectricity generation, especially small run-of-river schemes, which are abundant, and growing, in Wales. Over 360 hydroelectric projects operate on rivers in Wales, ranging from small (<1 MW) to large (>70 MW), with a total estimated generation of 389 GWh, accounting for approximately 1.3% of total electricity generation in the country in 2018, and 5.2% of renewable electricity generation (Welsh Government Citation2019). Although this is a small proportion of overall generation, it is increasing, especially with growing numbers of small-scale development, and equates to enough power for the equivalent of over 100 000 households (Welsh Government Citation2019). Surface waters are also an important part of the tourism economy, with 96 million day visits to Wales in 2018 (Welsh Government Citation2020); many are attracted to the region for its natural beauty, and often visit rivers, lakes and coast. The industry contributed over £3 billion to the Welsh economy in terms of gross value added in 2016 (Welsh Government Citation2020), therefore understanding how changes to the natural landscape and resources of the region will impact on tourist appeal is crucial. Finally, any changes in flow characteristics or water quality could have important implications for river ecology and aquatic life in both rivers and coastal waters. A better understanding of potential future changes will aid with designing suitable mitigation measures.
2 Data and methods
2.1 Study catchments
Our study focusses on five catchments in Wales: the Clwyd, Conwy, Dyfi, Teifi, and Tywi (). These catchments have been selected for study due to the variety of different characteristics they display, in terms of factors such as topography (), land use/land cover (LULC), and soil types (). These are also among the largest catchments contained, source to sink, entirely within Wales; key details relating to the characteristics of each catchment are provided in . In addition, the catchments are important economically, socially, and environmentally, in line with the reasons for selecting Wales as a study region. For example, they directly contribute to the water supplies of over 975 000 people (derived from DCWW Citation2019b), as well as over 70 run-of-river hydroelectricity scheme abstractions (derived from NRW Citation2019a). From an environmental perspective, they include various land protections and designations, such as national parks, sites of special scientific interest, national nature reserves, and special areas of conservation. Finally, the catchments also flow into waters that are spawning and/or nursery grounds for a variety of fish species such as cod, sole, plaice, spotted ray, and sandeel (Ellis et al. Citation2012).
Table 1. Key study catchment details; catchment area is area modelled in the Soil and Water Assessment Tool (SWAT). Elevation data derived from 5 m resolution OS Terrain 5 digital elevation model from Ordnance Survey; land use/land cover data derived from 2012 CORINE Land Cover data (EEA Citation2012)
Figure 1. Study catchments as delineated in the Soil and Water Assessment Tool (SWAT). (a) Streams and stream orders (derived by Strahler method), streamflow gauging stations (blue X) and water quality monitoring locations (orange +). (b) Catchment elevation and streams (third order and larger).
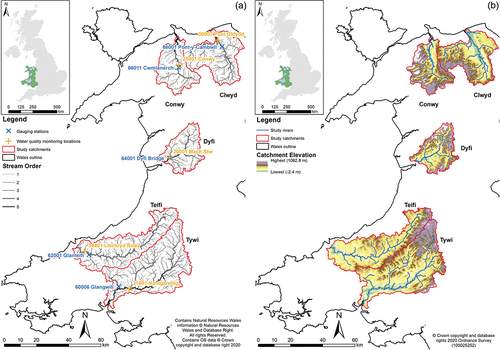
Figure 2. (a) Catchment land use/land cover categorization derived from CORINE Land Cover data (EEA Citation2012). (b) Catchment soil classification derived from the EU soil database (European Commission Citation2004).
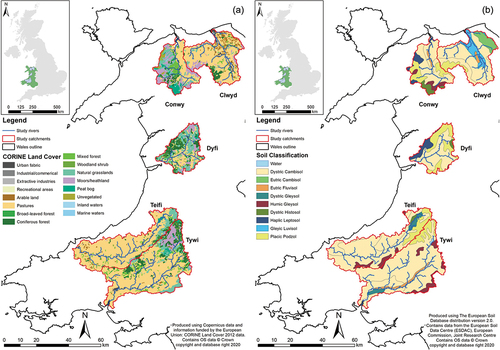
The catchments range in size from Dyfi at 507 km2 to Tywi at over two and half times larger (1365 km2). In terms of LULC, agriculture and scrubland are the two main land cover types across the five catchments, with Clwyd, Teifi, and Tywi being heavily agriculture-based (83% to 65%), and Conwy and Dyfi having higher proportions of scrubland (42% and 45%, respectively) such as natural grasslands, moors and heathlands. Most of the agricultural land in all the catchments is pasture used for grazing sheep and cattle, with Clwyd having the highest proportion used for growing crops. Urban areas account for little land area in all catchments, tending to be located in the coastal regions. Forested land is the third largest land cover in all catchments, with this mostly being coniferous and often located in mid to high elevations. In terms of underlying soil classification, the vast majority in all catchments is young Cambisol (brown soil), while Podzols are most commonly found in higher altitude areas.
2.2 Future climate change data
UKCP18 data were used as future weather input for hydrological modelling, specifically the “Regional Projections on a 12 km grid over the UK for 1980–2080” dataset (MOHC Citation2018). UKCP18 data was selected for use as the latest and most comprehensive projections for the UK. The regional projections in particular were chosen as the dataset with the finest spatial scale, at the time of implementation into the Soil and Water Assessment Tool (SWAT), which takes account of regional-scale landscape features, allowing for a local-level analysis. This 12 km gridded version of the dataset provides an ensemble of 12 regional climate model (RCM) projections derived, and dynamically downscaled, from 12 of the 15 members of the 60 km HadGEM3-GC3.05 global coupled model (GCM) perturbed parameter ensemble (Murphy et al. Citation2018). The climate projections are based on a scenario of no downturn in global greenhouse gas emissions, using Representative Concentration Pathway 8.5 (RCP8.5), therefore taking a worst-case scenario approach in a similar vein to studies such as Ficklin and Barnhart (Citation2014) and Lee et al. (Citation2018). Uncertainty in the GCM perturbed parameter ensemble members, as well as natural climate variability between the members (being based on a range of plausible climate storylines), causes the 12 RCM ensemble member outputs to differ when downscaled (Kendon et al. Citation2019). For greater detail on the UKCP18 data used in this study, we direct the reader to Murphy et al. (Citation2018) for a comprehensive overview. The 12 km gridded UKCP18 data were extracted to a single point at the centre of each grid square, and these points were treated as pseudo-meteorological stations. Out of the 28 total grid squares whose centre point lies within one of the five catchments, 13 were selected as pseudo-meteorological stations ().
Figure 3. Pseudo-meteorological stations used in the Soil and Water Assessment Tool (SWAT)future weather input, labelled with station name and elevation.
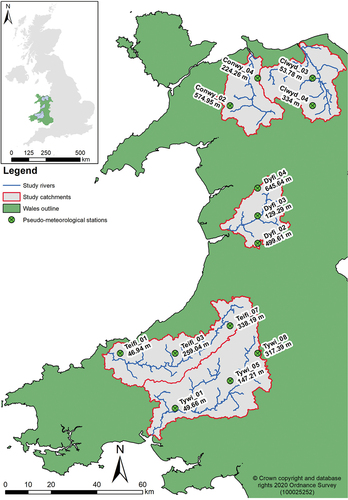
These selections were made to ensure good coverage across all catchments, considering the potential changes in precipitation and temperature based on elevation, and to manage the computational resource limitations in the process of extracting grid values to the point locations. In addition, to provide the best level of coverage using the fewest stations, in neighbouring catchments (Clwyd and Conwy; Teifi and Tywi) all pseudo-meteorological stations in both catchments were made available as inputs to each individual catchment model, to efficiently provide additional weather data.
2.3 Hydrological modelling
In this study, we have used SWAT 2012 revision 670, a quasi-physically based, semi-distributed hydrological model developed by the US Department of Agriculture’s Agricultural Research Service (Arnold et al. Citation1998). When selecting a hydrological model, several factors were taken into consideration. First, due to the size of the catchments to be studied, it was decided that a semi-distributed model was required, balancing greater computational efficiency with maintained representation of catchment characteristics (Suliman et al. Citation2015). Second, the model needed to be operable at a continuous daily time step in order to make use of the future climate input data, as well as to enable analysis of extreme streamflows and events. It was also important for the model to be physically based, with both land and in-stream processes being modelled, and the ability to handle both water quantity and quality data. Several well-established hydrological models were considered, including, but not limited to, the Agricultural Policy / Environmental eXtender (APEX) model (Williams and Izaurralde Citation2010), MIKE-SHE (Refsgaard and Storm Citation1995), SWAT (Arnold et al. Citation1998), TOPMODEL (Beven Citation1997), and the Variable Infiltration Capacity Model (VIC) (Liang et al. Citation1994). The decision was made to proceed with SWAT after a review of studies comparing the performance of different hydrological models (Yang et al. Citation2000, El-Nasr et al. Citation2005, Golmohammadi et al. Citation2014, Suliman et al. Citation2015, Kauffeldt et al. Citation2016), with SWAT performing favourably in these, especially for low flows which are important to the latter stages of the research, where future water availability is assessed.
SWAT has been used internationally and for a variety of purposes due to the wide range of catchment processes that the model considers (Gassman et al. Citation2014). In recent years, SWAT has been used for purposes such as ecological impact assessments (Chambers et al. Citation2017, Kakouei et al. Citation2018), crop/agricultural planning studies (Fereidoon and Koch Citation2018, Yang et al. Citation2018), hydropower assessment (Park and Kim Citation2014, Haguma et al. Citation2017, Abera et al. Citation2018, Dallison et al. Citation2021), and future flood flow characterization (Singh and Goyal Citation2017, Xu et al. Citation2019). The model has also been widely used for investigating changes in the quantity and timing of streamflows under climate change in a variety of catchment types; for example, Coffey et al. (Citation2016) for two catchments in Ireland, Perra et al. (Citation2018) for a Mediterranean catchment, Sultana and Choi (Citation2018) for a snow-dominated catchment in northern California, and Yuan et al. (Citation2019) for the Yangtze River in China. Water quality impacts under future climate change have also been studied using SWAT, with papers such as Nerantzaki et al. (Citation2016), Jilo et al. (Citation2019) and Hosseini and Khaleghi (Citation2020) studying sediment yield in catchments in Greece, Ethiopia, and Iran, respectively. In addition, Pesce et al. (Citation2018) investigated nitrogen, phosphorus and dissolved oxygen in a catchment in Italy, and Yang et al. (Citation2017) studied total nitrogen changes in a river in northeast China.
SWAT operates at a daily time step and is designed for river basin-scale use. Being semi-distributed, SWAT makes use of sub-basins, which are further divided into hydrological response units (HRUs) of areas with similar soil type, LULC and topography. The model is computationally efficient due to calculations being performed for each HRU and later summed together at sub-basin outlets (Bailey et al. Citation2016). Full and detailed information on the equations, inputs and processes that govern the behaviour of the model, as well as the outputs, are provided in the SWAT theoretical documentation (Neitsch et al. Citation2011) and the input/output documentation (Arnold et al. Citation2012).
Here, SWAT has been used to simulate daily streamflow and four water quality parameters, total nitrogen (TN), total phosphorus (TP), suspended sediment (SS), and dissolved oxygen (DO). Each study catchment was set up, calibrated, validated, and run separately. The key inputs to the SWAT model are elevation, soil type, LULC, and weather data. The 5 m resolution OS Terrain 5 digital elevation model from Ordnance Survey (Citation2020) was used alongside soil data from the EU soil database version 2.0, specifically the 1:1 000 000 scale Soil Geographical Database of Eurasia (European Commission Citation2004). LULC input data were obtained from the CORINE Land Cover dataset (Copernicus Land Monitoring Data; EEA Citation2012), accurate spatially to within 25 m, with a minimum mapping unit of 25 ha for areal features and width of 100 m for linear features (EEA Citation2017). Historical daily observed air temperature and precipitation data were obtained from the Centre for Ecology and Hydrology (CEH)’s Climate, Hydrology and Ecology research Support System (CHESS) dataset (Robinson et al. Citation2017). Historical streamflow data were obtained from CEH’s National River Flow Archive dataset (NRFA Citation2020) for one gauging station in each catchment, with as close to the natural flow regime as possible (station details and locations shown in ). In terms of potential evapotranspiration (PET) calculation, this is inbuilt within SWAT and is based on the weather data provided, with the modeller having the choice of three calculation methods: Priestly-Taylor, Penman-Monteith, and Hargreaves. Given that the data required were available, the widely used Penman-Monteith method was implemented. This method was chosen as it is the sole standard method recommended by the Food and Agriculture Organization of the United Nations, due to its proven applicability to catchments of all types (Allen et al. Citation1998). In addition, Prudhomme and Williamson (Citation2013) also recommend the use of the Penman-Monteith method for PET estimation specifically for hydrological climate change impact analysis in Great Britain, such as that completed in this study. Furthermore, it is suitable for use at a daily time step, unlike the Hargreaves method, which Hargreaves and Allen (Citation2003) recommend using only time steps of five days or longer.
Calibration and validation were completed with the SWAT Calibration and Uncertainty Programme 2012 (SWAT-CUP), specifically using the particle swarm optimization (PSO) method (Kennedy and Eberhart Citation1995). The PSO method iteratively improves the model simulation proficiency, taking into consideration the previous best-known calibration point, and allows for a quicker and more efficient calibration process (Clerc and Kennedy Citation2002, Coello et al. Citation2004). SWAT was calibrated at each study catchment against observed daily average streamflow only. Calibration was undertaken for the period 1985 to 1998, with a three-year model warm-up period occurring beforehand, and 10 simulations with 10 iterations per simulation were completed for each catchment calibration. Kling-Gupta efficiency (KGE; EquationEquation (1)(1)
(1) ) was used as the goodness-of-fit metric for model calibration (Gupta et al. Citation2009):
where is the linear correlation between observations and simulations;
is the ratio between the standard deviation in the simulated flow and the standard deviation in the observed flow; and
is the ratio between the mean simulated and mean observed flow.
The calibrated SWAT model was then used for a validation run for the period 1999 to 2014, once again with a three-year warm-up period beforehand. Calibration and validation KGE values for each catchment are shown in , with a hydrograph of observed and simulated flow for the calibration and validation periods of each catchment shown in Figs S1 and S2, respectively, of the Supplementary material. A total of 17 parameters were used in the calibration; the details of these are provided in . These parameters were selected based on a combination of a literature review of studies of similar catchments (size, climate, and topography), after consultation with experienced SWAT modellers, and following a global sensitivity analysis. Groundwater parameters were found to be particularly sensitive across all catchments, but especially so in the Clwyd and Conwy, hence the abundance of groundwater-related parameters calibrated (). All 17 parameters were found to be sensitive (p < .05) in at least one of the five catchments.
Table 2. Number of hydrological response units (HRUs) and sub-basins per catchment model. The numbers of sub-basins containing gauging stations are also shown, along with Kling-Gupta efficiency (KGE) values for the calibration and validation periods
Table 3. SWAT parameters calibrated with the Soil and Water Assessment Tool Calibration and Uncertainty Program (SWAT-CUP) using the particle swarm optimization method
Due to the lack of sufficient historical sampling data, water quality parameters were not calibrated, with the default SWAT water quality parameters being used, after a review of their suitability for the study area. However, a validation of the water quality output was attempted, by comparing model output to the limited measured water quality data available from the Natural Resources Wales (NRW) water quality data archive (NRW Citation2019b). Sampled data from a single water quality monitoring location in each catchment was used for the validation; the locations of these are shown in . While the water quality validation showed a good degree of correlation for DO in most catchments, the correlations for the other factors were less agreeable (). The modelled TP, TN and SS output do all correlate well with modelled streamflow, however (), suggesting that this is the key driver of change in the uncalibrated model.
Table 4. Pearson’s correlation values between observed (where available) and modelled water quality concentrations. Underlined values indicate a correlation significant at p < .05; those shown in bold are significant at p < .01
Table 5. Pearson’s correlation values between modelled water quality concentrations and streamflow. Underlined values indicate a correlation significant at p < .05; those shown in bold are significant at p < .01
Future runs of the calibrated and validated SWAT model were completed for the hydrological years 2021 to 2080, where a hydrological year runs from 1 October to the following year’s 30 September and is named after the later year. Some discontinuity in the model output is caused by the need to run the models in sections due to database size restrictions on the output files. This was mitigated as far as possible by including a 7-year warm-up period at the start of all model run sections. To further mitigate disjointedness in model outputs, as few breaks as possible were used in each catchment, therefore smaller catchments are split into fewer, longer periods. In this way individual dataset continuity was prioritized above overall approach consistency. Model run sections were as follows – Conwy and Dyfi: 2020–2050, 2051–2080; Clwyd: 2020–2040, 2041–2060, 2061–2080; Teifi and Tywi: 2020–2035, 2036–2050, 2051–2065, 2066–2080. Each individual catchment model was run for each of the 12 RCM ensemble members; the mean of all 12 streamflow and water quality outputs for each catchment was then taken and has been analysed as detailed below.
2.4 Trend analysis
To assess any trends displayed in the future climatic, streamflow, and water quality data, the Mann-Kendall (MK) test was performed (Mann Citation1945, Kendall Citation1975). MK tests for a monotonic positive or negative change in a time series by calculating Kendall’s tau (association test) between each value and all of the proceeding values (Helsel and Hirsch Citation2002). The nature of hydrological data lends itself to this nonparametric method as it is generally non-normally distributed and displays seasonality, going against a constant distribution assumption (Kundzewics and Robson Citation2004). Additionally, autocorrelation is often also displayed in the data, making a parametric test further unsuitable; it is for this reason that during the MK test the Hamed and Rao method of autocorrelation correction was also applied (Hamed and Rao Citation1998). Sen’s slope estimator (Sen Citation1968) was also used to better estimate the size and direction of any detected trends.
Trend analysis on the mean of the 12 model runs for each catchment, for both streamflow volumes (at the gauging station location in each catchment) and water quality factors (measured at the water quality monitoring location in each catchment), was conducted for annual (hydrological years) and seasonal (winter, December to February; spring, March to May; summer, June to August; autumn, September to November) averages. Streamflow extremes were also considered, testing seasonally and annually for trends in one-day maximum flow, one-day minimum flow, and number of low-flow days (defined as days where streamflow is less than the 5th percentile value for the full 60-year dataset). High-flow events were also analysed, with the number of independent events per year with at least one streamflow peak above the 60-year 95th percentile value being calculated. Change in event length was also analysed, being defined as the period on either side of any peak flow where streamflow was greater than baseflow; at the start and end of each event streamflow is therefore equal to baseflow. The digital filter method defined by Sawicz et al. (Citation2011) was used to calculate direct runoff, as per EquationEquation (2)(2)
(2) , to subsequently enable the calculation of baseflow:
where is direct runoff at a given time step,
is a constant with value 0.925,
is direct runoff at the previous time step (at time step t = 0,
is assumed to be 0), and
is total streamflow. Baseflow (
) for the same time step was then calculated using Equation (3):
An event containing multiple peaks above the dataset 95th percentile is classified as a single event. In addition, a trend analysis was also performed on the input future temperature and precipitation data to identify any annual or seasonal changes occurring.
3 Results
Our results show a large decrease in summer and autumn average streamflows, with a corresponding increase in spring and winter flows. Overall, these seasonal changes result in a small decrease in annual average flows. Trends in extreme streamflows show much greater variability between catchments and seasons. However, all catchments display a trend for an increasing number of extreme low-flow days, as well as lower one-day minimum flow volumes. Water quality appears to be highly linked to streamflow, especially changes in extreme high and low flows. Summer, in particular, shows lower water quality standards across all catchments and variables. To provide further context to the streamflow and water quality results, we first include a brief trend analysis of seasonal and annual average mean temperatures and precipitation. As with all of the trend analysis subsequently presented, this has been completed using the MK trend test. Due to the lack of calibration of water quality parameters, only long-term seasonal and annual average trends are presented in this study, unlike streamflows, where extreme flows have also been analysed.
3.1 Climate projections
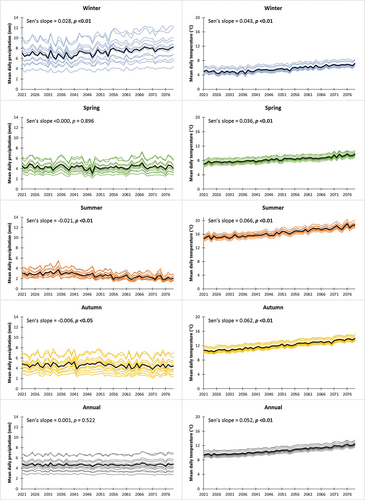
When looking at the mean of all 12 RCM outputs, future air temperature shows a significant (p < .01) increase for all stations in all seasons, as well as annually, as can be seen in the statistics reported in relating to the mean temperature of all stations. For precipitation trends, winter volumes increase across the board (p < .01), while summer volumes decrease (p < .01). Although autumn precipitation volumes all decrease across the future study period, at only six of the 13 stations is this highly significant (p < .01), a further two are significant at p < .05, and the remaining five are not significant; the average across all is significant at p < .05. For spring, there is a combination of upward and downward trends, but none are significant.
Figure 4. Future projections (2021–2080) for seasonal and annual daily mean precipitation (left) and temperature (right). Thin coloured lines represent the 13 pseudo-meteorological stations in the catchments; the thick black line denotes the average across all stations. Sen’s slope statistics for the 13-station mean are also shown; bold p values are significant at <.05.
3.2 Streamflow
3.2.1 Long-term averages
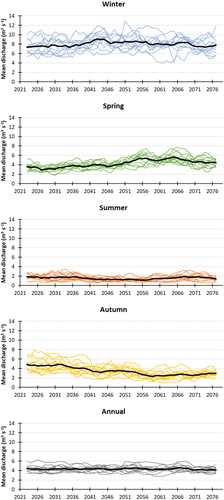
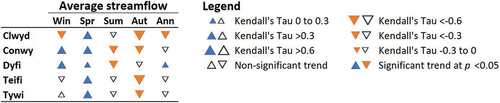
Long-term trends are seen both annually and seasonally in the catchments when analysing future streamflows (based on the average of all 12 model runs for each catchment); however, the direction and statistical significance of these vary among catchments. Seasonal and annual streamflow output, based on a five-year moving mean, for each of the 12 model runs for each catchment can be found in the Appendix, with the mean of this ensemble (used for the presented analysis) also shown. Using the 1990–2010 period average as a baseline, it can be seen that in most cases there is consistency between catchments (). Where there are exceptions to this, these mainly relate to the Dyfi catchment, which generally displays a smaller magnitude of change, especially in the spring, autumn, and annual average. Another notable outlier is the Clwyd catchment in winter, which shows a clear decrease in the latter half of the study period, which is not observed in the other catchments. These relationships are further highlighted in the MK trend analysis results, which are summarized in . A statistically significant increase in spring flows is observed in all catchments (Clwyd and Dyfi p < .05; Conwy, Teifi and Tywi p < .01), while a corresponding highly significant (p < .01) decrease in autumn flows is identified in all catchments except the Dyfi (p = .530). Summer streamflows also decrease in all catchments, but only statistically significantly in the Conwy (p < .05) and Dyfi (p < .01). Winter streamflows are the most varied, with the Clwyd and Teifi decreasing, and the Conwy, Dyfi, and Tywi increasing; these trends are only significant for the three most northerly catchments (p < .01). Finally, when looking at annual average streamflows, all catchments except the Dyfi display declining trends, albeit only significantly in the Clwyd (p < .01); the Dyfi increases significantly (p < .01).
Figure 5. Percentage change from the 1990–2010 baseline average (y-axis) for a five-year moving average of 2021–2080 future streamflow data (x-axis). Seasonal and annual averages shown for each catchment. Please note that the y-axis scale on the annual average graph (bottom) is smaller than the seasonal average graphs by a factor of two.
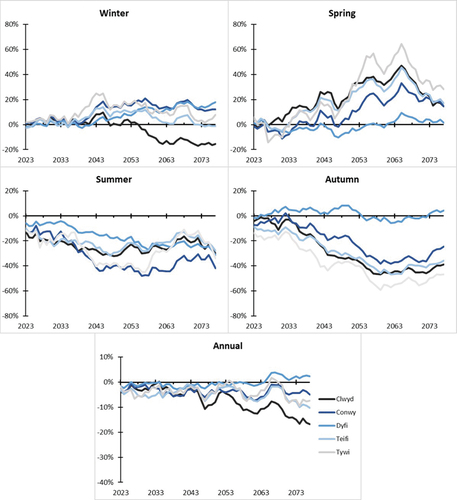
Figure 6. Overview of the direction, magnitude and significance of annual and seasonal average trends in projected future (2021–2080) average streamflow, as detected by Mann-Kendall trend analysis, based on the average of all 12 regional climate model outputs.
3.2.2 Extreme streamflows
Firstly, we can see that across all catchments, maximum one-day flows are increasing significantly (p < .01) in spring, while a decrease is shown in autumn in all catchments except the Dyfi (). Furthermore, the Conwy and Dyfi display a significant change (p < .01) in maximum one-day flow volume in winter and summer – an increase and a decrease, respectively. Minimum one-day flows decrease in summer, in autumn, and annually in all catchments, with this trend being statistically significant in autumn in all catchments ().
Figure 7. Overview of the direction, magnitude and significance of annual and seasonal trends in projected future (2021–2080) extreme streamflows, as detected by Mann-Kendall trend analysis, based on the average of all 12 regional climate model outputs.
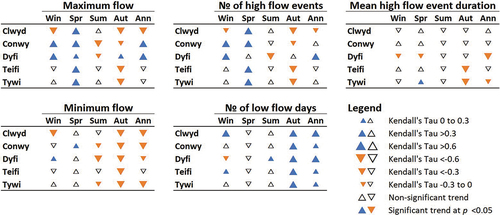
In terms of number of extreme low-flow days and high-flow events, a decrease in autumn is seen for high flows, alongside an increase in the number of low-flow days (), suggesting a general reduction in streamflows in autumn corresponding to the average autumn flow data. Similarly, for spring in all catchments except the Dyfi, there is a statistically significant (p < .01) increase in the number of extreme high-flow events, once again corresponding to an increase in average spring flows too. Annually, a statistically significant (p < .01) increase in the number of extreme low-flow days is observed in all catchments (), suggesting generally drier conditions in the catchments on average.
When one-day maximum flow volume and number of extreme high-flow events are compared, the trends observed are almost identical in all catchments and seasons (). In some cases, winter and spring in particular, this combination suggests an increase in both the magnitude and frequency of the largest flows. When looking at the mean high-flow event duration, it can be seen that change is projected to be smaller, with a general trend towards shorter events in summer and autumn and longer events in the spring. This leads to a picture of fewer, shorter flooding events in summer and autumn across the country, with spring high-flow events becoming more frequent and generally longer. Similarities can also be seen in the one-day minimum flow volume and number of extreme low-flow days; the vast majority of significant increases or decreases in minimum flows are mirrored by a decrease or increase, respectively, in the number of extreme low-flow days. This suggests that in summer and autumn, as well as annually on average, catchments will see a greater number of low-flow days, which are also more severe.
3.2.3 Annual flow exceedance characteristics
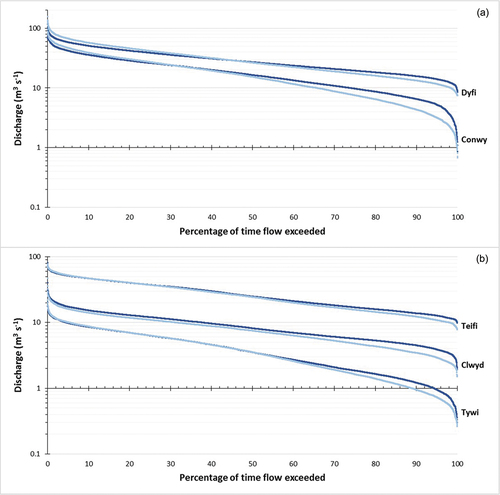
It is clear that significant alterations are projected to take place in future streamflow in terms of both seasonal/annual averages and extreme flows. These changes in flow regimes of the catchments are also clear when comparing the flow duration curves (FDCs) of streamflow for the baseline period (1990–2010) with late-future period streamflow (2060–2080; ). As can be seen, in all catchments, the water volumes that are most regularly exceeded (>75% of the time) are projected to become lower. This decrease is particularly prominent in the lowest flow volumes, those exceeded more than 95% of the time; in keeping with the extreme flows MK trend analysis which also shows minimum flow levels decreasing and more extreme low-flow days. High flows vary between catchments, once again in line with the extreme flows trend analysis. The Conwy and Dyfi, for example, both display an increase in discharge volumes exceeded 0 to 25% of the time in the 2060–2080 period compared to the 1990–2010 period. This once again corresponds with the observed trends of larger maximum flows, and a greater number of large flow events per year, both seen in the MK trend analysis. The Teifi and Tywi display little change in high flows between the two periods in the FDCs, which reflects the lack of statistically significant trends seen in annual maximum flow volume and number of extreme high-flow events seen in the MK trend analysis. The Clwyd displays the only statistically significant negative trend, in the MK analysis of annual maximum flow and number of extreme high-flow events; this is also evident in the FDC, which shows future flow volumes being consistently lower than the 1990–2010 baseline.
Figure 8. Flow duration curves for each catchment; the darker of each colour pair represents daily 1990–2010 data, whereas the lighter colour represents daily 2060–2080 data. (a) Conwy and Dyfi catchments, showing the accentuation of both high and low flows. (b) Clwyd, Teifi and Tywi catchments, showing the accentuation of lower flows.
3.3 Water quality
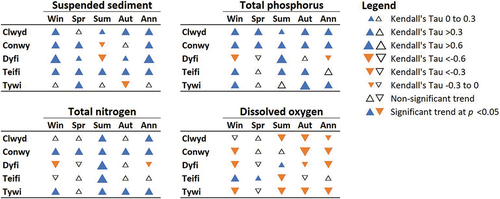
As can be seen in , in the majority of cases, trends seen in each water quality factor are consistent across all catchments and seasons. In terms of SS and TP concentrations specifically, 88% of all of the trends are increasing, with the Dyfi being the only catchment showing negative trends in long-term TP concentrations, in winter, spring and annually. Summer, in terms of SS concentrations, is the most spatially variable, with the Conwy and Dyfi both displaying a statistically significant decrease (p < .01). The Tywi is also set slightly apart from the other catchments in terms of SS, in that it has the fewest significant trends, and also shows a significant decrease in autumn SS concentrations (p < .01), the only catchment to do so. TN concentrations are also mostly consistent spatially, with the Dyfi once again being the main exception, with a decline in concentrations in line with those displayed for the catchment in TP. Additionally, TN levels are shown to be decreasing in winter in the Teifi also, albeit not statistically significantly. All catchments present a statistically significant (p < .01) increase in summer TN concentrations, while the Conwy displays the same in all seasons and annually. DO levels are generally decreasing over the study period, with autumn and annual trends in particular seeing a statistically significant (p < .01) decrease in all catchments except the Teifi. In winter too, DO is decreasing in all catchments except the Teifi, while in spring the Clwyd, Conwy, and Teifi all display an increasing trend. An increasing trend is also observed in the Dyfi for DO in summer, the opposite of that seen in the Clwyd, Teifi, and Tywi.
Figure 9. Overview of the direction, magnitude and significance of annual and seasonal average trends in projected future (2021–2080) water quality concentrations, as detected by Mann-Kendall trend analysis, based on the average of all 12 regional climate model outputs.
4 Discussion
4.1 Streamflow trends
The results of the MK trend analysis show a selection of spatially varying changes across the five catchments; however, when studying summer and autumn average flows, there is a common pattern in all catchments of a general decrease. For the summer, this trend is only statistically significant in the Conwy and Dyfi, and in autumn, it is significant in all catchments except the Dyfi. The projected general decline in summer and autumn streamflow is also observed in other research studying mean flows in the UK, such as UK CEH (Citation2012) and Kay (Citation2021). The only trend seen at a statistically significant level in all study catchments, an increase in spring average streamflow, is also observed in these other studies. Annual average flows only change significantly in the Clwyd (decrease) and Dyfi (increase), with all other catchments displaying a non-significant decline. These findings are consistent with those of Kay et al. (Citation2020), who showed a decreasing trend in mean annual streamflow for four catchments in the west of England and east Wales, as we observed in all catchments except the Dyfi. The same can be said for projections made by the UK CEH, which also show a small decline in mean annual streamflow for Wales up to the 2050s (UK CEH Citation2012). This change is primarily driven in all catchments except the Dyfi, by declines in summer and autumn average flow being greater in magnitude than increases in winter and spring.
In terms of the magnitude of large streamflows, the catchments fall into two clusters. Once again, the Conwy and the Dyfi catchments are similar to one another, while the Clwyd, Teifi, and Tywi all show similar responses. This can be seen for the annual data, when looking at in particular, with the Conwy and Dyfi displaying an accentuation of both the highest and lowest flows, with greater accentuation in low flows than high. The remaining three catchments only show an accentuation of low flows, this being particularly prominent in the Clwyd and Tywi. The Dyfi and Conwy are the most mountainous, steeply sloping, and smallest in area of the catchments, which makes them highly responsive to precipitation, and flashy (Hornberger et al. Citation2014). It is these specific catchment characteristics that partly foster the observed statistically significant trends of increasing winter and annual maximum streamflow, as well as number of high-flow events. Such physical catchment characteristics are known to cause high responsiveness, with studies such as Dunne (Citation1978), Weiler and McDonnell (Citation2006) and Hornberger et al. (Citation2014) linking smaller catchment area and greater steepness to a quicker catchment response and larger streamflow events. These responses are exacerbated by soil characteristics, with the Conwy and the Dyfi in particular being dominated in their upper reaches by peaty and gleysol soils, with the majority of this also lacking underlying groundwater or aquifer storage (Boorman et al. Citation1995, European Commission Citation2004). This again causes greater overland and subsurface flow, rather than infiltration and storage, leading to a flashier catchment regime (Boorman et al. Citation1995).
It is notable, however, when comparing the Conwy and the Dyfi, that accentuation of future low flows is much greater for the Conwy than the Dyfi (), with this likely due to the Dyfi displaying the opposite trend for winter minimum flow, and number of low-flow days, to the Conwy. In fact, the Dyfi is the only catchment to show a significant reduction in the number of low-flow days in winter, as well as an increase in winter minimum flow volume. Such changes can be attributed to LULC characteristics, in this case the larger proportion of coniferous and mixed forest present in the Dyfi. A study by Robinson et al. (Citation2003) demonstrated that for western Europe, forest areas, in particularly those that are coniferous-dominated, help to maintain higher baseflow conditions. This relationship also aids in explaining the non-significant increase seen in the winter low flows for the Tywi, which has the second largest proportion by some margin of LULC designated as coniferous and mixed forest. Furthermore, the statistically significant increase in annual average flows in the Dyfi is driven by increases seen in winter and spring streamflows, outweighing decreases in summer and autumn. This difference from the other catchments is also likely due to the large proportion of forested land in the Dyfi; Teutschbein et al. (Citation2015), for example, showed that increased forest cover led to increased annual average flow, in their study of 16 small catchments in Sweden.
Annual low flows in all catchments show an accentuation of presently seen low flows, into the 2060–2080 period (); this is likely due to the statistically significant declines seen in summer and autumn average flows into the future (). These seasons traditionally have seen the lowest flows, so the fact that they are generally getting drier and warmer would explain this decline in minimum flow volume. This trend observed in low flows across the catchments is in line with trends described by Kay et al. (Citation2020), who showed that for 10 catchments in the UK, under RCP8.5 conditions, low flows are declining in volume. This is particularly seen in the more westerly of the catchments studied (Kay et al. Citation2020), those closest to this study’s catchments. In addition, research by Dobson et al. (Citation2020) for England and Wales draws similar conclusions, with the yearly probability of water-use restrictions due to extreme drought projected to double by 2050.
Our results correspond with those of other research conducted recently in the UK in terms of seasonal changes in high and low flows, especially when considering the decrease in low summer and autumn flows, and the increase in high winter and spring flows. Visser-Quinn et al. (Citation2019), for example, detailed an increase in the magnitude, duration and frequency of both high- and low-flow events for Wales in the far future (2090s) under RCP8.5. Our results also show an increase in the frequency and magnitude of such events; however, in terms of event duration we find the opposite trend, a decline in most seasons as well as annually. Our results also show an increasing number of extreme high winter flow events, and extreme low autumn flows specifically, also corresponding to the results of Collet et al. (Citation2018). In addition, Lane and Kay (Citation2021) forecast, using UKCP18 projections, large reductions in summer low flow volumes by the 2080s, this is combined with simultaneous increases in winter high flow volumes, in line with our results. When examining the UK and Wales as part of a wider study, Marx et al. (Citation2018) also showed a decline in mean annual low flows in Atlantic-influenced western Europe, albeit this was the smallest change of all regions across Europe. Additionally, Thober et al. (Citation2018) found an increase in high flows and flooding in the UK under future climate scenarios representing RCPs 2.6, 6.0, and 8.5. This conforms with the results of work by Kay et al. (Citation2021), which demonstrates peak river flows to be increasing in magnitude for a study region covering west Wales.
4.2 Water quality trends
Unlike the streamflow trends discussed, the results of the MK trend analysis of water quality factors are much more homogeneous across the study region. The exceptions to this are the Dyfi catchment in terms of TP and TN in particular, and the Teifi in terms of DO; these outliers can be explained by studying the catchment characteristics. The Dyfi catchment, for example, has the lowest proportion of land designated as agricultural of all of the catchments, and the largest proportion designated as both forest and scrub (). These characteristics give the Dyfi catchment a significantly different LULC make-up than the Clwyd, Teifi, and Tywi in particular. Agricultural land is well documented to be one of the highest contributors to TP and TN levels in river systems (Edwards et al. Citation2000, Burt et al. Citation2011, Mockler et al. Citation2017, Weigelhofer et al. Citation2018). Burt et al. (Citation2011) stated that on average in England and Wales, 60% of nitrogen in surface waters originates from agricultural land, but this can be as high as 90% in agriculturally dominated catchments. Similarly, for phosphorus, the House of Commons Environmental Audit Committee (Citation2018) reported that runoff from agricultural land was one of the main sources of TP in surface waters, especially at times of highest water levels, i.e. winter and spring in this study’s catchments. These relationships, and the significantly lower proportion of agricultural land in the Dyfi catchment, go some way to explain this marked departure from the trends seen in all other study catchments. This relationship of LULC with TP and TN also explains the trends seen in all catchments except the Dyfi, for example increases in winter TP in the more agriculturally dominated catchments. Furthermore, the increases seen in summer TP and TN in all catchments are also indicative of the dominance of in-stream processes on their generation during warmer conditions (Edwards et al. Citation2000). Moreover, given the dependence of TP and TN concentrations on streamflow, as aforementioned and demonstrated in , it can also be observed that the declines in winter and spring TP and TN in the Dyfi relate to the unique streamflow trends observed in this catchment. Specifically, the Dyfi displays the only statistically significant increase in low volumes in winter, as explained previously. Additionally, decreases in TP and TN observed annually relate to the only statistically significant increase in annual average flows displayed in any of the five catchments. These correlations also help to explain the departure from the generally congruous trends in streamflow and water quality displayed between the Conwy and Dyfi, with the only major differences observed in their streamflow responses being in annual average and winter low flows.
The SS concentration results show a consistent rise across almost all catchments and seasons. The general uplift is likely due to a variety of reasons depending on the season. Certainly, in the spring and winter, increasing trends observed in the number and magnitude of high-flow events is likely the cause, along with an increase, generally, in average flows. These larger flows not only increase the amount of debris washed into river systems by overland flow, but also increase bank and bed erosion, as well as bed transport (Zeiger and Hubbart Citation2016, Janes et al. Citation2017, Varvani et al. Citation2019, Vercruysse and Grabowski Citation2019), causing an increase in total SS concentrations. In summer and autumn, with temperatures increasing and precipitation decreasing, there is an increased likelihood of drought, as well as fewer rainy days. This means that when rain does arrive, there is much more dust and debris to be washed from the land surface into river systems, especially as very dry land also has lower infiltration rates (Clark et al. Citation2017, Pulley and Collins Citation2019). Combined with the fact that lower streamflows have less dilution potential, this is the likely cause of the SS increases seen in these seasons (Whitehead et al. Citation2009b). The negative trends shown in summer Conwy and Dyfi SS concentrations are likely caused by statistically significant declines in maximum flow (both p < .01) and average flow (Conwy p < .05; Dyfi p < .01) volumes during the season across the study period, not seen in the other catchments.
The observed downward trends in DO seen for most seasons in the majority of catchments are likely linked to the rise in air temperatures seen in all seasons and annually (). Raised air temperatures have been shown to correlate positively with average water temperatures, albeit this relationship can be masked or affected by factors such as discharge volume, upstream dams and point source inputs (Webb et al. Citation2003, Caissie Citation2006, Hannah and Garner Citation2015, Beaufort et al. Citation2020, Daniels and Danner Citation2020). The known negative relationship between stream water temperature and DO concentration, due to the decreased oxygen solubility of warmer water (Ravansalar et al. Citation2016, Chaturvedi and Misra Citation2020), is therefore likely to be the cause of the declines seen in the study catchments. Furthermore, the broadly increasing concentrations of TP and TN shown in all catchments will likely also have an impact, causing an increase in aquatic plant growth during warmer temperatures, reducing oxygen levels in waters.
When studying water quality results as a collective, a clear decrease in water quality across all catchments and seasons can be observed. There is mostly agreement in terms of trend direction, in spring and autumn; however, in terms of statistically significant trends, more of these are present in summer, winter and annually. As previously mentioned, the key outlier is the Dyfi catchment, mainly due to its unique LULC characteristics compared to the other catchments; however, here too there are still significant water quality challenges, especially in the autumn.
4.3 Study implications
This research has been undertaken to provide a backdrop on which future planning, adaptation, and mitigation measures can be based for various industries. It is one of the first to make use of the new UKCP18 future climate projections and is certainly the first to investigate the impact of the projections for streamflow and water quality in Wales. It is hoped that by providing future projections of average and extreme high and low flows, as well as water quality changes, for a large area of Wales, that the results will be applicable to stakeholders in a variety of industries.
This study has shown how, under a worst-case scenario of future emissions, key river systems in Wales will be impacted by climate change in various ways in terms of both water quantity and quality. It is clear that the effects of climate change on streamflows will be most keenly felt seasonally, with annual average flows staying relatively stable in comparison. It is likely that the seasonal streamflow patterns currently seen will be exacerbated in the future, with modelling results showing increases in winter and spring average flows and a decline in summer and autumn flows. Trends in extreme events will also intensify, with large streamflow events (floods) generally increasing in magnitude and frequency in winter and spring, and low flows (droughts) increasing in frequency and magnitude in summer and autumn in particular. These streamflow trends could have important implications in terms of river ecology, flooding, and droughts, for a variety of stakeholders – not least of all water service providers (WSPs). Given that ~95% of water abstracted for public water supply in Wales is taken from surface sources (DCWW Citation2019a), the trends seen could impact on the ability of WSPs to continue to meet demand, especially in summer months, during peak demand (Dallison et al. Citation2020). Although annual average flows are relatively stable, if declining slightly, in most catchments, the fact that there will be considerably less water in summer and autumn could prove problematic from ecological and economic perspectives. Additionally, any increases in winter streamflow will do little to combat summer shortages if there is insufficient capacity to store it for use later in the year; this is particularly true for the Dyfi and Teifi, which are more reliant on river abstraction, compared to impoundment reservoirs used in the other catchments. Furthermore, the quality of incoming water could also cause problems at drinking water treatment plants, with SS, TP, and TN in particular potentially requiring plants to provide more treatment, negatively impacting on energy use, operation and maintenance costs, chemical use, and plant capacity.
The changes seen in annual flow exceedance probabilities could have implications for all large water abstractors, with abstraction licences often stipulating conditions, for example minimum “compensation flow” volumes. With lower flows expected to occur for a greater proportion of the time annually in the future, this could impact on the amount of water available for users such as industry, agriculture, and hydroelectric power generation. UK hydroelectric power generation schemes, both large and small, warrant the attention of future work in particular, due to the large potential impacts of changes in streamflow, and low flows especially. The timing, season length and total generation capacity of hydroelectric generation schemes could be impacted badly by changes in streamflow, potentially affecting the future electricity grid mix in the UK.
Finally, the changes seen in water quality factors could have an array of impacts on the aquatic ecosystem supported by surface waters. Increases in TP and TN, for example could lead to increases in eutrophication in lakes and rivers. Additionally, the declining DO levels shown here could seriously impact on fish species within catchments, with lower levels being well documented to decrease fish survival rates and badly impact spawning and development. These problems could be further exacerbated given the lower summer flows projected in particular, especially downstream of consented discharges from sites such as wastewater treatment works, as well as diffuse pollution sources. Lower streamflows provide less dilution potential; this, combined with higher water temperatures, has the potential to seriously impact on overall water quality.
5 Conclusions
This research has presented the key changes in future seasonal and annual stream quantity and quality parameters in Wales. The results highlight the need for adaptation now, to prepare infrastructure and systems to combat changes; this is especially true for water supply, despite Wales being seen as a water-rich region. Planning and mitigating now will help to ensure the continued supply of clean drinking water into the future, especially in the summer and autumn when lower flows and water quality will challenge WSPs.
It is important to note that this work takes a worst-case approach in terms of future climate change, so the streamflow and water quality results presented are at the highest end of potential future change. Therefore, we suggest that further hydrological modelling, using more optimistic projections for future emissions, such as RCPs 4.5 and 6.0, would be useful, to enable a broader range of potential future impacts to be compiled, and more informed decisions to be made by water users. This is particularly relevant to WSPs, to enable a continued high-quality future water supply, and to plan the future provision of drinking water treatment plants. In addition, further investigation of the impact of streamflow changes on water abstractors is required. For example, implications for the output generation potential of hydroelectric schemes is needed at a national level, to enable robust planning across the country, ensuring stability in the national electricity grid. Furthermore, research on the links of climate change to total water demand is also required, to ensure future water supply–demand budgets are achievable under future conditions, and to put in place management measures where necessary. Finally, an initial investigation of future water quality alterations due to climate change was presented in this paper. There is scope for future work to build on these results and provide greater clarity on likely changes, for both the quality factors studied here and other important water quality parameters, such as microplastics, pharmaceuticals, heavy metals, and bacteria.
Supplemental Material
Download MS Word (1.1 MB)Acknowledgements
This study was conducted as part of the Dŵr Uisce project, which aims at improving the long-term sustainability of water supply, treatment, and end use in Ireland and Wales. The work has been used as a case study for Dŵr Uisce Work Package 7 “climate change,” and forms part of a study assessing the impact of future climate change on water resource exploitation in Wales.
Disclosure statement
No potential conflict of interest was reported by the authors.
Supplemental data
Supplemental data for this article can be accessed here.
Additional information
Funding
References
- Abera, F., et al., 2018. Optimal operation of hydropower reservoirs under climate change: the case of Tekeze reservoir, eastern Nile. Water, 10, 273. doi:https://doi.org/10.3390/w10030273
- Afzal, M., Vavlas, N., and Ragab, R., 2021. Modelling study to quantify the impact of future climate and land use changes on water resources availability at catchment scale. Journal of Water and Climate Change, 12, 339–361. doi:https://doi.org/10.2166/wcc.2020.117
- Allen, R.G., et al., 1998. Crop evapotranspiration - guidelines for computing crop water requirements. Rome, Italy: Food and Agriculture Organization of the United Nations.
- Arnold, J.G., et al., 1998. Large area hydrologic modelling and assessment part I: model development. Journal of the American Water Resources Association, 34, 73–89. doi:https://doi.org/10.1111/j.1752-1688.1998.tb05961.x
- Arnold, J.G., et al., 2012. Input/output documentation. Texas, USA: Texas Water Resources Institute.
- Bailey, R.T., et al., 2016. Assessing regional-scale spatio-temporal patterns of groundwater-surface water interactions using a coupled SWAT-MODFLOW model. Hydrological Processes, 30, 4420–4433.
- Beaufort, A., et al., 2020. Influence of landscape and hydrological factors on stream-air temperature relationships at regional scale. Hydrological Processes, 34, 583–597. doi:https://doi.org/10.1002/hyp.13608
- Beven, K., 1997. TOPMODEL: a critique. Hydrological Processes, 11, 1069–1085. doi:https://doi.org/10.1002/(SICI)1099-1085(199707)11:9<1069::AID-HYP545>3.0.CO;2-O
- Bijl, D.L., et al., 2016. Long-term water demand for electricity, industry and households. Environmental Science & Policy, 55, 75–86. doi:https://doi.org/10.1016/j.envsci.2015.09.005
- Boorman, D.B., Hollis, J.M., and Lilly, A., 1995. Hydrology of soil types: a hydrologically-based classification of the soils of the United Kingdom. Wallingford, England: Institute of Hydrology.
- Burt, T.P., et al., 2011. Nitrate in United Kingdom rivers: policy and its outcomes since 1970. Environmental Science & Technology, 45, 175–181. doi:https://doi.org/10.1021/es101395s
- Caissie, D., 2006. The thermal regime of rivers: a review. Freshwater Biology, 51, 1389–1406. doi:https://doi.org/10.1111/j.1365-2427.2006.01597.x
- Chambers, B.M., Pradhanang, S.M., and Gold, A.J., 2017. Simulating climate change induced thermal stress in coldwater fish habitat using SWAT model. Water, 9, 732. doi:https://doi.org/10.3390/w9100732
- Charlton, M.B. and Arnell, N.W., 2014. Assessing the impacts of climate change on river flows in England using the UKCP09 climate change projections. Journal of Hydrology, 519, 1723–1738. doi:https://doi.org/10.1016/j.jhydrol.2014.09.008
- Chaturvedi, D. and Misra, O.P., 2020. Simultaneous effects of the rise in temperature due to greenhouse gases and hypoxia on the dynamics of the aquatic population: a mathematical model. Journal of Applied Mathematics and Computing, 63, 59–85. doi:https://doi.org/10.1007/s12190-019-01308-4
- Christierson, B., Vidal, J.P., and Wade, S.D., 2012. Using UKCP09 probabilistic climate information for UK water resource planning. Journal of Hydrology, 424–425, 48–67. doi:https://doi.org/10.1016/j.jhydrol.2011.12.020
- Chun, K.P., Wheater, H.S., and Onof, C., 2009. Streamflow estimation for six UK catchments under future climate scenarios. Hydrology Research, 40, 96–112. doi:https://doi.org/10.2166/nh.2009.086
- Clark, K.E., et al., 2017. Tropical river suspended sediment and solute dynamics in storms during an extreme drought. Water Resources Research, 53, 3695–3712. doi:https://doi.org/10.1002/2016WR019737
- Clerc, M. and Kennedy, J., 2002. The particle swarm-explosion, stability, and convergence in a multidimensional complex space. IEEE Transactions on Evolutionary Computation, 6, 58–73. doi:https://doi.org/10.1109/4235.985692
- Coello, C.A.C., Pulido, G.T., and Lechuga, M.S., 2004. Handling multiple objectives with particle swarm optimization. IEEE Transactions on Evolutionary Computation, 8, 256–279. doi:https://doi.org/10.1109/TEVC.2004.826067
- Coffey, R., et al., 2016. Sensitivity of streamflow and microbial water quality to future climate and land use change in the West of Ireland. Regional Environmental Change, 16, 2111–2128. doi:https://doi.org/10.1007/s10113-015-0912-0
- Collet, L., et al., 2018. Future hot-spots for hydro-hazards in Great Britain: a probabilistic assessment. Hydrology and Earth System Sciences, 22, 5387–5401. doi:https://doi.org/10.5194/hess-22-5387-2018
- Cosgrove, W.J. and Loucks, D.P., 2015. Water management: current and future challenges and research directions. Water Resources Research, 51, 4823–4839. doi:https://doi.org/10.1002/2014WR016869
- Dallison, R.J.H., Patil, S.D., and Williams, A.P., 2020. Influence of historical climate patterns on streamflow and water demand in Wales, UK. Water, 12, 1684. doi:https://doi.org/10.3390/w12061684
- Dallison, R.J.H., Patil, S.D., and Williams, A.P., 2021. Impacts of climate change on future water availability for hydropower and public water supply in Wales, UK. Journal of Hydrology: Regional Studies, 36, 100866.
- Daniels, M.E. and Danner, E.M., 2020. The drivers of river temperatures below a large dam. Water Resources Research, 56, e2019WR026751. doi:https://doi.org/10.1029/2019WR026751
- DCWW, 2016. Trading and procurement code. Treharris, Wales: Dŵr Cymru Welsh Water.
- DCWW, 2019a. Revised draft drought plan 2020. Treharris, Wales: Dŵr Cymru Welsh Water.
- DCWW, 2019b. Final water resources management plan 2019. Treharris, Wales: Dŵr Cymru Welsh Water.
- Delpla, I., et al., 2009. Impacts of climate change on surface water quality in relation to drinking water production. Environment International, 35, 1225–1233. doi:https://doi.org/10.1016/j.envint.2009.07.001
- Dobson, B., et al., 2020. The spatial dynamics of droughts and water scarcity in England and Wales. Water Resources Research, 56, 2020WR027187. doi:https://doi.org/10.1029/2020WR027187
- Dunne, T., 1978. Field studies of hillslope flow processes. In: M.J. Kirkby, ed. Hillslope hydrology. Chichester, England: John Wiley, 227–293.
- Edwards, A.C., et al., 2000. Concentrations of nitrogen and phosphorus in streams draining the mixed land-use Dee catchment, north-east Scotland. Journal of Applied Ecology, 37, 159–170. doi:https://doi.org/10.1046/j.1365-2664.2000.00500.x
- EEA, 2012. CORINE Land Cover 2012 [ Online]. European Environment Agency. Available from: https://www.eea.europa.eu/data-and-maps/data/clc-2012-raster [ Accessed 5 March 2021].
- EEA, 2017. Copernicus land service - pan-European component: CORINE land cover. Copenhagen, Denmark: European Environment Agency.
- El-Nasr, A.A., et al., 2005. Modelling the hydrology of a catchment using a distributed and a semi-distributed model. Hydrological Processes, 19, 573–587. doi:https://doi.org/10.1002/hyp.5610
- Ellis, J.R., et al., 2012. Spawning and nursery grounds of selected fish species in UK waters. Science Series Technical Report No. 147. Lowestoft, England: Cefas.
- European Commission, 2004. The European soil database distribution version 2.0 [ Online]. Available from: https://esdac.jrc.ec.europa.eu/content/european-soil-database-v20-vector-and-attribute-data [ Accessed 5 March 2021].
- Fereidoon, M. and Koch, M., 2018. SWAT-MODSIM-PSO optimization of multi-crop planning in the Karkheh River Basin, Iran, under the impacts of climate change. Science of the Total Environment, 630, 502–516. doi:https://doi.org/10.1016/j.scitotenv.2018.02.234
- Ficklin, D.L. and Barnhart, B.L., 2014. SWAT hydrologic model parameter uncertainty and its implications for hydroclimatic projections in snowmelt-dependent watersheds. Journal of Hydrology, 519, 2081–2090. doi:https://doi.org/10.1016/j.jhydrol.2014.09.082
- Gassman, P.W., Sadeghi, A.M., and Srinivasan, R., 2014. Applications of the SWAT model special section: overview and insights. Journal of Environmental Quality, 43, 1–8. doi:https://doi.org/10.2134/jeq2013.11.0466
- Gleick, P.H. and Palaniappan, M., 2010. Peak water limits to freshwater withdrawal and use. Proceedings of the National Academy of Sciences, 107, 11155–11162. doi:https://doi.org/10.1073/pnas.1004812107
- Golmohammadi, G., et al., 2014. Evaluating three hydrological distributed watershed models: MIKE-SHE, APEX, SWAT. Hydrology, 1, 20–39. doi:https://doi.org/10.3390/hydrology1010020
- Gupta, H.V., et al., 2009. Decomposition of the mean squared error and NSE performance criteria: implications for improving hydrological modelling. Journal of Hydrology, 377, 80–91. doi:https://doi.org/10.1016/j.jhydrol.2009.08.003
- Haguma, D., Leconte, R., and Krau, S., 2017. Hydropower plant adaptation strategies for climate change impacts on hydrological regime. Canadian Journal of Civil Engineering, 44, 962–970. doi:https://doi.org/10.1139/cjce-2017-0141
- Hamed, K.H. and Rao, A.R., 1998. A modified Mann-Kendall trend test for autocorrelated data. Journal of Hydrology, 204, 182–196. doi:https://doi.org/10.1016/S0022-1694(97)00125-X
- Hanlon, H.M., et al., 2021. Future changes to high impact weather in the UK. Climatic Change, 166, 50. doi:https://doi.org/10.1007/s10584-021-03100-5
- Hannah, D.M. and Garner, G., 2015. River water temperature in the United Kingdom. Progress in Physical Geography: Earth and Environment, 39, 68–92. doi:https://doi.org/10.1177/0309133314550669
- Hargreaves, G.H. and Allen, R.G., 2003. History and evaluation of Hargreaves evapotranspiration equation. Journal of Irrigation and Drainage Engineering, 129, 53–63. doi:https://doi.org/10.1061/(ASCE)0733-9437(2003)129:1(53)
- Heathwaite, A.L., 2010. Multiple stressors on water availability at global to catchment scales: understanding human impact on nutrient cycles to protect water quality and water availability in the long term. Freshwater Biology, 55, 241–257. doi:https://doi.org/10.1111/j.1365-2427.2009.02368.x
- Helsel, D.R. and Hirsch, R.M., 2002. Statistical methods in water resources. Virginia, USA: United States Geological Survey.
- Hornberger, G.M., et al., 2014. Catchment Hydrology: The hillslope stream continuum. In: Elements of physical hydrology. Baltimore, USA: Johns Hopkins University Press.
- Hosseini, S.H. and Khaleghi, M.R., 2020. Application of SWAT model and SWAT-CUP software in simulation and analysis of sediment uncertainty in arid and semi-arid watersheds (Case study: the Zoshk-Abardeh watershed). Modeling Earth Systems and Environment, 6, 257–284. doi:https://doi.org/10.1007/s40808-020-00846-2
- House of Commons Environmental Audit Committee, 2018. UK progress on reducing nitrate pollution. London, England: House of Commons.
- IPCC, 2014. Climate change 2014: synthesis report. Contribution of working groups I, II and III to the fifth assessment report of the intergovernmental panel on climate change. Core writing team: R.K. Pachauri and L.A. Meyer, eds. Geneva, Switzerland: IPCC.
- Janes, V.J.J., et al., 2017. Analysis of fundamental physical factors influencing channel bank erosion: results for contrasting catchments in England and Wales. Environmental Earth Sciences, 76, 307. doi:https://doi.org/10.1007/s12665-017-6593-x
- Jilo, N.B., et al., 2019. Evaluation of the impacts of climate change on sediment yield from the Logiya watershed, Lower Awash Basin, Ethiopia. Hydrology, 6, 81. doi:https://doi.org/10.3390/hydrology6030081
- Kakouei, K., et al., 2018. Projected effects of climate-change-induced flow alterations on stream macroinvertebrate abundances. Ecology and Evolution, 8, 3393–3409. doi:https://doi.org/10.1002/ece3.3907
- Kauffeldt, A., et al., 2016. Technical review of large-scale hydrological models for implementation in operational flood forecasting schemes on continental level. Environmental Modelling & Software, 75, 68–76. doi:https://doi.org/10.1016/j.envsoft.2015.09.009
- Kay, A.L., et al., 2020. The impact of climate change on UK river flows: a preliminary comparison of two generations of probabilistic climate projections. Hydrological Processes, 34, 1081–1088. doi:https://doi.org/10.1002/hyp.13644
- Kay, A.L., et al., 2021. Climate change impacts on peak river flows: combining national-scale hydrological modelling and probabilistic projections. Climate Risk Management, 31, 100263. doi:https://doi.org/10.1016/j.crm.2020.100263
- Kay, A.L., 2021. Simulation of river flow in Britain under climate change: baseline performance and future seasonal changes. Hydrological Processes, 35. doi:https://doi.org/10.1002/hyp.14137
- Kendall, M.G., 1975. Rank correlation methods. 3rd ed. London, England: Griffin Publishers.
- Kendon, E.J., et al., 2019. UKCP convection-permitting model projections: science report. Exeter, England: Met Office Hadley Centre.
- Kennedy, J. and Eberhart, R.C., 1995. Particle swarm optimization. In: Proceedings of ICNN’95 - international conference on neural networks. Perth, Australia: Institute of Electrical and Electronics Engineers, 1942–1948.
- Kundzewics, Z.W. and Robson, A.J., 2004. Change detection in hydrological records - a review of the methodology. Hydrological Sciences Journal, 49, 7–19. doi:https://doi.org/10.1623/hysj.49.1.7.53993
- Lane, R.A. and Kay, A.L., 2021. Climate change impact on the magnitude and timing of hydrological extremes across Great Britain. Frontiers in Water, 3. doi:https://doi.org/10.3389/frwa.2021.684982
- Lee, S., et al., 2018. Comparative analyses of hydrological responses of two adjacent watersheds to climate variability and change using the SWAT model. Hydrology and Earth System Sciences, 22, 689–708. doi:https://doi.org/10.5194/hess-22-689-2018
- Liang, X., et al., 1994. A simple hydrologically based model of land surface water and energy fluxes for general circulation models. Journal of Geophysical Research, 99, 14415–14428. doi:https://doi.org/10.1029/94JD00483
- Lowe, J.A., et al., 2018. UKCP18 science overview report. Exeter, England: Met Office Hadley Centre.
- Mann, H.B., 1945. Nonparametric tests against trend. Econometrica, 13, 245–259. doi:https://doi.org/10.2307/1907187
- Marx, A., et al., 2018. Climate change alters low flows in Europe under global warming of 1.5, 2, and 3 °C. Hydrology and Earth System Sciences, 22, 1017–1032. doi:https://doi.org/10.5194/hess-22-1017-2018
- Miller, J.D. and Hutchins, M., 2017. The impacts of urbanisation and climate change on urban flooding and urban water quality: a review of the evidence concerning the United Kingdom. Journal of Hydrology: Regional Studies, 12, 345–362.
- Mockler, E.M., et al., 2017. Sources of nitrogen and phosphorus emissions to Irish rivers and coastal waters: estimates from a nutrient load apportionment framework. Science of the Total Environment, 601–602, 326–339. doi:https://doi.org/10.1016/j.scitotenv.2017.05.186
- MOHC, 2018. UKCP18 regional projections on a 12km grid over the UK for 1980–2080 [ Online]. Available from: https://catalogue.ceda.ac.uk/uuid/589211abeb844070a95d061c8cc7f604 [ Accessed 5 March 2021].
- Mortazavi‐Naeini, M., et al., 2019. Assessment of risks to public water supply from low flows and harmful water quality in a changing climate. Water Resources Research, 55, 10386–10404. doi:https://doi.org/10.1029/2018WR022865
- Murphy, J.M., et al., 2018. UKCP18 land projections: science report. Exeter, England: Met Office Hadley Centre.
- Neitsch, S.L., et al., 2011. Soil and Water Assessment Tool theoretical decumentation: version 2009. Texas, USA: Texas Water Resources Institute.
- Nerantzaki, S.D., et al., 2016. Assessing the impact of climate change on sediment loads in a large Mediterranean watershed. Soil Science, 181, 306–314. doi:https://doi.org/10.1097/SS.0000000000000164
- NRFA, 2020. National River Flow Archive [ Online]. Available from: https://nrfa.ceh.ac.uk/data/search [ Accessed 5 March 2021].
- NRW, 2019a. Hydropower permits [ Online]. Available from: https://lle.gov.wales/catalogue/item/HydropowerPermits/?lang=en [ Accessed 5 March 2021].
- NRW, 2019b. Natural Resources Wales (NRW) water quality data archive held in WISKI (KiWQM) [ Online]. Available from: https://libcat.naturalresources.wales/webview/?infile=details.glu&loid=119251&rs=1136580&hitno=1&straight_to_details=TRUE&tiarray=full [ Accessed 5 March 2021].
- Ockenden, M.C., et al., 2017. Major agricultural changes required to mitigate phosphorus losses under climate change. Nature Communications, 8, 161. doi:https://doi.org/10.1038/s41467-017-00232-0
- Ordnance Survey, 2020. OS Terrain 5 [ Online]. Available from: https://www.ordnancesurvey.co.uk/business-government/products/terrain-5 [ Accessed 5 March 2021].
- Park, J.Y. and Kim, S.J., 2014. Potential impacts of climate change on the reliability of water and hydropower supply from a multipurpose dam in South Korea. Journal of the American Water Resources Association, 50, 1273–1288. doi:https://doi.org/10.1111/jawr.12190
- Perra, E., et al., 2018. Multimodel assessment of climate change-induced hydrologic impacts for a Mediterranean catchment. Hydrology and Earth System Sciences, 22, 4125–4143. doi:https://doi.org/10.5194/hess-22-4125-2018
- Pesce, M., et al., 2018. Modelling climate change impacts on nutrients and primary production in coastal waters. Science of the Total Environment, 628–629, 919–937. doi:https://doi.org/10.1016/j.scitotenv.2018.02.131
- Ponting, J., et al., 2021. The impact of increased flooding occurrence on the mobility of potentially toxic elements in floodplain soil: a review. Science of the Total Environment, 754, 142040. doi:https://doi.org/10.1016/j.scitotenv.2020.142040
- Prudhomme, C., et al., 2012. The drying up of Britain? A national estimate of changes in seasonal river flows from 11 regional climate model simulations. Hydrological Processes, 26, 1115–1118. doi:https://doi.org/10.1002/hyp.8434
- Prudhomme, C., et al., 2013. Future flows hydrology: an ensemble of daily river flow and monthly groundwater levels for use for climate change impact assessment across Great Britain. Earth System Science Data, 5, 101–107. doi:https://doi.org/10.5194/essd-5-101-2013
- Prudhomme, C. and Williamson, J., 2013. Derivation of RCM-driven potential evapotranspiration for hydrological climate change impact analysis in Great Britain: a comparison of methods and associated uncertainty in future projections. Hydrology and Earth System Sciences, 17, 1365–1377. doi:https://doi.org/10.5194/hess-17-1365-2013
- Pulley, S. and Collins, A.L., 2019. Field-based determination of controls on runoff and fine sediment generation from lowland grazing livestock fields. Journal of Environmental Management, 249, 109365. doi:https://doi.org/10.1016/j.jenvman.2019.109365
- Rau, M., et al., 2020. Statistical downscaling to project extreme hourly precipitation over the United Kingdom. International Journal of Climatology, 40, 1805–1823. doi:https://doi.org/10.1002/joc.6302
- Ravansalar, M., Rajaee, T., and Ergil, M., 2016. Prediction of dissolved oxygen in River Calder by noise elimination time series using wavelet transform. Journal of Experimental & Theoretical Artificial Intelligence, 28, 689–706. doi:https://doi.org/10.1080/0952813X.2015.1042531
- Refsgaard, J.C. and Storm, B., 1995. MIKE SHE. In: V.P. Singh, ed. Computer models of watershed hydrology. Colorado, USA: Water Resources Publications, 809–847.
- Robinson, M., et al., 2003. Studies of the impact of forests on peak flows and baseflows: a European perspective. Forest Ecology and Management, 186, 85–97. doi:https://doi.org/10.1016/S0378-1127(03)00238-X
- Robinson, E.L., et al., 2017. Climate hydrology and ecology research support system meteorology dataset for Great Britain (1961–2015) [CHESS-met]. Wallingford, England: Centre for Ecology & Hydrology.
- Rockström, J., et al., 2009. A safe operating space for humanity. Nature, 461, 472–475. doi:https://doi.org/10.1038/461472a
- Sawicz, K., et al., 2011. Catchment classification: empirical analysis of hydrologic similarity based on catchment function in the eastern USA. Hydrology and Earth System Sciences, 15, 2895–2911. doi:https://doi.org/10.5194/hess-15-2895-2011
- Sayers, P., et al., 2016. The analysis of future flood risk in the UK using the future flood explorer. E3S Web of Conferences, 7, 21005. doi:https://doi.org/10.1051/e3sconf/20160721005
- Sen, P.K., 1968. Estimates of the regression coefficient based on Kendall’s Tau. Journal of the American Statistical Association, 63, 1379–1389. doi:https://doi.org/10.1080/01621459.1968.10480934
- Singh, V. and Goyal, M.K., 2017. Unsteady high velocity flood flows and the development of rating curves in a Himalayan basin under climate change scenarios. Journal of Hydrologic Engineering, 22, 04017023. doi:https://doi.org/10.1061/(ASCE)HE.1943-5584.0001530
- Suliman, A.H.A., et al., 2015. Comparison of semi-distributed, GIS-based hydrological models for the prediction of streamflow in a large catchment. Water Resources Management, 29, 3095–3110. doi:https://doi.org/10.1007/s11269-015-0984-0
- Sultana, R. and Choi, M., 2018. Sensitivity of streamflow response in the snow-dominated Sierra Nevada watershed using projected CMIP5 data. Journal of Hydrologic Engineering, 23, 05018015. doi:https://doi.org/10.1061/(ASCE)HE.1943-5584.0001640
- Teutschbein, C., et al., 2015. Hydrological response to changing climate conditions: spatial streamflow variability in the boreal region. Water Resources Research, 51, 9425–9446. doi:https://doi.org/10.1002/2015WR017337
- Thober, S., et al., 2018. Multi-model ensemble projections of European river floods and high flows at 1.5, 2, and 3 degrees global warming. Environmental Research Letters, 13, 014003. doi:https://doi.org/10.1088/1748-9326/aa9e35
- UK CEH, 2012. National changes in river flow [ Online]. Available from: https://www.ceh.ac.uk/national-changes-river-flow#overview [ Accessed 5 March 2021].
- Varvani, J., Khaleghi, M.R., and Gholami, V., 2019. Investigation of the relationship between sediment graph and hydrograph of flood events (Case study: Gharachay River tributaries, Arak, Iran). Water Resources, 46, 883–893. doi:https://doi.org/10.1134/S0097807819060204
- Vercruysse, K. and Grabowski, R.C., 2019. Temporal variation in suspended sediment transport: linking sediment sources and hydro‐meteorological drivers. Earth Surface Processes and Landforms, 44, 2587–2599. doi:https://doi.org/10.1002/esp.4682
- Visser-Quinn, A., et al., 2019. Spatio-temporal analysis of compound hydro-hazard extremes across the UK. Advances in Water Resources, 130, 77–90. doi:https://doi.org/10.1016/j.advwatres.2019.05.019
- Warren, A.J. and Holman, I.P., 2012. Evaluating the effects of climate change on the water resources for the city of Birmingham, UK. Water and Environment Journal, 26, 361–370. doi:https://doi.org/10.1111/j.1747-6593.2011.00296.x
- Watts, G., et al., 2015. Climate change and water in the UK – past changes and future prospects. Progress in Physical Geography: Earth and Environment, 39, 6–28. doi:https://doi.org/10.1177/0309133314542957
- Watts, G. and Anderson, M., 2016. Water climate change impacts report card 2016 edition. London, England: Living with Environmental Change Network.
- Webb, B.W., Clack, P.D., and Walling, D.E., 2003. Water-air temperature relationships in a Devon river system and the role of flow. Hydrological Processes, 17, 3069–3084. doi:https://doi.org/10.1002/hyp.1280
- Weigelhofer, G., Hein, T., and Bondar-Kunze, E., 2018. Phosphorus and nitrogen dynamics in riverine systems: human impacts and management options. In: S. Schmutz and J. Sendzimir, eds. Riverine ecosystem management. Cham, Switzerland: Springer International Publishing, 187–202.
- Weiler, M. and McDonnell, J.J., 2006. Testing nutrient flushing hypotheses at the hillslope scale: a virtual experiment approach. Journal of Hydrology, 319, 339–356. doi:https://doi.org/10.1016/j.jhydrol.2005.06.040
- Welsh Government, 2019. Energy generation in Wales: 2018. Cardiff, Wales: Welsh Government.
- Welsh Government, 2020. Welcome to Wales: priorities for the visitor economy 2020–2025. Cardiff, Wales: Welsh Government.
- Whitehead, P.G., et al., 2009b. A review of the potential impacts of climate change on surface water quality. Hydrological Sciences Journal, 54, 101–123.
- Whitehead, P.G., Wade, A.J., and Butterfield, D., 2009a. Potential impacts of climate change on water quality and ecology in six UK rivers. Hydrology Research, 40, 113–122.
- Williams, J.R. and Izaurralde, R.C., 2010. The APEX model. In: V.P. Singh and D.K. Frevert, eds. Watershed models. Boca Raton, USA: Taylor & Francis Group, 437–482.
- Xu, X., et al., 2019. Evaluating the impact of climate change on fluvial flood risk in a mixed-use watershed. Environmental Modelling & Software, 122, 104031.
- Yang, X., et al., 2017. Stochastic sensitivity analysis of nitrogen pollution to climate change in a river basin with complex pollution sources. Environmental Science and Pollution Research, 24, 26545–26561.
- Yang, M., et al., 2018. Assessment of potential climate change effects on the rice yield and water footprint in the Nanliujiang catchment, China. Sustainability, 10, 242.
- Yang, D., Herath, S., and Musiake, K., 2000. Comparison of different distributed hydrological models for characterization of catchment spatial variability. Hydrological Processes, 14, 403–416.
- Yuan, Z., Xu, J., and Wang, Y., 2019. Historical and future changes of blue water and green water resources in the Yangtze River source region, China. Theoretical and Applied Climatology, 138, 1035–1047.
- Zeiger, S. and Hubbart, J.A., 2016. Quantifying suspended sediment flux in a mixed-land-use urbanizing watershed using a nested-scale study design. Science of the Total Environment, 542, 315–323.
Appendices
Figure A1. Seasonal and annual future streamflow projections for the Clwyd based on a 5-year moving mean; coloured lines represent individual model runs from the 12- member ensemble, black line is the ensemble mean.
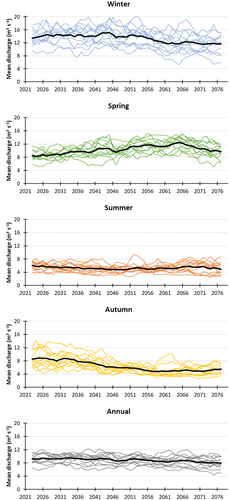
Figure A2. Seasonal and annual future streamflow projections for the Conwy based on a 5-year moving mean; coloured lines represent individual model runs from the 12- member ensemble, black line is the ensemble mean.
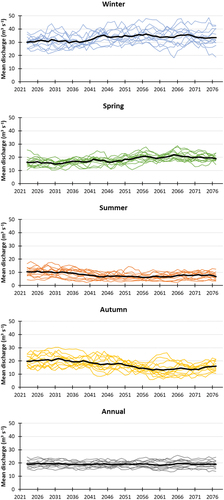
Figure A3. Seasonal and annual future streamflow projections for the Dyfi based on a 5-year moving mean; coloured lines represent individual model runs from the 12- member ensemble, black line is the ensemble mean.
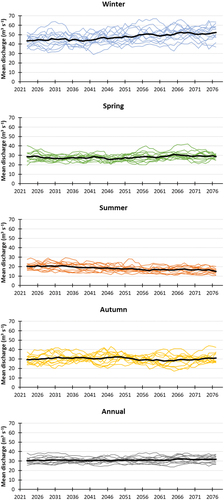
Figure A4. Seasonal and annual future streamflow projections for the Teifi based on a 5-year moving mean; coloured lines represent individual model runs from the 12- member ensemble, black line is the ensemble mean.
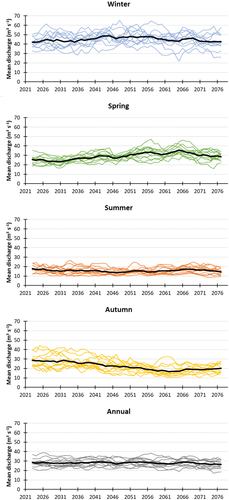
Figure A5. Seasonal and annual future streamflow projections for the Tywi based on a 5-year moving mean; coloured lines represent individual model runs from the 12- member ensemble, black line is the ensemble mean.