
 ?Mathematical formulae have been encoded as MathML and are displayed in this HTML version using MathJax in order to improve their display. Uncheck the box to turn MathJax off. This feature requires Javascript. Click on a formula to zoom.
ABSTRACT
The purpose of the present study was to identify factors that underlie differences among runners in stride frequency (SF) as a function of running speed. Participants (N = 256; 85.5% males and 14.5% females; 44.1 ± 9.8 years; 181.4 ± 8.4 cm; 75.3 ± 10.6 kg; mean ± SD) shared their wearable data (Garmin Inc). Individual datasets were filtered to obtain representative relationships between stride frequency (SF) and speed per individual, representing in total 16.128 h of data. The group relationship between SF (72.82 to 94.73 strides · min−1) and running speed (V) (from 1.64 to 4.68 m · s−1) was best described with SF = 75.01 + 3.006 V. A generalised linear model with random effects was used to determine variables associated with SF. Variables and their interaction with speed were entered in a stepwise forward procedure. SF was negatively associated with leg length and body mass and an interaction of speed and age indicated that older runners use higher SF at higher speed. Furthermore, run frequency and run duration were positively related to SF. No associations were found with injury incidence, athlete experience or performance. Leg length, body mass, age, run frequency and duration were associated with SFs at given speeds.
KEY POINTS
On a group level, stride frequency can be described as a linear function of speed: SF (strides · min−1) = 75.01+ 3.006·speed (m · s−1) within the range of 1.64 to 4.68 m · s−1.
On an individual level, the SF-speed relation is best described with a second order polynomial.
Leg length and body mass were positively related to stride frequency while age was negatively related to stride frequency.
Run frequency and run duration were positively related to stride frequency, while running experience, performance and injury incidence were unrelated.
Introduction
The growing use of wearables and smartphone applications enables runners to have easy access to a wealth of information on running speed, running technique, heart rate and training behaviour. Currently, most feedback of sports wearables is limited to displaying measured variables, largely ignoring underlying biomechanical relationships and individual differences. Stride frequency (SF) is one of the metrics captured by most running wearables. Running speed is the product of SF and stride length (SL). Therefore, any change in biomechanics that leads to changes in speed will change either SF, SL, or both. Many measures of running technique are related to SF. For example, vertical displacement of the body’s centre of mass (Farley & Gonzalez, Citation1996; Heiderscheit, Chumanov, Michalski, Wille, & Ryan, Citation2011; Morin, Samozino, Zameziati, & Belli, Citation2007) and ground contact time (Farley & Gonzalez, Citation1996; Morin et al., Citation2007) decrease with increasing SF at a given speed. Typically, vertical and horizontal ground reaction force at impact, as well as peak tibial impact accelerations decrease with increasing SF (Clarke, Cooper, Hamill, & Clark, Citation1985; Crowell & Davis, Citation2011; Hobara, Sato, Sakaguchi, & Nakazawa, Citation2012; Lieberman, Warrener, Wang, & Castillo, Citation2015), as do joint moments around the knee and the hip (Derrick, Hamill, & Caldwell, Citation1998; Heiderscheit et al., Citation2011; Seay, Selbie, & Hamill, Citation2008). Such findings lead to a common belief that higher SFs may reduce injury incidence (Boyer & Derrick, Citation2015; Edwards, Taylor, Rudolphi, Gillette, & Derrick, Citation2010; Lenhart et al., Citation2015; Lenhart, Thelen, Wille, Chumanov, & Heiderscheit, Citation2014). In addition, it has been shown that SF manipulation results in a change in metabolic demands, which for most runners indicates that they would have to increase their SF to reduce these demands (Connick & Li, Citation2014; de Ruiter, Verdijk, Werker, Zuidema, & de Haan, Citation2013; Snyder & Farley, Citation2011; Van Oeveren, De Ruiter, Beek, & Van Dieën, Citation2017). Hence, feedback on SF is believed to be useful to decrease injury risk and metabolic demands of running.
In practice (coaches, practitioners and (non-scientific) literature) often advise a fixed SF of 90 strides ⋅ min−1 following Daniels (Citation2013). Several studies have shown that SF increases with speed. However, those studies share a common limitation in that SF was measured in very short running bouts. For example, Mercer, Vance, Hreljac, and Hamill (Citation2002) measured 20 s on a treadmill, Weyand, Sternlight, Bellizzi, and Wright (Citation2000) measured 8 steps on a treadmill and Nummela, Keränen, and Mikkelsson (Citation2007) measured over a 30 m distance on an indoor track. In addition, several authors reported relatively large inter-individual differences in preferred SF at a given speed (Hunter & Smith, Citation2007; Salo, Bezodis, Batterham, & Kerwin, Citation2011; Van Oeveren et al., Citation2017). Biomechanical models (Biewener, Farley, Roberts, & Temaner, Citation2004; Blickhan et al., Citation2007; Cavagna, Willems, Franzetti, & Detrembleur, Citation1991; Srinivasan & Ruina, Citation2006) and comparative animal studies (Heglund & Taylor, Citation1988; Marsh, Citation2004; Taylor, Heglund, McMahon, & Looney, Citation1980) suggest that SF is determined by leg length. Similarly, body mass, sex, and age can be expected to influence SF. SF is thought to be modifiable by gait retraining (Lenhart, Thelen, & Heiderscheit, Citation2014) and thus it can be expected that performance, experience, training behaviour and injury history may be associated with SF.
Most of the current knowledge on SF is derived from studies on small homogenous groups, which makes it difficult to generalise this knowledge for advice to individual runners on the SF they should adopt. Until now, determinants of self-selected SF have not been established, which makes it difficult to provide individualised advice in practice.
Today’s sports wearables provide the means to collect large amounts of data which can provide new insights into individual differences in SF. The aim of this study is to assess the relationship between SF and running speed using data collected with wearables worn during regular running sessions in a large heterogeneous population of runners. This large dataset provides the opportunity to investigate how anthropometric measures, experience, performance, training behaviour, and injury incidence affect the relationship between running speed and SF.
Materials and methods
Study population and study design
Adult runners were recruited using social media and online advertisement in the Netherlands. Participants filled out questions on anthropometrics, experience, performance, injury incidence, and training behaviour (). Runners who used a Garmin sports watch were asked to share their data. All participants provided digital informed consent before participating. The study protocol was approved by the local ethics committee of the Faculty of Behavioural and Movement Sciences and designed in accordance with the Declaration of Helsinki (World Medical Association, Citation2013). For practical reasons, such as accessibility, accuracy and popularity, data collection was limited to the data of the brand Garmin. From the data logged by these devices, SF and speed were derived. A Garmin Forerunner 620 HRM® was validated with data from diverse conditions of a previous study (van Oeveren, de Ruiter, Beek, Rispens, & van Dieën, Citation2018), resulting in a good absolute agreement coefficient with the reference measure of SF (ICC, mean±std = 0.85 ±0.06). However, since SFs can be measured by foot pods, accelerometers embedded in the watch, or accelerometers embedded in the heart rate monitor, it should be noted that the accuracy may depend on the specific software and hardware setup and thus vary across participants. The data were filtered per individual before being submitted to a regression analysis. presents an overview of the data selection process.
Table 1. Description of the determinants derived from the questionnaire
Figure 1. Overview of the data selection process. A larger cohort filled out the questionnaire, 256 participants shared their data. The SF and speed data were first filtered per time series and sequentially per individual to form a representative dataset. The individual datasets with speed and SF estimates were analysed on group level using regression analysis. First to determine the relationship between SF and speed, thereafter to understand the contribution of anthropometric variables. Secondly, to evaluate the association of anthropometric – and training variables with SF
Obtaining individual datasets
The training data from sports watches were typically stored in TCX or FIT formats. These data were processed and analysed using custom Matlab code (R2017b; MathWorks Inc., Natick, USA). illustrates several steps taken to obtain individual datasets.
Workouts were pre-selected and classified as “running” when median V ranged between 1.2 and 8 m ⋅ s−1. Additionally, the selected files had to contain SF data.
Per workout, intervals with constant speed were selected. First, V and SF were interpolated to 1 Hz and low-pass filtered (Butterworth, order 1 and low-pass frequency of 0.4 and 0.03 Hz for V and SF, respectively) as fast fluctuations in V and SF were considered irrelevant in the present context. Steady-speed observations were selected using a moving standard deviation with a span of 5 s and a maximum standard deviation of 0.1 m ⋅ s−1 (). The first 3 min of each workout, data points outside the speed range of 0.1–11 m ⋅ s−1 and outside an SF range of 20–120 strides ⋅ min−1 were excluded. Note that the ranges used are very conservative, later filtering steps will further remove outliers and other activities.
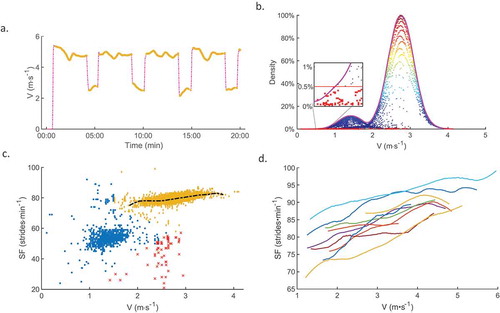
Figure 2. Illustration of the procedure to obtain individual relationships between SF and V. a) Illustrates the speed (purple line) over time during an interval workout. The yellow points indicate the selected steady speed observations. A moving standard deviation filter with a cut-off value of 0.05m ⋅ s−1 was used to select the steady speed. b) Illustrates the removal of outliers using a kernel density estimation on SFxV observations. Observations <0.5% where removed as outlier. c) Illustrates the classification using clustering and the non-parametric fit (black intermitted line). The clusters were allocated to different activities (yellow: running, blue: walking, red cross: outliers) Secondly, a non-parametric fit was calculated on the observations classified as running. d) Illustrates the diversity of 10 of the individual V-SF relationships. Non-parametric fits such as these were further analysed using a regression analysis
Next, the aggregated SF and V observations within each individual were analysed to create a representative relationship between SF and V per individual without forcing a relationship beforehand using the next steps.
High variation existed in the number of observations per workout. Therefore, a weight was calculated using a logarithmic-weighting function with a minimum of 100 observations to randomly remove observations per workout and decrease the sample size variation between workouts. The aggregated data points of all workouts of one individual formed an individual dataset.
From an individual dataset, outliers were removed by calculating the density of the observations. Data density was calculated using a kernel density estimation over both SF and V dimensions (). Observations below 0.5% of the maximal density were defined as outlier. Bandwidth was calculated using the maximal smoothing principle (Terrell, Citation1990) with a Gaussian kernel.
At this point, the individual datasets could still contain “walking”, “running” or even “biking” observations. In addition, the data could contain noise that was produced in a more systematic manner for example by measurement errors. A Gaussian mixture distribution analysis was used on the dimensions SF and V to determine clusters with the assigned labels: “rest”, ‘walk, ‘run, ‘bike or “noise”. The number of clusters was determined iteratively based on the AIC-criteria. Only the “Run”-classified observations were used for further analysis.
A non-parametric fit was calculated to create representative V-SF relationships per participant using the following procedure: First, a moving median filter with steps of 0.1 m ⋅ s−1 without overlap was applied to the data. Subsequently, a second-degree Savitzky-Golay FIR smoothing filter with a frame length of 1 m ⋅ s−1 was used to create a non-parametric fit. Observations with unique values for V with a maximum precision of 0.1 m ⋅ s−1 were maintained. In this way, the relationships were not pre-shaped and only true speeds were used for further analysis.
Lastly, from the set of all individual relationships, outliers were removed. This was done in a stepwise procedure using the sequence of Outlier models (See below). A log-likelihood test was used to determine the validity of each new model before outliers on the residuals were assessed using a generalised extreme Studentised deviate test. In total, this procedure marked 0.56% as outlier.
Outlier model 1:
Outlier model 2:
In which the terms within the brackets denote the random effects' terms, where a subject identifier (subj_id) was used as a random effect variable to account for individual differences.
Assessing the baseline model SF x V
After removal of outliers, the fixed terms of the equation were tested in sequential order. The complexity of the V-SF model was determined by a log-likelihood test and the significance of regression coefficients. The regression term
did not contribute significantly; therefore
was used in further steps. Individual differences in intercept, slope and curvature (
) revealed the within-subject nature of the data. The model was therefore further expanded with random terms using stepwise model comparisons and inspecting the explained variance. Based on the results it was decided to use the Baseline model below for further analysis.
Adding variables as fixed terms
The variables derived from the questionnaire () and the interaction between those variables with speed were entered in the Baseline model as fixed covariates using a forward stepwise procedure. The forward stepwise procedure is described as follows: entering all variables separately, keeping the variables with the lowest and significant regression coefficient (p <0.05) and repeating this procedure until none of the regression coefficients of the remaining variables was significant. Variables that correlated to more than r >0.7 were omitted from the analysis to prevent collinearity. Since anthropometric variables are easy to assess and to interpret from a biomechanical point of view, we analysed anthropometric variables apart from the other variables, before analysing all variables. The within-subject nature was controlled for by including random effects for participant (subj_id), with a full covariance matrix using the Cholesky parameterisation and restricted maximum pseudo-likelihood estimation.
Results
provides an overview of the data reduction process. From the 339 participants that shared their data, 256 (75%) participants contained sufficient workouts with SF and could be included. The individual datasets represented in total 16.128 h from 14.080 running workouts, with an average of 63 h of data per individual. summarises the characteristics of the participants that shared data in comparison with the participants that did not share training data. Significant differences were found between both groups regarding sex, various anthropometric measures and performance. The included group also consisted of more runners with >3 years’ experience and who trained significantly more often (weekly run frequency, distance and hours all significantly differed between groups). The reported rate of perceived exertion per workout was equal between groups. The variation based on the intended RPE scores per session indicates that workout intensity varied more in the included group. summarises SF and V data derived from the sports watches. Average speed was 3.07 m ⋅ s−1 with an average speed range across individuals from 1.64 to 4.68 m ⋅ s−1. The average SF was 84 strides ⋅ min−1 with an average range across individuals from 72.82 to 94.73 strides ⋅ min−1.
Table 2. Descriptive, anthropometry and training characteristics of the participants with and without data
Table 3. Sport watch data descriptive based on selected observations (N = 256)
Baseline model
On a group level, a significant regression coefficient for V in the prediction of SF (R2adj = 0.419, ): SF (strides ⋅ min−1) = 75.01 + 3.006 V (m ⋅ s−1) was found. Individual linear models revealed considerable inter-individual differences in intercepts (74.07 ± 13.05), slopes (2.978 ±7.962) and quadratic terms (0.120 ±1.284), where slopes and quadratic terms ranged from positive to negative. The model with the random effects explained almost all variance in the data (R2adj = 0.986, ). Therefore, we included random effects in the Baseline model for intercept, slope and the quadratic term. The regression coefficients of the Baseline model indicate that an increment of 1 m ⋅ s−1 relates to an increment of 3 strides ⋅ min−1. illustrates the Baseline model in comparison with previous literature.
Table 4. Results of the forward stepwise regression using a generalised linear mixed effects model
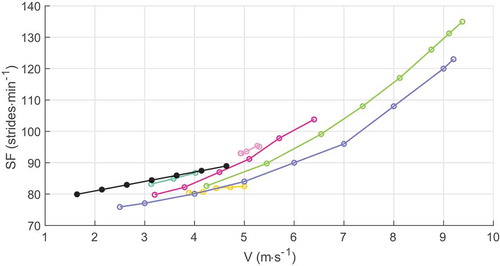
Figure 3. Comparison of the current study results in relation to aggregated data of previous literature. The line with the black-filled markers represents the relationship found in the current study SF = 75.01 + V·3.006. The other lines represent aggregated data of previous studies (Le Meur et al., Citation2013; Mercer & Dolgan, Citation2008; Nummela et al., Citation2007; Padulo, Annino, Migliaccio, D’Ottavio, & Tihanyi, Citation2011; Weyand et al., Citation2000)
Anthropometric model
Anthropometric variables added to the Baseline model resulted in significant regression coefficients for V, Leg Length, and the interaction term VxAge in the prediction of SF (, Anthropometric model). Leg Length correlated with Height (r = 0.96, Appendix) and BMI (r = 0.77, Appendix). Age did not have correlations with any other variable above the threshold of r = 0.7. The Anthropometric model indicates that for each 5 cm increase in leg length SF is reduced by 2 strides per minute, for a 15 kg increase in body mass SF is reduced by 1 stride per minute and a runner of 40 years running at 3 m ⋅ s−1 would have SF of 0.7 strides ⋅ min−1 higher than a runner at the age of 30, while at 5 m ⋅ s−1 the difference would be 1.1 strides ⋅ min−1.
Full model
The final model included Leg Length, Run Frequency and Run Duration in the prediction of SF (, Full model). Both Run Frequency and Run Duration (min) were positively related to SF at given speeds. The regression coefficients imply that habitual performance of one extra workout per week coincides with 0.56 strides ⋅ min−1 higher SF and habitual performance of 10 min longer workouts coincides with 0.48 strides ⋅ min−1 higher SF, at a given speed.
Discussion
The present study was designed to assess the determinants of self-selected SF in running. Current knowledge on SF is mainly based on short episodes of running in experimental conditions. Instead, the present results are based on habitual training data from wearable devices obtained from a large group of runners (N = 256, 16.128 h) and with many observations per runner (on average 55 workouts, 63 h).
Gait speed as a determinant of SF
On a group level (fixed terms in the equations) the relationship between SF and speed is best described using the linear equation SF = 75.01 + 3.006 V, with the fixed coefficients obtained from the model with random effects. The average speed ranges of the runners in the present study (1.64 to 4.68 m ⋅ s−1) reflect speeds during regular run sessions. Note that large speed ranges may increase the added value of an additional quadratic term, but such ranges are not commonly attained by most runners.
In comparison with previous studies, the calculated SF estimates are higher (). One important difference with previous studies is that speed in the current study was derived from GPS-data. It is recognised that smoothing of data on the device and the sample frequency may underestimate speed especially when turning or running along curved paths (Gray, Jenkins, Andrews, Taaffe, & Glover, Citation2010; Rawstorn, Maddison, Ali, Foskett, & Gant, Citation2014; Scott, Scott, & Kelly, Citation2016; Varley, Fairweather, & Aughey, Citation2012; Witte & Wilson, Citation2004). Based on the paper of Witte and Wilson (Citation2004) a bias of −0.4 m ⋅ s−1 may be expected in extreme conditions. Correcting for such an error, SF estimates for a given speed decrease by 2 strides ⋅ min−1. Due to the large sample size and the filtering applied in this study, we expect that the actual error is smaller. Besides the effects of GPS, there are many other potential methodological differences with previous studies that are likely to account for differences in the estimated SFs. For example, the influence of fatigue (Hunter & Smith, Citation2007; Mizrahi, Verbitsky, Isakov, & Daily, Citation2000; Willson & Kernozek, Citation1999) or over-ground versus treadmill running (Bailey, Mata, & Mercer, Citation2017; Elliott & Blanksby, Citation1976; Oliveira, Gizzi, Ketabi, Farina, & Kersting, Citation2016; Riley et al., Citation2008) may also affect SF. The present study shows that differences with previous studies can also in part be explained by participant characteristics, which the present study is the first to address.
Inter-individual variation in V-SF-relationships was relatively large. The improvement of explained variance using the random effects model (from R2adj = 0.419 to R2adj = 0.986) demonstrates that on an individual level, the relationship between SF and V is best described by a second order polynomial as in previous studies (Mercer et al., Citation2002; Nummela et al., Citation2007; Weyand et al., Citation2000). A positive quadratic term indicates that at higher speeds the contribution of SF increases and, consequently, the contribution of SL decreases. Therefore, in this case, generating horizontal propulsion to further increase SL may be limiting a further increase in speed. Interestingly, both positive and negative regression coefficients were found for the quadratic term. Positive and negative coefficients will cancel each other out at a group level, which may partly explain why the quadratic term b2 V2 was not significant. This inter-individual variation has not been reported before, but it may reflect individual tendencies to increase speed by preferentially increasing SF or SL.
Anthropometrics as determinants of SF
As expected, runners with longer legs had lower SF and thus made longer strides at given running speeds. Leg length was not measured as we used self-report and did not trust self-report of leg length. Body height was, as is quite common, self-reported and could have been used as a predictor of SF instead. However, mechanistically leg length is more likely to be an actual determinant of SF. The relation between body height and leg length is sex-dependent and hence a sex-specific estimate of leg length based on body height was preferred over body height in the analysis. It is recognised that this is different from the actual measured leg length per individual. For example, Svedenhag and Sjodin (Citation1994) suggested that taller, heavier and thereby presumably stronger elite runners with relatively shorter legs have longer SLs compared to shorter and lighter elite runners with relatively longer leg lengths (Svedenhag & Sjodin, Citation1994). In the current study, it is not possible to draw detailed conclusions on the association between individual variation in leg lengths and SF. Given the large sample of runners, we feel safe to conclude that taller runners, who in general have relatively longer legs, are more likely to run with lower SFs.
The Anthropometric model also showed a significant regression coefficient for body mass in the prediction of SF. With leg length already in the model, the effect of body mass due to body length is reduced. The differences can therefore mainly be attributed to differences in relative muscle and/or fat mass. Body mass primarily consisting of fat mass may lead to less effective forward propulsion and consequently relatively higher SF at a given speed. Since most of the runners in this study had a healthy BMI and were experienced, higher BMI could reflect larger muscle mass. Runners with more muscle mass may exploit their muscle strength to make longer strides, which may explain the negative effect of mass on the V-SF relationship. Accordingly, Svedenhag and Sjodin (Citation1994) reported a significant positive correlation between body mass and SL in well-trained runners.
A positive interaction term between speed (3.07 ±0.33 m ⋅ s−1) and age (44.1 ± 9.8 years) was last added to the Anthropometric model. The interaction term in the present study indicates that older runners increase SF rather than SL to attain high speeds. This finding was obtained from runners varying in age from 19 to 65 years and speeds ranging from 1.21 to 8.17 m ⋅ s−1. Cavagna, Legramandi, and Peyre-Tartaruga (Citation2008) studied two groups with a larger age difference (old 73.6 ±5.5 years vs young 20.8 ±1.6 at speeds from 1.1 to 4.7 m ⋅ s−1) and also reported a negative relationship between age and SF (Cavagna et al., Citation2008). They suggest that the higher SF are the consequence of a reduced recoil capacity which leads to shorter SL. The interaction effect of age and speed on SF could therefore be caused by a reduction in horizontal propulsion, explaining a preference to increase SF rather than SL to increase speed. Collectively, the significant effect of mass and the interaction between speed and age suggests that stronger runners use longer SLs and thus lower SFs at given speeds.
Training characteristics as determinants of SF
In the full model, anthropometrics, age, training behaviour, experience, performance and injury incidence measures were evaluated together in the regression analysis. In addition to leg length, run frequency and run duration were significantly and positively associated with SF. No significant associations between SF and experience, injury incidence or performance measures were found. Previous studies showed that, at a given speed, novice (untrained) runners have a lower SF compared with experienced runners (Gómez-Molina et al., Citation2017). The lower SF in novice runners seems to be energetically suboptimal (de Ruiter et al., Citation2013; Van Oeveren et al., Citation2017), while experienced runners appear to run near optimal SL/SF ratios (Cavanagh & Williams, Citation1982; de Ruiter et al., Citation2013; Hunter & Smith, Citation2007; Moore, Jones, & Dixon, Citation2012). In the current study, 77% of the runners had over 3 years’ experience. Most of them can therefore be considered experienced runners, which could also provide an explanation for the lack of association between running experience and SF in the present study. However, training effort seems to increase SF, as reflected in the associations with run frequency and run duration. In line with this, Nelson and Gregor (Nelson & Gregor, Citation1976) found in a longitudinal study that experienced distance runners tended to increase their SFs at a given speed over a period of 4 years.
Limitations and future directions
Without random effects, the final models, i.e. both the Anthropometric model and the Full model, explained approximately half of the variance in SF, while the random effects explained nearly 100% of the variance. This indicates that about half of the variance is unexplained inter-individual variation in offset, slope and the quadratic term. This clearly indicates that further exploration of the determinants of SF is needed.
Differences in device accuracy, sample frequency and filtering have likely contributed to between-subject variance. Moreover, we focussed on relatively “fixed” individual determinants of SF that could be assessed through questionnaires. Anthropometrics (leg length, body mass), but also age, run frequency and duration were related to SF. The latter three may be explained by differences in physical capacities. Leg muscle strength may be a limiting factor in increasing SL as discussed above. It may thus be more directly related to SF and hence be a better predictor than age and training volume, which may be related to SF through their effects on muscle strength. Potentially, muscle strength relative to anthropometric measures (body mass and length) may be even more informative. Furthermore, aerobic capacity may be an important determinant of the SF-V relationship. High aerobic capacity may imply that runners are less constrained to choose an optimal SF/SL ratio when running at sub-maximal speeds. Also, environmental (e.g. wind, slope, surface), and other transient factors (e.g. fatigue) may affect SF/SL ratios at given speeds. Some of the factors could be evaluated using similar large datasets from wearable devices.
In the present study, participants were relatively experienced and most of them presumably familiar with feedback on SF provided by their own sports watches. This may have created a bias towards running at relatively high SFs (as often advised) compared with a matching population not familiar with feedback.
Longitudinal studies and more detailed measures are required to understand possible benefits of SF feedback, to determine the effects of training targeting changes in SF on running economy and injury incidence and to assess how running drills and strength workouts optimise individual SF/SL-ratios.
Practical implications
As far as we know, current sports wearables ignore speed in their feedback on SF. The results of the present study show that speed and factors like leg length, body mass and age determine self-selected SF and hence likely also optimal SF. With the still largely unexplained variance between individuals, feedback may need to be based on individual data and likely coaches should stimulate variation to promote self-optimisation and adaptation to various situations.
Conclusion
On a group level, SF increases linearly with speed SF (strides · min−1) = 75.01 + 3.006·V (m · s−1) within the range of 1.64 to 4.68 m · s−1, while individual fits are best described using a second order polynomial. Higher SFs were found for participants with shorter leg lengths and lower body mass and in older participants when running at high speeds. Furthermore, run frequency and run duration were positively related to SF. No associations were found between SF and experience, performance, or injury incidence. Given the high variation observed within and between individuals, one should be careful in suggesting a single SF as optimal.
Acknowledgments
The authors acknowledge N.H. Jonkman for assistance in the statistical analysis and M.S. van Hunen for assistance in the questions regarding injury characteristics.
Disclosure statement
No potential conflict of interest was reported by the authors.
Additional information
Funding
References
- Bailey, J., Mata, T., & Mercer, J. A. (2017). Is the relationship between stride length, frequency, and velocity influenced by running on a treadmill or overground? International Journal of Exercise Science, Nov 1;10(7), 1067–1075.
- Biewener, A. A., Farley, C. T., Roberts, T. J., & Temaner, M. (2004). Muscle mechanical advantage of human walking and running: Implications for energy cost. Journal of Applied Physiology (Bethesda, Md.: 1985), 97(6), 2266–2274.
- Blickhan, R., Seyfarth, A., Geyer, H., Grimmer, S., Wagner, H., & Gunther, M. (2007). Intelligence by mechanics. Philosophical Transactions of the Royal Society A: Mathematical, Physical and Engineering Sciences, 365(1850), 199–220.
- Boyer, E. R., & Derrick, T. R. (2015). Select injury-related variables are affected by stride length and foot strike style during running. American Journal of Sports Medicine, 43(9), 2310–2317.
- Cavagna, G. A., Legramandi, M. A., & Peyre-Tartaruga, L. A. (2008). The landing-take-off asymmetry of human running is enhanced in old age. Journal of Experimental Biology, 211(10), 1571–1578.
- Cavagna, G. A., Willems, P. A., Franzetti, P., & Detrembleur, C. (1991). The two power limits conditioning step frequency in human running. The Journal of Physiology, 437, 95–108.
- Cavanagh, P. R., & Williams, K. R. (1982). The effect of stride length on oxygen uptake during distance running. Medicine and Science in Sports and Exercise, 14(1), 30–35.
- Clarke, T. E., Cooper, L. B., Hamill, C. L., & Clark, D. E. (1985). The effect of varied stride rate upon shank deceleration in running. Journal of Sports Sciences, 3(1), 41–49.
- Connick, M. J., & Li, F. X. (2014). Changes in timing of muscle contractions and running economy with altered stride pattern during running. Gait and Posture, 39(1), 634–637.
- Crowell, H. P, & Davis, I. S. (2011). Gait retraining to reduce lower extremity loading in runners. Clinical Biomechanics, 26(1) , 78–83.
- Daniels, J. (2013). In T. Hanlon, C. Marty, T. Wolpert, & P. MacDonald (Eds.), Daniels’ running formula (3nd ed.), Chapter 4. Mesa, Arizona: Human Kinetics Publishers, Inc.
- de Ruiter, C. J., Verdijk, P. W. L., Werker, W., Zuidema, M. J., & de Haan, A. (2013). Stride frequency in relation to oxygen consumption in experienced and novice runners. European Journal of Sport Science, 14(3), 37–41.
- Derrick, T. R., Hamill, J., & Caldwell, G. E. (1998). Energy absorption of impacts during running at various stride lengths. Medicine and Science in Sports and Exercise, 30(1), 128–135.
- Edwards, W. B., Taylor, D., Rudolphi, T. J., Gillette, J. C., & Derrick, T. R. (2010). Effects of stride length and running mileage on a probablistic stress fracture model. Medicine and Science in Sports and Exercise, 41(12), 2117–2184.
- Elliott, B. C., & Blanksby, B. A. (1976). A cinematographic analysis of overground and treadmill running by males and females. Medicine and Science in Sports, 8(2), 84–87.
- Farley, C., & Gonzalez, O. (1996). Leg stiffness and stride frequency in human running. Journal of Biomechanics, 29(2), 181–186.
- Gómez-Molina, J., Ogueta-Alday, A., Stickley, C., Cámara, J., Cabrejas-Ugartondo, J., & García-López, J. (2017). Differences in spatiotemporal parameters between trained runners and untrained participants. Journal of Strength and Conditioning Research, 31(8), 2169–2175.
- Gray, A. J., Jenkins, D., Andrews, M. H., Taaffe, D. R., & Glover, M. L. (2010). Validity and reliability of GPS for measuring distance travelled in field-based team sports. Journal of Sports Sciences, 28(12), 1319–1325.
- Heglund, N., & Taylor, C. (1988). Speed, stride frequency and energy costs per stride: How do they change with body size and gait? Journal of Experimental Biology, 318, 301–318.
- Heiderscheit, B. C., Chumanov, E. S., Michalski, M. P., Wille, C. M., & Ryan, M. B. (2011). Effects of step rate manipulation on joint mechanics during running. Medicine and Science in Sports and Exercise, 43(2), 296–302.
- Hobara, H., Sato, T., Sakaguchi, M., & Nakazawa, K. (2012). Step frequency and lower extremity loading during running. International Journal of Sports Medicine, 33(4), 310–313.
- Hunter, I., & Smith, G. A. (2007). Preferred and optimal stride frequency, stiffness and economy: Changes with fatigue during a 1-h high-intensity run. European Journal of Applied Physiology, 100(6), 653–661.
- Le Meur, Y., Thierry, B., Rabita, G., Dorel, S., Honnorat, G., Brisswalter, J., & Hausswirth, C. (2013). Spring-mass behaviour during the run of an international triathlon competition. International Journal of Sports Medicine, 34(8), 748–755.
- Lenhart, R. L., Smith, C. R., Vignos, M. F., Kaiser, J., Heiderscheit, B. C., & Thelen, D. G. (2015). Influence of step rate and quadriceps load distribution on patellofemoral cartilage contact pressures during running. Journal of Biomechanics, 48(11):2871-2878.
- Lenhart, R. L., Thelen, D. G., & Heiderscheit, B. C. (2014). Hip muscle loads during running at various step rates. Journal of Orthopaedic & Sports Physical Therapy, 44(10), 766–774, A1–4.
- Lenhart, R. L., Thelen, D. G., Wille, C. M., Chumanov, E. S., & Heiderscheit, B. C. (2014). Increasing running step rate reduces patellofemoral joint forces. Medicine and Science in Sports and Exercise, 46(3), 0–1.
- Lieberman, D. E., Warrener, A. G., Wang, J., & Castillo, E. R. (2015). Effects of stride frequency and foot position at landing on braking force, hip torque, impact peak force and the metabolic cost of running in humans. Journal of Experimental Biology, 218(21), 3406–3414.
- Marsh, R. L. (2004). Partitioning the energetics of walking and running: swinging the limbs is expensive. Science, 303(5654), 80–83.
- Mercer, J., & Dolgan, J. (2008). The physiological importance of preferred stride frequency during running at different speeds. JEPonline, 11(3), 26–32.
- Mercer, J. A., Vance, J., Hreljac, A., & Hamill, J. (2002). Relationship between shock attenuation and stride length during running at different velocities. European Journal of Applied Physiology, 87(4–5), 403–408.
- Mizrahi, J., Verbitsky, O., Isakov, E., & Daily, D. (2000). Effect of fatigue on leg kinematics and impact acceleration in long distance running. Human Movement Science, 19, 139–151.
- Moore, I. S., Jones, A. M., & Dixon, S. J. (2012). Mechanisms for improved running economy in beginner runners. Medicine and Science in Sports and Exercise, 44(9), 1756–1763.
- Morin, J. B., Samozino, P., Zameziati, K., & Belli, A. (2007). Effects of altered stride frequency and contact time on leg-spring behavior in human running. Journal of Biomechanics, 40(15), 3341–3348.
- Nelson, R. C., & Gregor, R. J. (1976). Biomechanics of distance running: A longitudinal study. Research Quarterly of the American Alliance for Health, Physical Education and Recreation, 47(3), 417–428.
- Nummela, A., Keränen, T., & Mikkelsson, L. O. (2007). Factors related to top running speed and economy. International Journal of Sports Medicine, 28(8), 655–661.
- Oliveira, A. S., Gizzi, L., Ketabi, S., Farina, D., & Kersting, U. G. (2016). Modular control of treadmill vs overground running. PloS one, 11(4), 1–19.
- Padulo, J., Annino, G., Migliaccio, G. M., D’Ottavio, S., & Tihanyi, Z. (2011). Kinematics of running at different slopes and speeds. Journal of Strength and Conditioning Research, 26(5), 1331-1339.
- Plagenhoef, S., Evans, F. G., & Abdelnour, T. (1983). Anatomical data for analysing human motion. Research Quarterly for Exercise and Sport, 54(2), 169–178.
- Rawstorn, J. C., Maddison, R., Ali, A., Foskett, A., & Gant, N. (2014). Rapid directional change degrades GPS distance measurement validity during intermittent intensity running. PloS one, 9(4), 1–6.
- Riley, P. O., Dicharry, J., Franz, J., Della, C. U., Wilder, R. P., & Kerrigan, D. C. (2008). A kinematics and kinetic comparison of overground and treadmill running. Medicine and Science in Sports and Exercise, 40(6), 1093–1100.
- Salo, A. I. T., Bezodis, I. N., Batterham, A. M., & Kerwin, D. G. (2011). Elite Sprinting. Medicine & Science in Sports & Exercise, 43(6), 1055–1062.
- Scott, M. T. U., Scott, T. J., & Kelly, V. G. (2016). The validity and reliability of global positioning systems in team sport. Journal of Strength and Conditioning Research, 30(5), 1470–1490.
- Seay, J., Selbie, W. S., & Hamill, J. (2008). In vivo lumbo-sacral forces and moments during constant speed running at different stride lengths. Journal of Sports Sciences, 26(14), 1519–1529.
- Snyder, K. L., & Farley, C. T. (2011). Energetically optimal stride frequency in running: The effects of incline and decline. The Journal of Experimental Biology, 214(Pt 12), 2089–2095.
- Srinivasan, M., & Ruina, A. (2006). Computer optimization of a minimal biped model discovers walking and running. Nature, 439(7072), 72–75.
- Svedenhag, J., & Sjodin, B. (1994). Body-mass-modified running economy and step length in elite male middle- and long-distance runners. International Journal of Sports Medicine, 15(6), 305–310.
- Taylor, C. R., Heglund, N. C., McMahon, T. A., & Looney, T. R. (1980). Energetic cost of generating muscular force during running: A comparison of large and small animals. The Journal of Experimental Biology, 86(1), 9–18.
- Terrell, G. R. (1990). The maximal smoothing principle in density estimation. Journal of the American Statistical Association, 85(410), 470–477.
- van Oeveren, B. T., De Ruiter, C. J., Beek, P. J., Rispens, S. M., & van Dieën, J. H. (2018). An adaptive, real-time cadence algorithm for unconstrained sensor placement. Medical Engineering & Physics, 52, 49-58.
- Van Oeveren, B. T., De Ruiter, C. J., Beek, P. J., & Van Dieën, J. H. (2017). Optimal stride frequencies in running at different speeds. PloS one, 12(10), 1–12.
- Varley, M. C., Fairweather, I. H., & Aughey, R. J. (2012). Validity and reliability of GPS for measuring instantaneous velocity during acceleration, deceleration, and constant motion. Journal of Sports Sciences, 30(2), 121–127.
- Weyand, P. G., Sternlight, D. B., Bellizzi, M. J., & Wright, S. (2000). Faster top running speeds are achieved with greater ground forces not more rapid leg movements. Journal of Applied Physiology (Bethesda, Md. : 1985), 89(5), 1991–1999.
- Willson, J. D., & Kernozek, T. W. (1999). Plantar loading and cadence alterations with fatigue. Medicine & Science in Sports & Exercise, 31, 12.
- Witte, T. H., & Wilson, A. M. (2004). Accuracy of non-differential GPS for the determination of speed over ground. Journal of Biomechanics, 37(12), 1891–1898.
- World Medical Association (WMA). (2013). WMA DECLARATION OF HELSINKI 1975 – Ethical Principles for Scientic Requirements and Research Protocols, (June 1964), 29–32.
Table A1. Correlation coefficients
Parameter estimates
Table A2. Parameter estimates in contribution to the Baseline model: +