
 ?Mathematical formulae have been encoded as MathML and are displayed in this HTML version using MathJax in order to improve their display. Uncheck the box to turn MathJax off. This feature requires Javascript. Click on a formula to zoom.
ABSTRACT
The backward double integration method uses one force plate and could calculate jump height for countermovement jumping, squat jumping and drop jumping by analysing the landing phase instead of the push-off phase. This study compared the accuracy and variability of the forward double integration (FDI), backwards double integration (BDI) and Flight Time + Constant (FT+C) methods, against the marker-based rigid-body modelling method. It was hypothesised that the jump height calculated using the BDI method would be equivalent to the FDI method, while the FT+C method would have reduced accuracy and increased variability during sub-maximal jumping compared to maximal jumping. Twenty-four volunteers performed five maximal and five sub-maximal countermovement jumps, while force plate and motion capture data were collected. The BDI method calculated equivalent mean jump heights compared to the FDI method, with only slightly higher variability (2–3 mm), and therefore can be used in situations where FDI cannot be employed. The FT+C method was able to account for reduced heel-lift distance, despite employing an anthropometrically scaled heel-lift constant. However, across both sub-maximal and maximal jumping, it had increased variability (1.1 cm) compared to FDI and BDI and should not be used when alternate methods are available.
Introduction
Jump height is often used to estimate athletic lower limb neuromuscular capabilities during training (Eagles et al., Citation2015; Morin et al., Citation2019), and rehabilitation (O’Malley et al., Citation2018). Additionally, jump height is commonly used to explore foundational human movement, as it requires coordination from multiple joints and can be performed across a range of intensities (Bobbert and Casius, Citation2005; Wade et al., Citation2020a). We defined jump height as the distance between the centre of mass (CoM) during standing and the apex of the jump, as this period includes all the work performed to propel the CoM into the air. The measure requires the jumper to break contact with the ground, and therefore, due to heel raise commonly lifting the centre of mass 8–10 cm (Bobbert et al., Citation1996; Moir, Citation2008; Vanrenterghem et al., Citation2004; Wade et al., Citation2018), a jump height below this height is very uncommon. As such, methods for calculating the jump height that do not take heel-lift into account will substantially underestimate the jump height (Chiu & Dæhlin, Citation2020, Citation2020; Wade et al., Citation2020b). Countermovement jump height is commonly used in power estimation formulas as an estimate of athlete power output (Harman et al., Citation1991; Sayers et al., Citation1999), and the countermovement, squat and drop jump are often compared to examine neuromuscular functional capabilities (Markström & Olsson, Citation2013; McBride et al., Citation2010; Walsh et al., Citation2004). However, comparing jump heights between jump types can be difficult as methods for calculating the jump height may be influenced by different starting positions (Bobbert & Casius, Citation2005; Bobbert et al., Citation1986).
One of the most accessible and reliable jump height calculation methods is the forward double integration (FDI) method, which only requires a single force plate and calculates the jump height using the ground reaction force (GRF) trace during push off (Buckthorpe et al., Citation2012). The net GRF trace is divided by body mass to calculate CoM acceleration, which is integrated once to calculate CoM velocity and then integrated a second time to calculate CoM displacement at take-off (heel-lift distance). CoM velocity at take-off is input into a projectile motion equation to calculate the distance travelled in the air, which is finally summed with the heel-lift distance to calculate the jump height. Previous research has demonstrated that an average body mass for all jumping trials should not be employed, as it can result in jump height errors of up to 4.5 cm (Vanrenterghem et al., Citation2001). Therefore, the FDI method requires an accurate measure of bodyweight and position of the CoM for every jump, calculated by participants stand as still as possible prior to push-off (Vanrenterghem et al., Citation2001). Additionally, the period over which FDI is performed needs to be kept as small as possible, so that minute GRF errors do not have time to be exponentially amplified by double integration, which can cause large heel-lift distance errors (Wade et al., Citation2020b). Maximal countermovement jumping generally takes about 1 second to perform (end of quiet standing until take-off), which is generally small enough to limit substantial amplification of heel-lift distance errors. However, calculating the jump height during squat jumping can result in large heel-lift distance errors, as participants are required to descend and hold the squatted position before performing the jump. The entire jump (end of quiet standing until take-off) can take up to 4–6 seconds, and as such, the squat jump height should not be calculated using the FDI method (Wade et al., Citation2020b). Alternatively, drop jumping requires participants to start on a box next to the force plate and drop down onto it, and thus, information about participant bodyweight and location of the CoM during quiet standing is missing. This issue can be overcome by placing a second force plate on the drop box or placing the drop box on a force platform to calculate the bodyweight and CoM height during quiet standing. If two force plates are used, the data from both force plates can then be combined and the FDI method is performed as normal, after which the output is summed with the known height of the drop box to calculate the jump height (Wank & Coenning, Citation2019). However, this method requires an additional portable force plate to be placed on the drop box, or a single force plate is needed that is large enough to fit both a drop box and space to perform jumping. Due to the errors present when using FDI to measure squat jumping and the additional equipment required to measure the jump height during drop jumping, alternative methods are necessary.
Three-dimensional marker-based motion capture, combined with rigid-body modelling, has commonly been used in laboratories to calculate the displacement of the CoM during jumping (McErlain-Naylor et al., Citation2014). While this method performs strongly at calculating the jump height, it has been shown to overestimate the flight distance and underestimate the heel-lift distance (Kibele, Citation1998; Wade et al., Citation2020b), in addition to joint centre location errors that may be up to 30 mm (Miranda et al., Citation2013). Furthermore, this method requires a substantial amount of additional equipment, software and complex post-processing of data that is far beyond what may be required for many practical applications of jump height. Wade et al. (Citation2020b) detailed a hybrid method that combines marker-based motion capture with force plates to calculate the jump height without time intensive processing of the data and complex rigid-body modelling. However, due to the additional equipment required for this method, it is primarily limited to application in a laboratory setting.
A simple and cost-effective alternative is the flight time (FT) method, which only requires the time in the air between take-off and landing to be obtained and can be performed with a single force plate, pressure mat (Buckthorpe et al., Citation2012) or even a smartphone (Bogataj et al., Citation2020). It is commonly used in field applications to assess countermovement jumping, drop jumping and squat jumping, as the flight phases of each are identical. However, the FT method is not a true measure of jump height as it does not take heel-lift into account, and therefore, this method consistently underestimates jump height by approximately 8–10 cm depending on the individual (Bobbert & Van Ingen Schenau, Citation1988; Moir, Citation2008). Furthermore, the FT method assumes that the position of the CoM is the same at take-off and during landing, which is never the case as the legs adopt a more flexed position during landing to attenuate landing forces (Kibele, Citation1998). Previous research has demonstrated that an anthropometrically scaled constant, based on each participant’s foot length, may be used as a substitute for the heel-lift distance. The constant is then summed with the distance travelled in the air calculated by the FT method to estimate the jump height (Wade et al., Citation2020b). While the FT plus heel-lift constant (FT+C) method demonstrated a substantial improvement compared to the FT method alone (Wade et al., Citation2020b), the heel-lift distance during sub-maximal jumping or between countermovement jumping, squat jumping and drop jumping may be inconsistent due to altered coordination strategies. An alternative method that only uses a single force plate and can calculate the jump height from any jump type could facilitate improved accuracy for coaches and researchers examining jumping.
The backwards double integration (BDI) method calculates jump height using the same method as the FDI method, except instead of integrating over the push-off phase, integration is performed over the landing phase (Grozier et al., Citation2021; Wank & Coenning, Citation2019). Jumping starts and ends in a quiet standing position, and therefore, all the energy generated to propel the CoM upwards must be attenuated during landing. Using the BDI method, the jump height could be calculated for countermovement jumping, squat jumping and drop jumping, as the landing phases of these three jump types are performed exactly the same (i.e., landing that is followed immediately by return to quiet standing). It should be noted that BDI cannot calculate the CoM distance travelled in the air or heel-lift distance, as this method is measuring the landing phase; however, this does not impede its ability to calculate the jump height. Additionally, portable force plates may struggle with this method due to very high peak ground reaction forces during landing, which can produce clipping of the forces due to maxing out the force plate. Currently, only one study has examined the accuracy of the BDI method, performing analysis during drop jumping and comparing the BDI method with marker-based kinematic modelling. Using paired t-tests, they found that results between methods were not statistically different, and therefore, BDI was a valid method for calculating jump height. However, pairwise testing can only determine if a significant difference exists, not that two methods produce the same results for accuracy and variability. Finally, it is valuable to know if the FDI and BDI methods produce equivalent results and could be used interchangeably although this can only be tested on countermovement jumping, as FDI cannot be used with drop jumping or squat jumping. Therefore, the first aim of this study was to build on previous work (Wank & Coenning, Citation2019) by comparing individual sub-maximal and maximal countermovement jump heights calculated using the FDI, BDI and FT+C methods against marker-based rigid-body kinematic modelling methods, which were not dependent on force plate data and could therefore be used as a reference method. We believe that results obtained during countermovement jumping of this study are directly comparable to drop jumping and squat jumping, as landing phases in these jumps should be identical. It was hypothesised that the BDI method would demonstrate equivalent accuracy and variability compared to the FDI and the FT+C method would have reduced accuracy compared to the BDI and FDI methods.
Sub-maximal jump heights are often used to explore how complex full body movements are executed (Vanrenterghem et al., Citation2004; Wade et al., Citation2020a). However, there is potential for increased movement variability during sub-maximal movements, and while the FDI and BDI methods are unlikely to be affected by different jump intensities, the FT+C method uses a participant-specific anthropometrically scaled heel-lift constant that does not change, irrespective of the jumping intensity. Therefore, it is likely that during sub-maximal jumping, the heel-lift distance will be decreased and produced with greater variability, which may reduce the accuracy of the FT+C method during sub-maximal jumping. The second aim of this study was to examine if the jump height calculated using the FT+C method, as well as the FDI and BDI, have reduced accuracy during sub-maximal jumping compared to maximal jumping. It was hypothesised that while the FDI and BDI method would not be affected, the FT+C method would overestimate jump height and have greater variability during sub-maximal jumping compared to maximal jumping.
Methods
Twenty-three healthy participants (11 female and 12 male, age = 28 ± 5 years, mass = 70 ± 12 kg, height = 172 ± 9 cm) without any formal jumping training gave written informed consent to participate in this study. Ethics was approved by the University of Bath, Research Ethics Approval Committee for Health (EP 18/19,053). Participants attended the Applied Biomechanics Suite at the University of Bath on a single occasion and performed jumping in their own shoes. After a self-directed warmup, participants completed five sub-maximal countermovement jumps and five maximal countermovement jumps assigned in a block randomised order. During maximal jumping, participants were asked to jump maximally, while during sub-maximal jumping, participants were asked to jump at 50% maximal effort. For each trial, participants started off the force plate while it was zeroed and then stepped onto two force plates (one foot on each plate), where they assumed a quiet standing position with their arms on their hips (no arm swing during jumping). Participants stood still for 2–3 seconds before performing either a sub-maximal or maximal countermovement jump. Upon landing, they were told to resume their quiet standing position, at which point data collection was terminated.
Motion capture data were recorded using a 15-camera Qualisys motion capture system (Oqus, Qualysis, Gothenburg, Sweden) at 200 Hz. A full body marker-set consisting of 44 individual makers and eight clusters was attached to participants, with a full description of marker locations detailed in Needham et al., (Citation2021). GRF data were collected from two in-ground force plates (Kistler 9287CA, Winterthur, Switzerland) at 1000 Hz. Motion capture data and GRF data were collected in Qualisys Track Manager (QTM, Qualisys, Sweden) and then exported to Visual 3D (C-Motion, Maryland, USA), where rigid-body, six degrees of freedom, kinematic modelling was performed to calculate the displacement of the centre of mass (Kinematic Method). GRF and CoM displacement calculated using rigid-body modelling was imported into Python 3.7 where a custom script calculated the jump height using the Kinematic Method, FDI method, BDI method and the FT+C method. During data processing, all trials that did not end with the participant standing quietly on the plate were excluded, resulting in 21 of 240 trials being excluded. Thus, for all methods, 109 maximal jumping trials and 110 sub-maximal jumping trials were analysed using pairwise comparison.
Forward double integration (FDI)
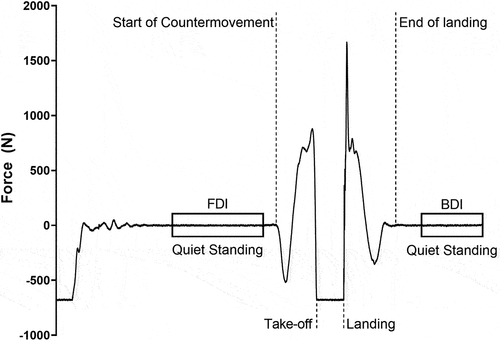
The vertical GRF traces from each plate were combined, and the average GRF during the time in the air was subtracted from the entire GRF trace to digitally zero the force plate. The quiet standing period was identified, and bodyweight was calculated by taking a mean value over one second (). Net GRF was then obtained by subtracting the bodyweight from the zeroed GRF trace. Following the methods outlined by Vanrenterghem et al., (Citation2001), the net GRF trace and the same period that the bodyweight was calculated over were used to identify, net GRF maximum, minimum and standard deviation (SD). To identify the start of the countermovement after quiet standing, the first value that exceeded either the maximum + one SD or the minimum – one SD was identified. Working backwards, the first value that exceeded 0 N (either positive or negative) was identified as the start of the countermovement (); (Vanrenterghem et al., Citation2001). Take-off was identified as the first point the net GRF trace exceeded the negative bodyweight following push-off (). To calculate the jump height, the net GRF trace was divided by the body mass (bodyweight/gravity) to calculate CoM acceleration. The CoM acceleration trace was integrated (trapezoidal) to calculate CoM velocity, which was then subsequently integrated to calculate CoM displacement at take-off (heel-lift). The final value of the CoM velocity trace was used to calculate the distance travelled in the air using the projectile motion equation,
Figure 1. Example of net GRF trace of one trial with event detections for quiet standing, start of the countermovement, take-off, landing and end of landing.
where v is the velocity at take-off, u is the velocity at the apex of the jump (0 m/s), a is the gravity (9.81 m/s2) and s is the distance travelled in the air. The distance travelled in the air and heel-lift distance were then summed to calculate the jump height. Within-participant heel-lift averages and SDs were calculated by taking the mean value of the heel-lift distance or SD for each individual participant, within each jump condition (sub-maximal and maximal).
Backwards double integration (BDI)
Using the same initial protocol as FDI, vertical GRF and the zeroed GRF trace were calculated. Bodyweight was calculated by identifying the last data point and moving backwards to identify the quiet standing period immediately after landing (0.5 seconds of quiet standing) at which point the GRF trace was averaged (). Net GRF was calculated by subtracting the bodyweight from the zeroed GRF, and then net GRF maximum, minimum and SD values during quiet standing were identified. Working backwards from the end of the trial, the first value that exceeded the maximum + one SD or the minimum – one SD was obtained. Then, moving forward, the last point that exceeded 0 N (positive or negative) was identified as the end of the landing phase (i.e., quiet standing, ). The start of landing was identified as the first value to exceed the negative bodyweight after push-off (). The net GRF trace was trimmed from the start of landing to the end of landing and then reversed so that sequentially, the end of landing occurred before the start of landing. From this point, the FDI method was repeated by: calculating CoM acceleration, performing double integration of the CoM acceleration trace, calculating the distance travelled in the air using projectile motion, and summing this value with CoM displacement at landing to calculate the jump height.
Kinematic rigid-body modelling
Displacement of the CoM calculated in Visual3D was imported into Python 3.7. The standing height was calculated as the average height of the CoM for 300 ms prior to the start of push-off, using event timing calculated by the FDI method. The maximal height of the CoM was then obtained (apex of the jump)m and the average standing height was subtracted from the maximal CoM height to calculate the jump height. Leg length comparison between sub-maximal and maximal jumping was performed by calculating the vertical position of the centre of mass of the pelvis at landing. The average vertical position between the distal ends of the right and left foot were then calculated and subtracted from the pelvis COM position to calculate the leg length.
Flight time + constant (FT+C)
The FT method calculated the CoM distance travelled in the air by using take-off (FDI) and landing events (BDI) calculated previously. Time in the air was halved and then input into the projectile motion equation,
where s is the distance travelled in the air, u is the velocity at the apex of the jump (0 m/s), a is the gravity (9.81 m/s2) and t equals half the time in the air. The heel-lift constant was calculated by taking foot measurements using a tape measure, which were input into the formula created by Wade et al., (Citation2020b),
where Foot Length is the distance between the medial malleoli and the tip of the shoe, Sole Thickness is the thickness of the sole inferior to the 1st phalangeal joint and Ankle Height is the distance between the medial malleoli and the ground. All measurements were taken immediately after performing jumping and participants kept their shoes on. The distance travelled in the air for each trial was then summed with each participant’s anthropometrically scaled heel-lift constant to calculate jump height.
Statistical analysis
Statistical analyses were performed in Prism 8 (GraphPad Software Inc, California, USA) and Python 3.7, with sub-maximal and maximal jump height conditions analysed separately. Individual jump heights measured using the FDI, BDI and the FT+C method were compared with the reference Kinematic method using Bland-Altman analysis (Bland & Altman, Citation1986), where the mean bias examined accuracy, while the SD of bias and 95% limits of agreement (LoA) examined the variability (Atkinson & Nevill, Citation1998). The Pearson coefficient of determination (R2), estimation statistics and intraclass correlation using the absolute agreement method were also calculated, including Cohen’s d effect size with bootstrapped confidence intervals (CI) outlined by Ho et al. (Citation2019). To compare maximal and sub-maximal jumping, the leg length and within-participant heel-lift distance and SD were calculated using the FDI method and examined using Bland-Altman analysis alongside Cohen’s d effect size and confidence interval. Cohen’s d effect sizes were classified as trivial (< 0.2), small (0.2–0.5), medium (0.5–0.8) and large (> 0.8).
Results
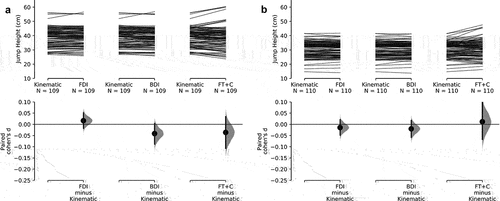
The Bland-Altman bias of BDI landing time was 0.30 ± 0.28 s (95% CI = −0.25–0.85 s) longer compared to the FDI method push-off time. Bland-Altman bias of FDI, BDI and FT+C methods during maximal and sub-maximal jumping was within 4 mm of the Kinematic method, which resulted in a trivial effect size (< 0.04). The BDI and FDI methods had the smallest bias and largest ICC for maximal and sub-maximal jumping. However, the FDI method had the smallest SD of bias, LoA and confidence interval, paired with a higher R2 value for both maximal and sub-maximal jumping. The BDI appears to have a slightly higher variability compared to the FDI method (SD of Bias, 95% LoA) although the bias, R2 value and effect size values were almost identical. The FT+C method was the worst across all measures, with SD of bias almost double of both other methods along with worse 95% LOA, R2 and ICC scores relative to the FDI and BDI methods (). However, these differences were small, as Cohen’s d effect size confidence interval for all methods in both maximal and sub-maximal jumping overlapped with zero (), indicating no statistical difference compared to the kinematic method.
Table 1. Bland-Altman analysis bias, standard deviation (SD) of bias, limits of agreement (LoA), Pearson coefficient of determination, Cohen’s d effect size and 95% confidence interval and Intraclass Correlation Coefficient (ICC) and 95% Confidence Interval of the FDI, BDI and FT+C methods compared to the Kinematic method.
Figure 2. Raw pairwise data of BDI and FT+C compared to the FDI method. Lower graphs indicate Cohen’s d effect sizes and confidence intervals. Graph A presents maximal jumping, while graph B presents indicates sub-maximal jumping.
To determine if the heel-lift distance changed due to jumping intensity, the average within-participant heel-lift distance and within-participant heel-lift SD were calculated using the FDI method and compared between maximal and sub-maximal jumping. The average within-participant heel-lift distance during sub-maximal jumping decreased by 1.3 ± 1.2 cm (95% LoA = −3.7–1.2 cm) with a large effect size of −0.815 (CI = −1.37 – −0.172) compared to maximal jumping. The SD of the average within-participant heel-lift distance during sub-maximal jumping increased by 0.2 ± 0.6 cm (95% LoA = −1.0–1.4 cm) with a small effect size of 0.416 (CI = −0.205–0.955) compared to maximal jumping. Therefore, the average heel-lift distance decreased with sub-maximal jumping, but variability was only slightly altered. Despite a decrease in the heel-lift distance, the FT+C method accuracy and variability were almost identical during both maximal and sub-maximal jumping (). The leg length during landing of sub-maximal jumping was 1.1 ± 2.0 cm (95% LoA = −2.8–5.0 cm) greater than maximal jumping.
Discussion
These results reinforce the finding from Wank & Coenning (Citation2019) and also support our first hypothesis, demonstrating that jump heights calculated using the FDI and BDI methods are on average equivalent and could be used interchangeably although BDI may have slightly higher variability compared to the FDI method ( – SD of bias and 95% LoA). For both BDi and FDI methods, Cohen’s d effect sizes were classified as trivial and confidence intervals overlapped with zero, indicating no differences compared to rigid-body kinematic modelling methods on average ().
The landing time for the BDI method was on average greater by 0.3 s compared to the push-off time for the FDI method, and thereforeb it is possible that the slightly longer time to return to normal standing during landing may result in greater variability of this method; however, the effect was very small. When examining squat jumping or drop jumping, the BDI method will likely produce accurate results and only uses a single force plate. It must be noted that while landing phases of countermovement jumping, squat jumping and drop jump should be identical, this study only examined countermovement jumping and this ought to be kept in mind when applying these methods to alternative jumping types.
As expected, the jump height calculated by the FDI and BDI methods did not result in any differences between sub-maximal and maximal jumping. The primary aim of examining sub-maximal jumping was to determine if a change in the heel-lift distance would influence the accuracy of the FT+C method, which uses an anthropometrically scaled constant to calculate the jump height. The heel-lift distance between maximal and sub-maximal jumping was reduced on average by 1.3 ± 1.2 cm (large effect size) paired with a 0.2 ± 0.5 mm increase in SD of bias (small effect size). Therefore, the FT+C method would be expected to overestimate the sub-maximal jump height by 1.3 cm on average although this should be relatively systematic as there was only a small increase in within-participant SD (variability). However, FT + C results were almost identical for both maximal and sub-maximal jumping compared to the kinematic method. This contradicted our second hypothesis and was likely due to landing with the legs in a more extended position (1.1 cm) during sub-maximal jumping compared to maximal jumping, reducing the time spent in the air. As a result, the overestimation of the distance travelled in the air when using the FT method (Kibele, Citation1998; Wade et al., Citation2020b) may be reduced during sub-maximal jumping, which counteracts the overestimation in the heel-lift constant and thus, facilitates accurate and consistent calculation of sub-maximal jump height. This further stresses the necessity of adding an anthropometrically scaled heel-lift constant to account for the FT method alone not measuring the heel-lift distance. The FT+C method is therefore a strong tool for calculating jump height without a force plate and can provide coaches and researchers with accurate results in the field. However, it should be noted that the FT+C method had worse SD of bias, 95% LoA, R2 value and ICC values than FDI and BDI methods. Therefore, if a force plate is available, the FDI or BDI methods should be employed, as both these methods have reduced variability relative to the FT+C method.
Conclusion
This study has demonstrated that the BDI method is equivalent to the FDI and should be used over the FT method in situations where FDI integration cannot be employed. The BDI method provides coaches and researchers with an additional method to examine the jump height and assuming the same landing pattern between different jump types, enables direct comparisons between countermovement jumping, drop jumping and squat jumping using a single force plate. Finally, the FT+C method appears to be able to account for changes in jumping intensity, further strengthening this method's ability to calculate the jump height in the field, although variability of this method was worse than both BDI and FDI.
Data sharing
Data have not been made available due to this data set being collected as part of a larger study which will be made publicly available at a later date.
Disclosure statement
No potential conflict of interest was reported by the author(s).
Additional information
Funding
References
- Atkinson, G., & Nevill, A. M. (1998). Statistical methods for assessing measurement error (reliability) in variables relevant to sports medicine. Sports Medicine, 26(4), 217–238. https://doi.org/10.2165/00007256-199826040-00002
- Bland, M., & Altman, D. (1986). Statistical methods for assessing agreement between two methods of clinical measurement. The Lancet, 327(8476), 307–310. https://doi.org/10.1016/S0140-6736(86)90837-8
- Bobbert, M. F., & Casius, L. J. R. (2005). Is the effect of a countermovement on jump height due to active state development? Medicine and Science in Sports and Exercise, 37(3), 440–446. https://doi.org/10.1249/01.MSS.0000155389.34538.97
- Bobbert, M. F., Gerritsen, K., Litjens, M., & van Soest, A. J. (1996). Why is countermovement jump height greater than squat jump height. Med Sci Sports Exerc, 28(11), 1402–1412. https://doi.org/10.1097/00005768-199611000-00009
- Bobbert, M. F., Mackay, M., Schinkelshoek, D., Huijing, P. A., & van Ingen Schenau, G. J. (1986). Biomechanical analysis of drop and countermovement jumps. European Journal of Applied Physiology and Occupational Physiology, 54(6), 566–573. https://doi.org/10.1007/BF00943342
- Bobbert, M. F., & Van Ingen Schenau, G. J. (1988). Coordination in vertical jumping. Journal of Biomechanics, 21(3), 249–262. https://doi.org/10.1016/0021-9290(88)90175-3
- Bogataj, Š., Pajek, M., Andrašić, S., & Trajković, N. (2020). Concurrent validity and reliability of my jump 2 app for measuring vertical jump height in recreationally active adults. Applied Sciences, 10(11), 3805. https://doi.org/10.3390/app10113805
- Buckthorpe, M., Morris, J., & Folland, J. P. (2012). Validity of vertical jump measurement devices. Journal of Sports Sciences, 30(1), 63–69. https://doi.org/10.1080/02640414.2011.624539
- Chiu, L. Z. F., & Dæhlin, T. E. (2020). Comparing numerical methods to estimate vertical jump height using a force platform. Measurement in Physical Education and Exercise Science, 24(1), 25–32. https://doi.org/10.1080/1091367X.2019.1650044
- Eagles, A. N., Sayers, M. G. L., Bousson, M., & Lovell, D. I. (2015). Current methodologies and implications of phase identification of the vertical jump: A systematic review and meta-analysis. Sports Medicine, 45(9), 1311–1323. https://doi.org/10.1007/s40279-015-0350-7
- Grozier, C. D., Cagle, G. K., Pantone, L., Rank, K. B., Wilson, S. J., Harry, J. R., Seals, S., & Simpson, J. D. (2021). Effects of medial longitudinal arch flexibility on propulsion kinetics during drop vertical jumps. Journal of Biomechanics, 118(1), 110322. https://doi.org/10.1016/j.jbiomech.2021.110322
- Harman, E. A., Rosenstein, M. T., Frykman, P. N., Rosenstein, R. M., & Kraemer, W. J. (1991). Estimation of human power output from vertical jump. The Journal of Strength & Conditioning Research, 5(3), 116–120. https://journals.lww.com/nsca-jscr/Abstract/1991/08000/Estimation_of_Human_Power_Output_from_Vertical.2.aspx
- Ho, J., Tumkaya, T., Aryal, S., Choi, H., & Claridge-Chang, A. (2019). Moving beyond P values: Data analysis with estimation graphics. Nature Methods, 16(7), 565–566. https://doi.org/10.1038/s41592-019-0470-3
- Kibele, A. (1998). Possibilities and limitations in the biomechanical analysis of countermovement jumps: A methodological study. Journal of Applied Biomechanics, 14(1), 105–117. https://doi.org/10.1123/jab.14.1.105
- Markström, J. L., & Olsson, C.-J. (2013). Countermovement jump peak force relative to body weight and jump height as predictors for sprint running performances:(in) homogeneity of track and field athletes? The Journal of Strength & Conditioning Research, 27(4), 944–953. https://doi.org/10.1519/JSC.0b013e318260edad
- McBride, J. M., Kirby, T. J., Haines, T. L., & Skinner, J. (2010). Relationship between relative net vertical impulse and jump height in jump squats performed to various squat depths and with various loads. International Journal of Sports Physiology and Performance, 5(4), 484–496. https://doi.org/10.1123/ijspp.5.4.484
- McErlain-Naylor, S., King, M., & Pain, M. T. G. (2014). Determinants of countermovement jump performance: A kinetic and kinematic analysis. Journal of Sports Sciences, 32(19), 1805–1812. https://doi.org/10.1080/02640414.2014.924055
- Miranda, D. L., Rainbow, M. J., Crisco, J. J., & Fleming, B. C. (2013). Kinematic differences between optical motion capture and biplanar videoradiography during a jump–cut maneuver. Journal of Biomechanics, 46(3), 567–573. https://doi.org/10.1016/j.jbiomech.2012.09.023
- Moir, G. L. (2008). Three different methods of calculating vertical jump height from force platform data in men and women. Measurement in Physical Education and Exercise Science, 12(4), 207–218. https://doi.org/10.1080/10913670802349766
- Morin, J.-B., Jiménez-Reyes, P., Brughelli, M., & Samozino, P. (2019). When jump height is not a good indicator of lower limb maximal power output: Theoretical demonstration, experimental evidence and practical solutions. Sports Medicine, 49(7), 999–1006. https://doi.org/10.1007/s40279-019-01073-1
- Needham, L., Evans, M., Cosker, D. P., Wade, L., McGuigan, P. M., Bilzon, J. L., & Colyer, S. L. (2021). The accuracy of several pose estimation methods for 3D joint centre localisation. Scientific Reports, 11(1), 20673. https://doi.org/10.1038/s41598-021-00212-x
- O’Malley, E., Richter, C., King, E., Strike, S., Moran, K., Franklyn-Miller, A., & Moran, R. (2018). Countermovement jump and isokinetic dynamometry as measures of rehabilitation status after anterior cruciate ligament reconstruction. Journal of Athletic Training, 53(7), 687–695. https://doi.org/10.4085/1062-6050-480-16
- Sayers, S. P., Harackiewicz, D. V., Harman, E. A., Frykman, P. N., & Rosenstein, M. T. (1999). Cross-validation of three jump power equations. Medicine & Science in Sports & Exercise, 31(4), 572–577. https://doi.org/10.1097/00005768-199904000-00013
- Vanrenterghem, J., De Clercq, D., & Van Cleven, P. (2001). Necessary precautions in measuring correct vertical jumping height by means of force plate measurements. Ergonomics, 44(8), 814–818. https://doi.org/10.1080/00140130118100
- Vanrenterghem, J., Lees, A., Lenoir, M., Aerts, P., & De Clercq, D. (2004). Performing the vertical jump: Movement adaptations for submaximal jumping. Human Movement Science, 22(6), 713–727. https://doi.org/10.1016/j.humov.2003.11.001
- Wade, L., Lichtwark, G., & Farris, D. J. (2018). Movement strategies for countermovement jumping are potentially influenced by elastic energy stored and released from tendons. Scientific Reports, 8(1), 2300. https://doi.org/10.1038/s41598-018-20387-0
- Wade, L., Lichtwark, G. A., & Farris, D. J. (2020a). Joint and muscle-tendon coordination strategies during submaximal jumping. Journal of Applied Physiology, 128(3), 596–603. https://doi.org/10.1152/japplphysiol.00293.2019.
- Wade, L., Lichtwark, G. A., & Farris, D. J. (2020b). Comparisons of laboratory-based methods to calculate jump height and improvements to the field-based flight-time method. Scandinavian Journal of Medicine & Science in Sports, 30(1), 31–37. https://doi.org/10.1111/sms.13556
- Walsh, M., Arampatzis, A., Schade, F., & Brüggemann, G. P. (2004). The effect of drop jump starting height and contact time on power,work performed, and moment of force. The Journal of Strength & Conditioning Research, 18(3), 561–566. Retrieved from http://journals.lww.com/nsca-jscr/Fulltext/2004/08000/THE_EFFECT_OF_DROP_JUMP_STARTING_HEIGHT_AND.30.aspx
- Wank, V., & Coenning, C. (2019). On the estimation of centre of gravity height in vertical jumping. German Journal of Exercise and Sport Research, 49(4), 454–462. https://doi.org/10.1007/s12662-019-00581-6