
 ?Mathematical formulae have been encoded as MathML and are displayed in this HTML version using MathJax in order to improve their display. Uncheck the box to turn MathJax off. This feature requires Javascript. Click on a formula to zoom.
ABSTRACT
Training interventions often have small effects and are tested in small samples. We used a Bayesian approach to examine the change in jump distance after different resistance training programmes. Thirty-three 18- to 45-year-old males completed one of three lower limb resistance training programmes: deadlift (DL), hip thrust (HT) or back squat (BS). Horizontal and vertical jump performance was assessed over the training intervention. Examination of Bayesian posterior distributions for jump distance estimated that the probability of a change above a horizontal jump smallest worthwhile change (SWC) of 4.7 cm for the DL group was ~12%. For the HT and BS groups, the probability of a change above the SWC was ~87%. The probability of a change above a vertical jump SWC of 1.3 cm for the DL group was ~31%. For the HT and BS groups, the probability of a change above the vertical jump SWC was ~62% and ~67%, respectively. Our study illustrates that a Bayesian approach provides a rich inferential interpretation for small sample training studies with small effects. The extra information from such a Bayesian approach is useful to practitioners in Sport and Exercise Science where small effects are expected and sample size is often constrained.
Introduction
Resistance training is often used to increase performance in power-based sports disciplines. The principle of specificity is critical to informing training regimes for achieving targeted performance improvements (Burnie et al., Citation2018; Seitz et al., Citation2014; Young, Citation2006). One approach to optimising performance is to consider the directional component of forces acting on the body during a specific exercise. Two theories – dynamic correspondence (DC) and force vector (FV) – underpin our understanding of how forces generated during exercise transfer to performance changes. Neither DC nor FV suggests that training effects are exclusive to the plane of training; rather, the theories each take different view on that plane of training. DC theory suggests that forces acting on the body during exercise are in relation to the body frame of reference (Goodwin & Cleather, Citation2016). FV theory considers the effect of forces in a global frame of reference (Zweifel, Citation2017), whereby exercises in a specific plane (horizontal or vertical) act to improve skill performance to a greater extent in that plane. For example, both the back squat (BS) and deadlift (DL) are performed in the vertical vector and share similarities with common athletic movements such as sprinting and jumping with regards to biomechanical movement and lower limb muscle recruitment patterns (Brughelli et al., Citation2011; Cormie, McGuigan, and Newton Citation2011; Buchheit et al., Citation2014; MacKenzie et al., Citation2014). These exercises are commonly included in resistance training programmess aimed at increasing sprint or jump performance for these reasons. However, debate around the use of the BS and DL for transfer of strength and power across to athletic performance has led to an increase in the use of the barbell hip thrust (HT) for improving sprint and/or jump performance (Neto, Vieira, and Gama Citation2019). The unique loading pattern of the HT has been suggested to enhance horizontal force production in sporting performance (Contreras et al., Citation2015; Loturco et al., Citation2018). A recent training study (Fitzpatrick et al., Citation2019), however, demonstrated that the question of optimal transfer from the gym to sporting performance is still unresolved.
The usual approach to statistically assessing an effect is to perform null-hypothesis significance testing (NHST). NHST procedures are based on frequentist principles, and proper interpretation requires assumptions based on a large number of exact study repeats with different samples. By definition, NHST also posits exactly one hypothesis to test – the null hypothesis – which is almost universally framed as exactly no effect (i.e. zero difference). Implicit in this process is the requirement for a power calculation such that a pre-determined effect size on a background of pre-determined variability will produce a p-value considered statistically significant (usually p < 0.05), e.g., 80% of the time. This leads to another challenge with exercise training studies; effect sizes are typically small and sample sizes are often limited; small effects estimated from small samples yield unreliable effect estimates (IntHout et al., Citation2015; Pereira et al., Citation2012), irrespective of the significance of the final p-value. There is now increasing awareness that NHST approaches do not offer as rich an inferential context as many scientists would like (Aarts et al., Citation2011; Wasserstein et al., Citation2019), and results are frequently misinterpreted (Amrhein et al., Citation2019; Greenland et al., Citation2016; Hoekstra et al., Citation2014; Pernet, Citation2017). Rather than comparing collected data to an assumed “no effect” null, the questions of interest for most scientists and practitioners are usually whether there is an effect, how big the effect might be and what is the uncertainty around that effect. Some authors have therefore advocated moving from NHST to estimation of effect sizes and uncertainty around those estimates. This idea is central to the “new statistics” (Cumming, Citation2011, Citation2014) and the magnitude-based inference (MBI) approach (Batterham & Hopkins, Citation2006). These approaches both focus on interpretation of frequentist-based confidence intervals. The MBI approach (Batterham & Hopkins, Citation2006) raised the conversation around estimate-based thinking in sport science but was shown to have sub-optimal properties for its proposed purpose (Barker & Schofield, Citation2008; Butson, Citation2017; Sainani, Citation2018; Welsh & Knight, Citation2015).
An alternative to frequentist statistical approaches are those based on Bayesian principles. While a thorough description of Bayesian methods is beyond the scope of this report, accessible introductions are provided by Kruschke and Liddell (John K. Kruschke & Liddell, Citation2017; J K. Kruschke & Liddell, Citation2018). Briefly, in the Bayesian approach, one first decides on a probabilistic model of the process under study, giving rise to a prior probability distribution that represents knowledge about the phenomena before incorporating any new data. This prior distribution is then combined, via Bayes theorem with the likelihood of gathered data – the probability of the data collected given specific parameters earlier (Etz, Citation2018) – to generate a posterior distribution (Gelman & Rohilla Shalizi, Citation2013). The entire posterior distribution is the target of inference in the Bayesian approach. Borg et al. recently suggested Bayesian methods could provide an informative approach to estimating small effect sizes in small samples indicating Bayesian methods would be useful for sport science investigators (Borg et al., Citation2018).
The availability of an entire posterior distribution rather than point estimates makes the Bayesian approach a useful methodology for quantifying the effects of training interventions on athletic performance. Practitioners often aim to quantify the effect of training programmes on physical performance outcomes such as muscular strength and power and the translation of these outcomes to athletic performance (Lockie et al., Citation2016; Paul & Nassis, Citation2015; Sperlich et al., Citation2016). Horizontal (broad) jumping ability is commonly used to assess the transfer of strength and power gains from training across to athletic performance and has been correlated with 10 m sprint velocity (Maćkała et al., Citation2015) and 100 m sprint times (Loturco et al., Citation2015). Similarly, vertical jump scores have been positively correlated with measures of sprint speed (Shalfawi et al., Citation2011) and increased lower body strength in team sports (Boraczyński et al., Citation2020) and used to distinguish between performance levels (Masaru et al., Citation2016). Thus, horizontal and vertical jump are often used as performance outcomes, and resistance training programmes are often targeted at improving horizontal and/or vertical jump performance, making exercise selection of key importance.
Restricting exercise training to a specific plane would allow for the testing of both DC and FV theory. In particular, FV theory would classify the HT as a horizontal exercise and the squat and DL as vertical exercises. A testable hypothesis based on FV theory is that the HT should increase horizontal jump performance to a greater extent than DL and squat and that BS and/or DL training should increase vertical jump performance to a greater extent than the HT. Notably, others have found that both squat and HT result in similar positive changes in horizontal jump performance (Fitzpatrick et al., Citation2019; Zweifel, Citation2017). In this study, we examined the effect of resistance training incorporating either a DL, HT, or BS on both horizontal and vertical jump performance. Faced with a small sample size and a desire to directly quantify the probability of an effect, we used Bayesian methods to answer the three questions posited above: is there an effect, how big is the effect and what is the uncertainty around the effect?
Methods
Using a parallel, repeated-measures design,we investigated changes in horizontal and vertical jump distance following 6 weeks of lower body resistance training incorporating a single exercise (either DL, HT or BS). Recreationally active participants were recruited and then randomised to one of the three lower limb resistance training regimes. After study enrolment, participants were familiarised with the jump protocols and then performed each jump for baseline measurements in an identical session 1 week later. Each participant then completed a 6-week resistance training intervention consisting of their assigned training exercise (either DL, HT or BS) only in addition to their usual activities of daily living. Following completion of the training programme, participants underwent post-intervention assessments in an identical manner to baseline.
Participants
Eligible participants were physically active males aged 18–45 years old (recreational sports participants with >3 hr/week of self-reported physical activity) but not resistance trained (no resistance training 6 months prior to study commencement). All participants were required to maintain their normal exercise/physical activity/sporting routines throughout the study to be free of musculoskeletal injury in the previous two years and had to complete a physical activity readiness questionnaire prior to beginning the study. A convenience sample of 48 participants (16 per group) was recruited. These are the same participants examined in Wilson et al. who examined the relationship between muscle adaptations to RT and tensiomyography (TMG) outcomes (Wilson et al., Citation2019). Participants were assigned to one of three training groups matched on height, mass and baseline horizontal jump distance. Of the 48 recruited participants, 10 withdrew from the study due to injuries sustained in team sports, 3 were excluded for failing to complete the training intervention (<90% attendance) and 2 were unable to complete post-intervention assessments, leaving a sample of 33 participants: BS group (n = 11): 179.3 ± 6.0 cm, 79.0 ± 17.9 kg; DL group (n = 11): 180.2 ± 6.7 cm, 78.3 ± 7.0 kg; HT group (n = 11): 182.8 ± 5.8 cm, 81.0 ± 11.5 kg.
Horizontal and vertical jump testing
Prior to both vertical and horizontal jump testing, participants completed a standardized familiarization session.
Participants received a visual demonstration of each jump technique from a qualified strength and conditioning practitioner, according to the described technique. Participants were then allowed five practice attempts, per test, which were observed by practitioners, and feedback was given to ensure correct technique. Participants completed a standardised warm-up protocol consisting of low-intensity cycling and dynamic stretches followed by assessments of horizontal and vertical jump displacement. The order of jump testing was randomised for each session. For each jump test, participants undertook three practice jumps, with 1 minute of rest between each. Following this, participants completed three maximal effort jumps, with the best score subsequently recorded. In the case of any jump attempt that was failed due to improper technique, participants were allowed one additional attempt to ensure three valid jumps.
Horizontal jump displacement was measured using a fixed tape measure and straight ruler. Participants were positioned on the start line, lining the front of their shoes with the 0 cm mark. Participants were instructed to jump horizontally as far as possible whilst maintaining their hands on their hips. Participants were not permitted to swing their arms during the jump. Participants had to land on both feet, with no secondary motions of correction, for the jump to be counted successful. A failed jump was determined if the participant moved their feet forward after the initial landing and/or the participant lost their balance upon take-off or landing. The horizontal jump distance was taken as the distance from the 0 cm mark to the back of the participant’s heel closest to the 0 cm mark.
Vertical Jump displacement was recorded using a linear transducer (Celesco, Toronto, ON, Canada), connected to a BioPacMP100 data capture system (BioPac Systems, Inc.). The transducer was fixed, directly above the participant’s head to the top of a FT700 Power cage (Fitness-technology, Melbourne, Australia). The end of the transducer cable was fixed to the centre of a dowel rod by Velcro strap. Participants stood directly underneath the transducer, placing the dowel road across their back and rested on their shoulders and maintaining its position with their hands on either side (this also acted to prevent arm swinging during jump attempts). Participants were instructed to take a pre-jump stance with their feet pointing forward and positioned 1.5x shoulder width apart. Each participant’s pre-jump position was marked and recorded using tape for replication on each jump attempt and across testing sessions. Participants were instructed to squat down to a comfortable level and then jump up as high and as fast as possible with the dowel rod maintaining contact with the upper back. A failed jump was determined if participants lost their balance upon take-off or landing and/or the dowel rod was removed from the upper back. Each jump attempt was inspected by two investigators on either side of the participant. All displacement data was recorded by Acqknowledge software (BioPac Systems, Inc.) and saved for offline analysis. Vertical jump displacement was calculated as the displacement from a participant’s standing start position and the highest point recorded at the top of each jump by the linear transducer.
Training intervention
Participants attended two supervised training sessions per week (~72 hours apart) for 6 weeks. Each group used only their respective exercise as the method of lower body training, while the rest of the programme remained consistent for all groups (). Resistance training loads were determined based on the 1RM values of each participant. Full details can be found in Wilson et al. (Citation2019). All additional exercise loads were calculated according to a combination of estimated 1RM scores and the RPE scale (scaled from 1 to 10). The programme followed a linearized progression model to ensure a gradual load progression (Fleck, Citation1999). At the end of the first session of each week, participants performed a set with as many repetitions as possible for each exercise to ensure maximum intensity of effort which may confer a training benefit (Morton et al., Citation2016). Coaches present at each session ensured that participants maintained correct exercise form and provided assistance when required. Following completion of each training session (and all 1RM testing sessions), participants were provided with 40 g of whey protein (unflavoured whey protein concentrate, Arla Food Ingredients, Netherlands) in a drink to maximise post-training anabolism.
Table 1. Linearized training protocol used for the 6-week intervention (weeks X: number of sets x number of reps). Participants had a 72-hour break between training sessions. AMRAP – as many reps as possible before failure or form was compromised. RPE scale used during sessions as a training intensity guide.
Statistical analysis
We used Bayesian regression modelling with Stan (Carpenter et al., Citation2017) via the rstanarm package (https://mc-stan.org/rstanarm/) in R (R Core Team, Citation2021) to analyse the differences in horizontal and vertical jump performance after the different RT programmes. Stan is a probabilistic programming language which uses Hamiltonian Markov Chain Monte Carlo (MCMC) with the No U-Turn sampler (NUTS) algorithm to generate posterior distributions (Hoffman & Gelman, Citation2014). Specifically, rstanarm makes it easy to write Stan statistical models using base R syntax.
Defining the model and priors
We assumed that the difference in both horizontal and vertical jump pre-to-post training intervention was (approximately) normally distributed (Lyon, Citation2014; McElreath, Citation2016):
Where diffij is the pre-to-post difference for individual i in training group j. The model shown in (1) describes the generative process for the data. Based on previous data showing statistically similar changes in jump distance following BS and HT training (Fitzpatrick et al., Citation2019; Zweifel, Citation2017), the DL group was set as the reference group. We modelled the mean difference for each group using a linear model:
Here is the exercise group-specific mean difference, β0 is the intercept term (here the mean for the reference group), β1j represents the difference in means between group j and the reference group and εij is the residual for each individual. The residuals were assumed to be normally distributed with a mean of zero and an unknown standard deviation (
) to be estimated from the data, a standard assumption in linear modelling. The Bayesian approach requires setting prior probability distributions over each parameter to be estimated. In the model above, we are estimating three parameters – β0,β1j and
. The prior distributions set over these parameters should, to some extent, reflect our expectation about the change in jump performance.
The β0 term, the mean of the reference group, was given a normally distributed prior with a mean set at the mean value of the pooled pre-to-post differences data and a standard deviation equal to the standard deviation of the pooled differences multiplied by 3. We chose the value of 3 reflecting the recommendation from Rhea (Citation2004) that a large effect size in untrained individuals over a strength training intervention was >2. This prior implies a plausible change in horizontal jump distance within 50 cm in either direction with 95% probability and a change in vertical jump within 25 cm in either direction with 95% probability (Supplementary figure 1).
The β1j term, representing the group offsets from the reference mean, was given a normally distributed prior with a mean of zero and a standard deviation as above for β0. For the horizontal jump, this again implies that the difference from change in the DL group will be within 50 cm in either direction with 95% probability, whilst for vertical jump, the difference from change in the DL group will be within 25 cm in either direction with 95% probability (Supplementary Figure 1). The priors on both the intercept and slope terms support either decrements or improvements in jump performance compared to the DL group. These priors allow the data to inform the posterior distribution, allow a physiologically credible probability space for changes in jump performance and are wide enough to limit overfitting to the data at hand.
The unknown residual standard deviation term, , was given a half-t prior, constraining the values of
to be positive as standard deviation cannot be negative. The shape parameter (degrees of freedom) was 4, the mean was 0 and the scale parameter equal to the standard deviation of the pooled jump difference multiplied by 10. This large-scale parameter was chosen to reflect our uncertainty about the value of the standard deviation of the residuals. Thus, the model and priors used were ( & Supplementary Figure 1) as follows:
Figure 1. Graphical representation of the Bayesian model used in this study. The differences are modelled by a Normal distribution with a mean for each group composed of the intercept and slope coefficient from a linear model (β0 + β1). β0 and β1 have Normal priors parameterized as in the figure. The prior for β0 is wide on the scale of the data. The prior for β1 allows for increments or decrements in performance. The residuals of the linear model are assumed normally distributed with a mean of zero and and standard deviation (σ) to be estimated from the data. The σ term is modelled by a half-t distribution. Note these distributions are not to scale. The representation follows the style of Kruschke (https://doingbayesiandataanalysis.blogspot.com/2018/02/make-model-diagrams-for-human.html) and were made available by R. Bååth (http://www.sumsar.net/blog/2013/10/diy-kruschke-style-diagrams/).
In summary, these priors reflect our expectation that there would not be large effects between the training groups, nor effects in a particular direction (i.e., any group could experience an increase or decrease in jump performance following the intervention). They also allow probability over physiologically plausible values but are wide enough to prevent overfitting or overly constraining the model. Details and code are available in the supplementary material hosted on Figshare (doi:10.6084/m9.figshare.16566474).
Calculation of typical error and smallest worthwhile change
In line with the recommendation from Swinton et al. (Swinton et al., Citation2018), we chose to examine the proportion of response above a smallest worthwhile change (SWC). A useful choice for SWC in the current context is the typical error (TE; Hopkins, Citation2000). We did not have test–retest data available to calculate a study-specific TE. Swinton et al. provide an equation for estimated TE () from a mean and coefficient of variation (CV; Swinton et al., Citation2018). Markovic et al. (Markovic et al., Citation2004) used data from 93 college-age male physical education students (i.e. a similar sample to ours) to calculate a CV of 2.4 cm for the horizontal jump and 3.3 cm for the vertical jump. Using these CV values and our pre-training mean for each jump, we calculated a horizontal jump
value of 4.7 cm and a vertical jump
value of 1.3 cm. We used these
values to set the SWC at the estimated technical measurement variation for each jump assessment and used the posterior distribution to examine the probability of the training effect exceeding this technical “noise” in measurement (i.e. the
).
Frequentist statistical modelling
We also used frequentist linear modelling via the R lm() function to compare our Bayesian analysis. Specifically, we used this frequentist analysis to demonstrate agreement in parameter estimates rather than as a mechanism to generate p-values. However, for the frequentist analysis, statistical significance was set at the conventional p ≤ 0.05. As noted by a reviewer, our sample size is very likely too small to detect a significant effect of RT on jump distance using frequentist methods, and previous power analysis on the same cohort was not directed at detecting significant changes in jump distance (Wilson et al., Citation2019). Bayesian analyses do not require frequentists power estimates. Data are presented as mean ± SD. Effect sizes are reported as Hedge’s g rather than Cohen’s d. Hedges g is preferred for small samples due to upward bias in Cohen’s d (Nakagawa & Cuthill, Citation2007). Further details and code for the statistical analyses are available in the supplementary materials hosted on Figshare (doi:10.6084/m9.figshare.16566474).
Results
Data for jump performance before and after the three resistance training programmes are displayed in (A & C) and . The changes in horizontal jump performance for each training group were as follows: DL 1.45 cm ± 8.61 cm (Hedges g 0.06 (95% CI −0.75, 0.86); 6/11 participants increased jump distance), HT 8 cm ± 5.41 cm (Hedges g 0.42 (95% CI −0.48, 1.31); 11/11 participants increased jump distance) and BS 7.67 cm ± 10.4 (Hedges g 0.37 (95% CI −0.42, 1.14); 10/11 participants increased jump distance). The changes in vertical jump performance for each training group were as follows: DL 0.645 cm 308 cm (Hedge’s g 0.15 (95% CI −0.66, 0.95); 5/11 participants increased jump distance), HT 1.79 cm ± 4.17 cm (Hedge’s g 0.34 (95% CI −0.55, 1.22); 7/11 participants increased jump distance) and BS 1.88 cm ± 4.91 cm (Hedge’s g 0.27 (95% CI −0.51, 1.04); 9/11 participants increased jump distance; B & D).
Figure 2. Jump distance (m) and differences in jump distance before (blue) and after (red) a 6-week resistance training programme. The horizontal bars show the mean for each data set, and the grey lines connect individual participant values. (A) Horizontal jump distance (m) before (blue) and after (red) a 6-week resistance training programme. (B) Groupwise differences in horizontal jump (m) for the deadlift (green), hip thrust (blue) and squat (red) groups. (C) Vertical jump distance (m) before (blue) and after (red) a 6-week resistance training programme. (D) Groupwise differences in vertical jump (m) for the deadlift (green), hip thrust (blue) and Squat (red) groups.
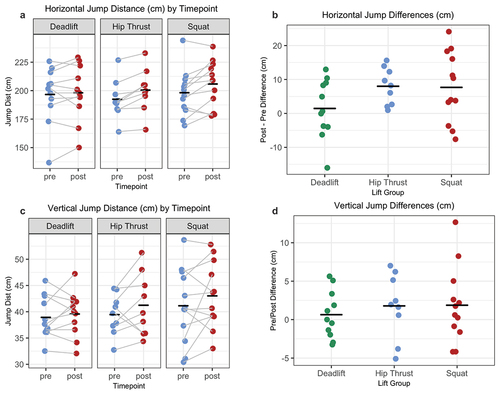
Table 2. Pre- and post-training results for horizontal and vertical jump. Jump distances are in centimetres. Data are presented as mean (sd).
The Bayesian modelling estimates for change in jump distance are shown in . For comparative purposes, estimates from the standard linear modelling procedure implemented in R are shown in . The estimated parameters are practically identical in both approaches. The Bayesian estimate of the mean change in horizontal jump for the DL group was 1.58 cm (95% HDI: −3.65, 6.82). The HT group jump distance increased by 6.32 cm (95% HDI: −1.57, 14.27, over the DL group, whilst the BS group jump distance increased by 6.01 cm (95% HDI: −1.41, 13.22) over the DL group. The estimate for the common standard deviation was 9.01 cm (95% HDI: 6.98, 11.84). The Bayesian estimate of the mean change in vertical jump for the DL group was 0.67 cm (95% HDI: −1.89, 3.24). The HT group jump distance increased by 1.10 cm (95% HDI: −2.72, 4.88) over the DL group, whilst the BS group jump distance increased by 1.18 cm (95% HDI: −2.43, 4.71) over the DL group. The estimate for the common standard deviation was 4.33 cm (95% HDI: 3.34, 5.69).
Table 3. Bayesian estimates of effects for each training modality with 95% highest density estimates (HDIs). For the deadlift group, the estimate is the mean change in horizontal jump in centimetres over the training intervention. For the other two groups, the estimate represents the difference in centimetres from the change for deadlift. HDI (95%) (Highest Density Estimate – 95%) is the interval encompassing the highest 95% of the posterior probability. Prop > SWC is the proportion of the posterior probability distribution greater than the SWC (see main text).
Table 4. Frequentist estimates of effects for each training modality from the linear model with 95% confidence intervals (95% CI), p-values and effect sizes (Hedge’s g) for the differences from the deadlift group. For the deadlift group, the estimate is the mean change in horizontal jump in centimetres over the training intervention. For the other two groups, the estimate represents the difference in centimetres from the change for deadlift.
The results of using standard frequentist NHST to assess changes in jump distance are shown in . The frequentist estimate of the mean change in horizontal jump for the DL group was 1.45 cm (95% CI: −3.86, 6.77; p: 0.58). The HT group jump distance increased by 6.55 cm (95% CI: −1.38, 14.47; p: 0.10); Hedges g: 0.85 (95% CI: −0.05, 1.73) over the DL group. The SQ group jump distance increased horizontal jump by 6.21 cm (95% CI: −1.14, 13.57; p: 0.095); Hedges g: 0.63 (95% CI: −0.19, 1.43) over the DL group. The frequentist estimate of the mean change in vertical jump for the DL group was 0.65 cm (95% CI: −1.80, 3.10; p: 0.61). The HT group jump distance increased horizontal jump by 1.14 cm (95% CI: −2.51, 4.80; p: 0.54); Hedges g: 0.3 (95% CI: −1.15, 0.55) over the DL group. The SQ group jump distance increased horizontal jump by 1.23 cm (95% CI: −2.16, 4.62; p: 0.48); Hedges g: 0.29 (95% CI: −1.08, 0.51) over the DL group.
The posterior distributions for the total estimated jump distance after training for each group are shown in , with the accompanying 95% HDIs in . The probability of a change above the SWC is indicated by the proportion of each posterior distribution to the right of the dashed line in . The probability of a change above the horizontal jump SWC for the DL group was ~12%. For the HT and BS groups, the probability of a change above the horizontal jump SWC was ~87%. The probability of a change above the vertical jump SWC for the DL group was ~31%. For the HT and BS groups, the probability of a change above the vertical jump SWC was ~62% and ~67%, respectively. This analysis of the posterior distribution directly informs us about the probability of an effect above SWC in this study.
Figure 3. Posterior densities for change in jump distance for (A) horizontal and (C) vertical jump over the training intervention. Each posterior density is shown with the modal value (black point) and a 95% highest density interval (HDI) shown as black lines extending from mode. The vertical dashed lines show the smallest worthwhile change (SWC) value calculated using the for each jump. See main text for details. Fitted versus residual values for the model (horizontal jump (B) and vertical jump (D)) demonstrating that the model meets the assumption of normally distributed residuals around zero. The variance across the residuals is also similar for each group meeting the homogeneity assumption.
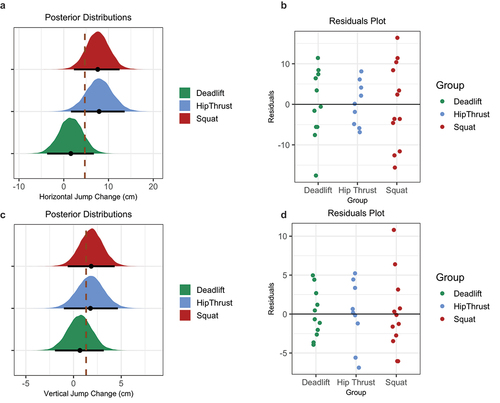
Model checking is an important part of the analysis. The standard assumptions for residuals in linear modelling apply to our data analysis. In B and D, we show that residuals are approximately normally distributed around zero and that residual variance for each group is approximately the same. There are also diagnostic checks for the Bayesian procedures we used. Supplementary Figures 2A and C illustrate that the MCMC chains used to sample from the posterior for each estimated parameter converged. The Gelman-Rubin statistic ( for all parameters) was also 1 (not shown) as recommended (Gelman & Rohilla Shalizi, Citation2013). Supplementary Figures 2B and D demonstrate that autocorrelation amongst samples from the posterior distribution was minimal, suggesting that the MCMC samples we used to characterise each posterior distribution can be considered independent.
A gold standard check for any model is to compare model performance to a separate, independent dataset,but we did not have such a dataset available. However, the posterior distribution can be used to generate simulated datasets, and these simulations can be used to check model fit. Notably, the posterior distribution incorporates both parameter estimate uncertainty and sampling uncertainty. We sample values from the posterior distribution (i.e., mean changes and standard deviations according to our model), simulate study data from these samples and examine how well these simulated datasets match the observed dataset. This process is termed posterior predictive checking. If the model is a reasonable reflection of the data generating process, then the distribution of calculated statistics (termed T(yrep) by Gelman & Carlin (Citation2014)) from the simulated data should be centred around the observed data statistics (T(y)). In particular, the tail probabilities calculated from simulated samples, termed posterior predictive (or Bayesian) p-values, should be close to 50% (Gelman & Rohilla Shalizi, Citation2013). Specifically, we use the posterior predictive check as a goodness-of-fit measure for the model (Gelman & Rohilla Shalizi, Citation2013). We generated 5000 replicated datasets (yrep) from our posterior distributions, and for each of these datasets, we calculated the mean in each training group as a test statistic, T(yrep). As seen in , the T(yrep) values distribute evenly around the actual values from the study (black vertical lines in ) for each group. For the horizontal jump, the proportion of the distribution above the black vertical lines in is 50%, 50% and 48.5% for DL, HT, and BS, respectively; for the vertical jump, the same proportions are 49%, 51% and 50%. These values suggest a model that reflects the data well.
Figure 4. Posterior predictive data for horizontal (A) and vertical jump (B) change (m) under three resistance training modalities. The histograms show the change in jump distance from 5000 datasets replicated from the model. The dark vertical line shows the change in jump distance from our study. The area to the right of the dashed line is the predicted proportion of response (>SWC) in study replications. See main text for further detail.
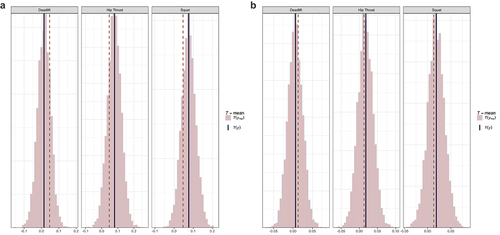
It would be useful to have some idea of the results of a future study and an indication of the uncertainty around effect size estimates in future studies. The posterior predictive distributions can also be used to estimate the proportion of means we would expect above the chosen SWC in repeat studies. Our SWC value for horizontal jump of 4.7 cm is shown in by the dashed vertical line on each histogram. The proportion of horizontal jump means for each training group exceeding this threshold were 19.8%, 78.8% and 77.9% for DL, HT and BS, respectively. The proportion of values exceeding the SWC for vertical jump were 44%, 53.8% and 54.4% for DL, HT and BS, respectively. These figures have direct probabilistic interpretations. Plausibly, future studies would demonstrate improvements in horizontal jump performance exceeding the stated for both the HT and BS but not for the DL; 40–50% of studies would be expected to show an improvement for vertical jump performance irrespective of lower limb resistance exercise.
Discussion
Using a Bayesian approach, we examined the effectiveness of three different strength training exercises for improving horizontal and vertical jump performance. Taken together, our findings address whether we are seeing an effect, the size of that effect and our uncertainty around the effect size. Bayesian analysis also gives us directly interpretable probabilities for changes in jump performance. The graphical examination of the data (), together with the Bayesian estimates of sizes (), suggest there was an effect of training programme on jump performance. The Bayesian estimates of changes in jump distance ( and ) provide an indication of how large the effect is, and examination of the posterior distributions ( and ) allows estimation of the probability we are seeing an effect of training above a chosen SWC for each jump modality. In addition, posterior predictive checking suggests we have modelled our data well and that HT and BS training are especially likely to produce detectable performance increases in horizontal jump performance over DL training in study replications. Notably, a conventional NHST approach () demonstrated the same changes in jump distance but failed to reject the null hypothesis, leading to a situation whereby neither the null or alternative hypotheses are supported, and consequently no useful conclusions can be drawn (Greenland et al., Citation2016; Pernet, Citation2017).
The HT and BS training groups showed improvements in horizontal jump distance and vertical jump height beyond the estimated TE for each exercise ( A and C). This suggests an effective, positive transfer of strength gains resulting from HT and BS training to both vertical and horizontal jump performance. Previously, increases in horizontal and vertical jump performance have been seen following HT and BS training (Contreras et al., Citation2017; Fitzpatrick et al., Citation2019; Zweifel, Citation2017), supporting our observations. Extensive knee and hip extension muscle activation whilst training the BS (Contreras et al., Citation2015; Delgado et al., Citation2019) may account for the effectiveness of BS in improving jump performance. Recently, Yokozawa et al. (Citation2019) demonstrated that knee extensor force production during the propulsive phase of a horizontal jump was positively correlated with jump distance. This suggests improved knee extensor force production following BS training (Aagaard et al. Citation2002; Chelly et al., Citation2009) may have contributed to the observed improvement in horizontal jump distance. Vertical jumping is also associated with substantial muscle activity of the knee and hip extensors (Falch et al., Citation2020; Kopper et al., Citation2013), which are heavily activated by the BS exercise, likely explaining the observed improvements in vertical jump task performance following BS training. Furthermore, the BS exercise may be considered biomechanically similar to both horizontal and vertical jumping activities according to DC theory since both involve similar directions of ground reaction forces relative to the athlete (Fitzpatrick et al., Citation2019; Goodwin & Cleather, Citation2016; Siff, Citation2000). Thus, DC provides theoretical support for the task-specific transfer of strength gains from BS training to both horizontal and vertical jumping performance.
The principles of DC theory may also explain why HT training was effective at increasing horizontal and vertical jump performance. According to DC theory, an exercise can be considered more mechanically specific to a task if increased force production occurs within similar ranges of movement as in the task (Goodwin & Cleather, Citation2016). In contrast to the BS, the HT has been shown to elicit greater hip extensor activation and force production as the hip approaches full extension (Contreras et al., Citation2013, Citation2015; Neto, Vieira, and Gama Citation2019). Indeed, similar improvements in horizontal jump distance have been observed following HT and front squat training (Contreras et al., Citation2017), supporting their inclusion in strength training programmes and supporting the inclusion of a range of appropriate exercises when seeking performance adaptation. More recently, Fitzpatrick et al. (Citation2019) demonstrated similar improvements in both vertical and horizontal jumping performance following HT training, which the authors suggested may also be explained by the principles of the DC theory. Our observations support the points made by Fitzpatrick et al. (Citation2019) regarding force generation relative to the global, fixed axis (i.e. FV theory) having limited transference to practice or performance outcomes.
In the present study, DL training was less effective compared to BS or HT training for improving horizontal or vertical jump performance. There is limited available data on the effects of DL training upon horizontal jump performance; however, the principles of DC theory may provide some explanation for our findings. Compared to the BS, the DL has been shown to elicit lower levels of knee extensor activation during the concentric phase (Ebben et al., Citation2009; Garceau et al., Citation2010) whereby knee extensor force production is required during horizontal (Yokozawa et al., Citation2019) and vertical (Maćkała et al., Citation2013) jumping. Hip extensor muscle activation has been shown to be lower during the DL compared to both the HT and BS (Andersen et al., Citation2018; McCurdy et al., Citation2018) and to progressively decrease throughout the concentric phase of the DL towards full hip extension (Nijem et al., Citation2016). Whilst the DL involves coordinated hip and knee extension during the concentric phase (Nijem et al., Citation2016), the progressive decrease in hip and knee extensor activation may limit the transfer of strength gains to horizontal and vertical jumping performance compared to the BS and HT exercises. It should be acknowledged, however, that this mechanism remains speculative without examination of the kinematic and muscle activation profile of the DL.
As with many studies in sport and exercise science, the sample size in the present study (11 per group) was small. Small sample sizes lead to unreliable point estimates, and effects from such studies are notoriously hard to reproduce (IntHout et al., Citation2015; Pereira et al., Citation2012). Using a Bayesian data analysis approach allowed us to directly visualise and estimate uncertainty relating to parameter estimates and the sampling procedure. We suggest this provides a much richer inferential approach than NHST and frequentist-based confidence intervals in this context. Specifically, the Bayesian approach allows us to directly address whether there is an effect, how big the effect might be and how sure we should be that we are seeing the effect without recourse to an assumed large number of exact study replications and accounting for the lower level of evidence in a small study.
A longstanding criticism of Bayesian approaches is the incorporation of subjective knowledge when parameterising the prior(s). Choosing values to parameterise the prior(s) may seem challenging and subjective, but some knowledge of the phenomena under study, and in the current case pragmatic physiological constraints on jump improvement after training, should lead to sensible values. In a truly Bayesian approach, priors should be constructed before any data is collected. In the current study, we took a pragmatic, empirical approach and centred the prior for the reference group (β0) on the mean of the all data we observed and at zero for the offsets (β1j) for the other two groups. This approach reflected our best estimate of an average change across training and the fact that we considered group differences could be positive or negative. Estimates from Rhea (Citation2004) of effect sizes in resistance training interventions informed the width (i.e., the standard deviation) of the β coefficient prior distributions. We used our observed standard deviation multiplied by 3 to deliberately exceed Rhea’s estimate of a large effect size for untrained individuals (Rhea, Citation2004), keeping the priors somewhat uninformative. These decisions may be considered subjective, but they explicitly incorporate prior knowledge about the expected responses to training. Where we lack context knowledge or are very uncertain, we can invoke e.g., physiological constraints and be liberal whilst remaining grounded in terms of plausible effects. Notably no scientific study is carried out without subjective decisions (Jahn & Dunne, Citation2007; Kochan, Citation2013). The Bayesian approach simply makes some of those decisions explicit rather than implicit.
Several authors have advocated for a shift away from inferences based on NHST statistics such as p-values towards estimation of effects sizes and plausibility of observed effect sizes (Cumming, Citation2014; Swinton et al., Citation2018). Bayesian methods are naturally suited to the purpose of estimation (J K. Kruschke & Liddell, Citation2018), and several authors have illustrated or suggested Bayesian approaches to small sample parameter estimation in sport science (Borg et al., Citation2018; Mengersen et al., Citation2016; Welsh & Knight, Citation2015). Whilst we have concrete sample statistics, we also entertain uncertainty about these estimates in a whole population. As we illustrate, the posterior distribution can be used to generate probability intervals for parameters of interest. These Bayesian probability intervals are directly interpretable. Notably, frequentist 95% confidence intervals are often misinterpreted in a Bayesian manner (Greenland et al., Citation2016); frequentist 95% confidence intervals actually reflect the proportion (e.g., 95%) of such intervals containing the true parameter based on hypothesized exact repeats of the study (Greenland et al., Citation2016). The posterior distribution can also be summarised using point estimates (e.g., mean or median), but this detracts from the richer inference available in the Bayesian approach and from the recognition of uncertainty around estimates.
Although not a limitation per se, both Bayesian and frequentist-based approaches to effect size estimates and uncertainty may require a paradigm shift on the part of the investigator. For Bayesian analysis, a stumbling block can be the definition of the prior distribution. We hope that the process we followed in this study helps to provide clarity to this process. Moving away from considering probability in frequentist terms, to considering probability as reflecting plausibility of effect sizes, may be difficult. However, evidence indicates that many people misinterpret frequentist estimates as if they were Bayesian (Dienes, Citation2011) and so changing outlook on probability is less likely to be a problem. The Bayesian process explicitly gives many people what they thought they were getting anyway. When making inferences on the importance of an observed effect, investigators may need to loosen their preconceptions around the p-value as an arbiter and instead look to correctly interpret interval estimates (frequentist or Bayesian) and the direction of the effect to inform their conclusions.
Conclusions
We have demonstrated how a Bayesian statistical approach can be effectively applied to provide meaningful inferences in small-scale studies in sport and exercise science. The Bayesian approach described here produces inferentially rich intervals which allow us to quantify if an effect is happening; how big that effect may be; and the degree of certainty for the effect. The present findings add to the evidence that HT and BS training can elicit greater improvements and greater probability of improvement in horizontal and vertical jump performance compared to DL training. Potential reasons for the disparity in jump performance enhancement following the three training interventions include differences in training-test specificity, with regard to muscle recruitment and active range of motion. The present data provide justification for the inclusion of both the BS and HT, rather than the DL, in resistance training programmes aimed at improving lower-limb power production and jumping performance. These findings can inform practitioner decisions regarding the selection of lower-limb resistance exercises selection for optimising improvements in sport-specific outcomes such as jumping performance. Whilst it was not the main aim of this study, our findings also suggest DC theory may be more representative of the transference between strength training and jumping performance when compared to the FV theory. Practitioners should consider the methodological approach we have outlined here when looking to make practical decisions on their data.
Supplemental Material
Download MS Word (35.5 KB)Acknowledgement
The authors would also like to acknowledge Arla Foods for providing the protein supplement used to standardise post workout nutrition in this study.
Supplementary material
Supplemental data for this article can be accessed online https://doi.org/10.1080/02640414.2022.2100676
Disclosure statement
No potential conflict of interest was reported by the author(s).
Additional information
Funding
References
- Aagaard, P., Simonsen, E. B., Andersen, J. L., Magnusson, P., & Dyhre-Poulsen, P. (2002). Increased rate of force development and neural drive of human skeletal muscle following resistance training. Journal of Applied Physiology (Bethesda, 93(4), 1318–1326. https://doi.org/10.1152/japplphysiol.00283.2002 Md.: 1985)
- Aarts, S., Winkens, B., & van Den Akker, M. (2011, December). The insignificance of statistical significance. The European Journal of General Practice, 18(1), 50–52. https://doi.org/10.3109/13814788.2011.618222
- Amrhein, V., Greenland, S., & McShane, B. (2019). Scientists Rise up against Statistical Significance. Nature, 567(7748), 305. https://doi.org/10.1038/d41586-019-00857-9
- Andersen, V., Fimland, M. S., Dag-Andrè, M., Iversen, V. M., Vederhus, T., Rockland Hellebø, L. R., Nordaune, K. I., & Saeterbakken, A. H. (2018). Electromyographic comparison of barbell deadlift, hex bar deadlift, and hip thrust exercises: A cross-over study. Journal of Strength and Conditioning Research, 32(3), 587–593. doi:10.1519/JSC.0000000000001826
- Barker, R. J., & Schofield, M. R. (2008). Inference about magnitudes of effects. International Journal of Sports Physiology and Performance, 3(4), 547–557. https://doi.org/10.1123/ijspp.3.4.547
- Batterham, A. M., & Hopkins, W. G. (2006). Making meaningful inferences about magnitudes. International Journal of Sports Physiology and Performance, 1(1), 50–57. https://doi.org/10.1123/ijspp.1.1.50
- Boraczyński, M., Boraczyński, T., Podstawski, R., Wójcik, Z., & Gronek, P. (2020). Relationships between measures of functional and isometric lower body strength, aerobic capacity, anaerobic power, sprint and countermovement jump performance in professional soccer players. Journal of Human Kinetics, 75(October), 161–175. https://doi.org/10.2478/hukin-2020-0045
- Borg, D. N., Minett, G. M., Stewart, I. B., & Drovandi, C. C. (2018). Bayesian methods might solve the problems with magnitude-based inference. Medicine and Science in Sports and Exercise, 50(12), 2609–2610. https://doi.org/10.1249/MSS.0000000000001736
- Brughelli, M., Cronin, J., & Chaouachi, A. (2011). Effects of running velocity on running kinetics and kinematics. Journal of Strength and Conditioning Research, 25(4), 933–939. https://doi.org/10.1519/JSC.0b013e3181c64308
- Buchheit, M., Samozino, P., Alexander Glynn, J., Simpson Michael, B., Al Haddad, H., Mendez-Villanueva, A., & Benoit Morin, J. (2014). Mechanical determinants of acceleration and maximal sprinting speed in highly trained young soccer players. Journal of Sports Sciences, 32(20), 1906–1913. doi:10.1080/02640414.2014.965191
- Burnie, L., Barratt, P., Davids, K., Stone, J., Worsfold, P., & Wheat, J. (2018). Coaches’ philosophies on the transfer of strength training to elite sports performance. International Journal of Sports Science & Coaching, 13(5), 729–736. https://doi.org/10.1177/1747954117747131
- Butson, M. L. (2017, November). Will the numbers really love you back: re-examining magnitude-based inference. Open Science Framework. doi:10.17605/OSF.IO/E3VS6
- Carpenter, B., Gelman, A., Hoffman, M. D., Lee, D., Goodrich, B., Betancourt, M., Brubaker, M., Guo, J., Peter, L., & Riddell, A. (2017). Stan: A probabilistic programming language. Journal of Statistical Software, 76(1), 1–32. doi:10.18637/jss.v076.i01
- Chelly, M. S., Fathloun, M., Cherif, N., Ben Amar, M., Tabka, Z., & Van Praagh, E. (2009). Effects of a back squat training program on leg power, jump, and sprint performances in junior soccer players. Journal of Strength and Conditioning Research, 23(8), 2241–2249. https://doi.org/10.1519/JSC.0b013e3181b86c40
- Contreras, B., Cronin, J., Schoenfeld, B., Nates, R., & Tiryaki Sonmez, G. (2013). Are All Hip Extension Exercises Created Equal? Strength and Conditioning Journal, 35(2), 17–22. https://doi.org/10.1519/SSC.0b013e318289fffd
- Contreras, B., Vigotsky, A. D., Schoenfeld, B. J., Beardsley, C., & Cronin, J. (2015). A comparison of gluteus maximus, biceps femoris, and vastus lateralis electromyographic activity in the back squat and barbell hip thrust exercises. Journal of Applied Biomechanics, 31(6), 452–458. doi:10.1123/jab.2014-0301
- Contreras, B., Vigotsky, A. D., Schoenfeld, B. J., Beardsley, C., McMaster, D. T., Reyneke, J. H. T., & Cronin, J. B. (2017). Effects of a six-week hip thrust vs. front squat resistance training program on performance in adolescent males: A randomized controlled trial. Journal of Strength and Conditioning Research, 31(4), 999–1008. https://doi.org/10.1519/JSC.0000000000001510
- Cormie, P., McGuigan, M. R., & Newton, R. U. (2011). Developing maximal neuromuscular power: part 2 - training considerations for improving maximal power production. Sports Medicine (Auckland, N.Z.), 41(2), 125–146. https://doi.org/10.2165/11538500-000000000-00000
- Cumming, G. (2011). Understanding The New Statistics: Effect Sizes, Confidence Intervals, and Meta-Analysis (1 ed.). Routledge.
- Cumming, G. (2014). The New Statistics: Why and How. Psychological Science, 25(1), 7–29. https://doi.org/10.1177/0956797613504966
- Delgado, J., Drinkwater, E. J., Banyard, H. G., Gregory Haff, G., & Nosaka, K. (2019). Comparison between back squat, Romanian deadlift, and barbell hip thrust for leg and hip muscle activities during hip extension. Journal of Strength and Conditioning Research, 33(10), 2595–2601. doi:10.1519/JSC.0000000000003290
- Dienes, Z. (2011). Bayesian versus orthodox statistics: Which side are you on? Perspectives on Psychological Science, 6(3), 274–290. https://doi.org/10.1177/1745691611406920
- Ebben, W. P., Feldmann, C. R., Dayne, A., Mitsche, D., Alexander, P., & Knetzger, K. J. (2009). Muscle activation during lower body resistance training. International Journal of Sports Medicine, 30(1), 1–8. https://doi.org/10.1055/s-2008-1038785
- Etz, A. (2018). Introduction to the Concept of Likelihood and Its Applications. Advances in Methods and Practices in Psychological Science, 1(1), 60–69. https://doi.org/10.1177/2515245917744314
- Falch, N., Hallvard, H. G. R., & Van den Tillaar, R. (2020). Relationship of performance measures and muscle activity between a 180° change of direction task and different countermovement jumps. Sports (Basel, Switzerland), 8(4), E47. https://doi.org/10.3390/sports8040047
- Fitzpatrick, D. A., Cimadoro, G., & Cleather, D. J. (2019). The magical horizontal force muscle? A preliminary study examining the “force-vector” theory. Sports, 7(2), 30. https://doi.org/10.3390/sports7020030
- Fleck, S. J. (1999). Periodized strength training: A critical review. The Journal of Strength & Conditioning Research, 13(1), 82–89. https://journals.lww.com/nsca-jscr/abstract/1999/02000/periodized_strength_training__a_critical_review.15.aspx
- Garceau, L., Lutsch, B., Gary, A., Szalkowski, C., Wurm, B., & Ebben, W. 2010. ‘Hamstrings, quadriceps, and gluteal muscle activation during resistance training exercises’. ISBS - Conference Proceedings Archive. https://ojs.ub.uni-konstanz.de/cpa/article/view/4415.
- Gelman, A., & Rohilla Shalizi, C. (2013). Philosophy and the practice of bayesian statistics. The British Journal of Mathematical and Statistical Psychology, 66(1), 8–38. doi:10.1111/j.2044-8317.2011.02037.x
- Gelman, A., & Carlin, J. (2014). Beyond power calculations: assessing type S (sign) and type M (magnitude) errors. Perspectives on Psychological Science: A Journal of the Association for Psychological Science, 9(6), 641–651. https://doi.org/10.1177/1745691614551642
- Goodwin, J. E., & Cleather, D. J. (2016). The biomechanical principles underpinning strength and conditioning Jeffreys, I, Moody, J 2nd . In Strength and Conditioning for Sports Performance. Routledge Chapter 6 doi:10.4324/9780429330988 .
- Greenland, S., Senn, S. J., Rothman, K. J., Carlin, J. B., Poole, C., Goodman, S. N., & Altman, D. G. (2016). Statistical tests, P values, confidence intervals, and power: A guide to misinterpretations. European Journal of Epidemiology, 31(4) , 337–350. https://doi.org/10.1007/s10654-016-0149-3
- Hoekstra, R., Morey, R. D., Rouder, J. N., & Wagenmakers, E.-J. (2014). Robust misinterpretation of confidence intervals. Psychonomic Bulletin & Review, 21(5), 1157–1164. https://doi.org/10.3758/s13423-013-0572-3
- Hoffman, M. D., & Gelman, A. (2014). The no-u-turn sampler: adaptively setting path lengths in Hamiltonian monte carlo. Journal of Machine Learning Research, 15(47), 1593–1623. doi:10.5555/2627435.2638586
- Hopkins, W. G. (2000). Measures of reliability in sports medicine and science. Sports Medicine, 30(1), 1–15. https://doi.org/10.2165/00007256-200030010-00001
- IntHout, J., Ioannidis, P. A., Borm, Goeman, J. J., & Borm, G. F. (2015). Small studies are more heterogeneous than large ones: A Meta-meta-analysis. Journal of Clinical Epidemiology, 68(8), 860–869. https://doi.org/10.1016/j.jclinepi.2015.03.017
- Jahn, R. G., & Dunne, B. J. (2007). Science of the subjective. EXPLORE, 3(3), 295–305. https://doi.org/10.1016/j.explore.2007.03.014
- Kochan, J. (2013). Subjectivity and emotion in scientific research. Studies in History and Philosophy of Science Part A, 44(3), 354–362. https://doi.org/10.1016/j.shpsa.2013.05.003
- Kopper, B., Csende, Z., Sáfár, S., Hortobágyi, T., & Tihanyi, J. (2013). Muscle activation history at different vertical jumps and its influence on vertical velocity. Journal of Electromyography and Kinesiology: Official Journal of the International Society of Electrophysiological Kinesiology, 23(1), 132–139. https://doi.org/10.1016/j.jelekin.2012.09.005
- Kruschke, J. K., & Liddell, T. M. (2017). Bayesian data analysis for newcomers. Psychonomic Bulletin & Review, 24(2) , 1–23. https://doi.org/10.3758/s13423-017-1272-1
- Kruschke, J. K., & Liddell, T. M. (2018). The bayesian new statistics: hypothesis testing, estimation, meta-analysis, and power analysis from a bayesian perspective. Psychonomic Bulletin & Review, 25(1), 178–206. https://doi.org/10.3758/s13423-016-1221-4
- Lockie, R. G., Stage, A. A., Stokes, J. J., Orjalo, A. J., Davis, D. L., Giuliano, D. V., Moreno, M. R., Risso, F. G., Lazar, A., Birmingham-Babauta, S. A., & Tomita, T. M. (2016). Relationships and predictive capabilities of jump assessments to soccer-specific field test performance in division i collegiate players. Sports (Basel, Switzerland), 4(4), E56. https://doi.org/10.3390/sports4040056
- Loturco, I., Pereira, L. A., Cal Abad, C. C., D’Angelo, R. A., Fernandes, V., Kitamura, K., Kobal, R., & Nakamura, F. Y. (2015). Vertical and horizontal jump tests are strongly associated with competitive performance in 100-m dash events. Journal of Strength and Conditioning Research, 29(7), 1966–1971. doi:10.1519/JSC.0000000000000849
- Loturco, I., Contreras, B., Kobal, R., Fernandes, V., Moura, N., Siqueira, F., Winckler, C., Suchomel, T., Adriano Pereira, L., & Rogan, S. (2018). Vertically and horizontally directed muscle power exercises: relationships with top-level sprint performance. PLOS ONE, 13(7), e0201475. https://doi.org/10.1371/journal.pone.0201475
- Lyon, A. (2014). Why Are Normal Distributions Normal? The British Journal for the Philosophy of Science, 65(3), 621–649. https://doi.org/10.1093/bjps/axs046
- Maćkała, K., Stodółka, J., Siemienski, A., & Coh, M. (2013). Biomechanical analysis of squat jump and countermovement jump from varying starting positions. Journal of Strength and Conditioning Research, 27(10), 2650–2661. https://doi.org/10.1519/JSC.0b013e31828909ec
- Maćkała, K., Fostiak, M., & Kowalski, K. (2015). Selected Determinants of Acceleration in the 100m Sprint. Journal of Human Kinetics, 45(March), 135–148. doi:10.1515/hukin-2015-0014
- MacKenzie, S. J., Lavers, R. J., & Wallace, B. B. (2014). A biomechanical comparison of the vertical jump, power clean, and jump squat. Journal of Sports Sciences, 32(16), 1576–1585. doi:10.1080/02640414.2014.908320
- Markovic, G., Dizdar, D., Jukic, I., & Cardinale, M. (2004). Reliability and factorial validity of squat and countermovement jump tests. Journal of Strength and Conditioning Research, 18(3), 551–555. https://doi.org/10.1519/1533-4287
- Masaru, T., Cross, C. L., & Willick, S. E. (2016). Predictive value of national football league scouting combine on future performance of running backs and wide receivers. Journal of Strength and Conditioning Research, 30(5), 1379–1390. https://doi.org/10.1519/JSC.0000000000001202
- McCurdy, K., Walker, J., & Yuen, D. (2018). Gluteus maximus and hamstring activation during selected weight-bearing resistance exercises. Journal of Strength and Conditioning Research, 32(3), 594–601. https://doi.org/10.1519/JSC.0000000000001893
- McElreath, R. (2016). Statistical Rethinking: A Bayesian Course with Examples in R and Stan (1 ed.). Chapman and Hall/CRC.
- Mengersen, K. L., Drovandi, C. C., Robert, C. P., Pyne, D. B., Gore, C. J., & Chen, C. W. S. (2016). Bayesian estimation of small effects in exercise and sports science. PLOS ONE, 11(4), e0147311. https://doi.org/10.1371/journal.pone.0147311
- Morton, R. W., Oikawa, S. Y., Wavell, C. G., Mazara, N., McGlory, C., Quadrilatero, J., Baechler, B. L., Baker, S. K., & Phillips, S. M. (2016). Neither load nor systemic hormones determine resistance training-mediated hypertrophy or strength gains in resistance-trained young men. Journal of Applied Physiology (Bethesda, 121(1), 129–138. https://doi.org/10.1152/japplphysiol.00154.2016 Md.: 1985)
- Nakagawa, S., & Cuthill, I. C. (2007). Effect size, confidence interval and statistical significance: A practical guide for biologists. Biological Reviews of the Cambridge Philosophical Society, 82(4), 591–605. doi:10.1111/j.1469-185X.2007.00027.x
- Neto, W. K., Lima Vieira, T., & Florencio Gama, E. (2019). Barbell hip thrust, muscular activation and performance: A systematic review. Journal of Sports Science & Medicine, 18(2), 198–206. https://www.jssm.org/jssm-18-198.xml%3EFulltext
- Neto, W. K., Vieira, T. L., & Gama, E. F. (2019). Barbell Hip Thrust, Muscular Activation and Performance: A Systematic Review. Journal of Sports Science & Medicine, 18(2), 198–206.
- Nijem, R. M., Coburn, J. W., Brown, L. E., Lynn, S. K., & Ciccone, A. B. (2016). Electromyographic and force plate analysis of the deadlift performed with and without chains. Journal of Strength and Conditioning Research, 30(5), 1177–1182. https://doi.org/10.1519/JSC.0000000000001351
- Paul, D. J., & Nassis, G. P. (2015). Testing strength and power in soccer players: The application of conventional and traditional methods of assessment. Journal of Strength and Conditioning Research, 29(6), 1748–1758. https://doi.org/10.1519/JSC.0000000000000807
- Pereira, T. V., Horwitz, R. I., & Ioannidis, J. P. A. (2012). Empirical evaluation of very large treatment effects of medical interventions. JAMA, 308(16), 1676–1684. https://doi.org/10.1001/jama.2012.13444
- Pernet, C. (2017). Null hypothesis significance testing: a guide to commonly misunderstood concepts and recommendations for good practice. F1000Research, 4(October), 621. https://doi.org/10.12688/f1000research.6963.4
- R Core Team. (2021). R: A Language and Environment for Statistical Computing. R Foundation for Statistical Computing. https://www.R-project.org/
- Rhea, M. R. (2004). Determining the magnitude of treatment effects in strength training research through the use of the effect size. Journal of Strength and Conditioning Research, 18(4), 918–920.
- Sainani, K. L. The Problem with “Magnitude-Based Inference”. (2018). Medicine and Science in Sports and Exercise, 50(10), 2166–2176. Publish Ahead of Print (April. https://doi.org/10.1249/MSS.0000000000001645
- Seitz, L. B., Reyes, A., Tran, T. T., de Villarreal, E. S., & Gregory Haff, G. (2014). Increases in lower-body strength transfer positively to sprint performance: A systematic review with meta-analysis. Sports Medicine (Auckland, N.Z.), 44(12), 1693–1702. https://doi.org/10.1007/s40279-014-0227-1
- Shalfawi, S. A. I., Sabbah, A., Kailani, G., Tønnessen, E., & Enoksen, E. (2011). The relationship between running speed and measures of vertical jump in professional basketball players: A field-test approach. Journal of Strength and Conditioning Research, 25(11), 3088–3092. doi:10.1519/JSC.0b013e318212db0e
- Siff, M. C. (2000). Biomechanical Foundations of Strength and Power Training. In Zatsiorsky, Vladimir M.(Eds.) Biomechanics in Sport (pp. 103–139). John Wiley & Sons, Ltd.https://doi.org/10.1002/9780470693797.ch6
- Sperlich, P. F., Behringer, M., & Mester, J. (2016). The effects of resistance training interventions on vertical jump performance in basketball players: A meta-analysis. The Journal of Sports Medicine and Physical Fitness, 56(7–8), 874–883. https://www.minervamedica.it/en/journals/sports-med-physical-fitness/article.php?cod=R40Y2016N07A0874
- Swinton, P. A., Stephens Hemingway, B., Saunders, B., Gualano, B., & Dolan, E. (2018). A statistical framework to interpret individual response to intervention: paving the way for personalized nutrition and exercise prescription. Frontiers in Nutrition, 5(41) . https://doi.org/10.3389/fnut.2018.00041
- Wasserstein, R. L., Schirm, A. L., & Lazar, N. A. (2019). Moving to a World Beyond “p < 0.05”. The American Statistician, 73(sup1), 1–19. https://doi.org/10.1080/00031305.2019.1583913
- Welsh, A. H., & Knight, E. J. (2015). “magnitude-based inference”: A statistical review. Medicine and Science in Sports and Exercise, 47(4), 874–884. https://doi.org/10.1249/MSS.0000000000000451
- Wilson, M. T., Ryan, A. M. F., Vallance, S. R., Dias-Dougan, A., Dugdale, J. H., Hunter, A. M., Lee Hamilton, D., & Macgregor, L. J. (2019). Tensiomyography derived parameters reflect skeletal muscle architectural adaptations following 6-weeks of lower body resistance training. Frontiers in Physiology, 10(1493) . https://www.frontiersin.org/article/10.3389/fphys.2019.01493
- Yokozawa, T., Kumagawa, D., Arakawa, H., Katsumata, Y., & Akagi, R. (2019). A biomechanical analysis of the relationship between the joint powers during the standing long jump and maximum isokinetic strength of the lower limb joints. International Journal of Sport and Health Science, 17 , 13–24. https://doi.org/10.5432/ijshs.201827
- Young, W. B. (2006). Transfer of strength and power training to sports performance. International Journal of Sports Physiology and Performance, 1(2), 74–83. https://doi.org/10.1123/ijspp.1.2.74
- Zweifel, M. (2017). Importance of horizontally loaded movements to sports performance. Strength and Conditioning Journal, 39(1), 21. https://doi.org/10.1519/SSC.0000000000000272