
 ?Mathematical formulae have been encoded as MathML and are displayed in this HTML version using MathJax in order to improve their display. Uncheck the box to turn MathJax off. This feature requires Javascript. Click on a formula to zoom.
ABSTRACT
Tactical positioning is essential for success in short-track speed skating as the race format (direct, head-to-head competition over multiple laps) prioritises finishing position over finishing time. Despite this, current research into tactical positioning treats the race’s laps as discrete, independent events. Accordingly, the aggregate metrics used to summarise each lap’s tactical positioning behaviour do not allow us to explore the sequential nature of the data, e.g., Lap 2 occurs after Lap 1 and before Lap 3. Here, we capture the sequential relationships between laps to investigate tactical positioning behaviours in short-track speed skating. Using intermediate and final rankings from 500 m, 1,000 m, and 1,500 m elite short-track races, we analyse whole-race and sub-race race sequences of group and winner tactical positioning behaviours. This approach, combined with a large dataset of races collected over eight seasons of competition ( = 4,135), provides the most rigorous and comprehensive description of tactical positioning behaviours in short-track speed skating to date. Our results quantify the time-evolving complexity of tactical positioning, offer new thoughts on race strategy, and can help practitioners design more representative learning tasks to enhance skill transfer.
Introduction
Short-track speed skating is a form of competitive ice speed skating that consists of individual events (500 m, 1,000 m, 1,500 m) and relay events (2,000 m, 3,000 m, 5,000 m) performed anticlockwise on a 111.12 m oval (International Skating Union, Citation2021). In all events, athletes and teams must qualify through several rounds of competition to reach the medal contest (e.g., heats, quarterfinals, and semi-finals), with each qualifying race characterised by multiple skaters or teams (typically four to six) racing head-to-head at speeds exceeding 11 m/s (Bullock et al., Citation2008; ISU, Citation2021). Critically, advancement through the competition and medal colour depends on an athlete’s or team’s finishing rank and not their finishing time. For example, an athlete could win/qualify from semi-final 1 with a slower finishing time than an athlete who failed to qualify from semi-final 2 (Hext et al., Citation2022). For this reason, an athlete’s decisions regarding how and when to invest their limited energy resources – both before (strategic) and during (tactical) the race – are considered essential for success (Hext et al., Citation2017, Citation2022; Muehlbauer & Schindler, Citation2011). This goal-directed regulation of exercise intensity is known as “pacing” (Abbiss & Laursen, Citation2008).
In recent years, researchers have highlighted the importance of athlete-environment interactions for understanding pacing behaviour, i.e., the outcome of the strategic and tactical decision-making process (Hettinga et al., Citation2017; Konings & Hettinga, Citation2018d; Renfree & Casado, Citation2018; Renfree et al., Citation2014; Smits et al., Citation2014). For example, factors that characterise the environment in short-track speed skating, such as the competition stage, the competition importance, and preceding race efforts, all alter pacing behaviour (Konings & Hettinga, Citation2018a, Citation2018b). Arguably the most crucial athlete-environment interaction for understanding pacing behaviour in short-track speed skating is those between athlete and opponent (Hettinga et al., Citation2017; Hext et al., Citation2022; Konings & Hettinga, Citation2018d). Konings and Hettinga (Citation2018c) showed that the high variability observed in between-race finishing times is primarily due to athletes altering their pacing behaviour to that of other opponents, particularly during the race’s early stages. Furthermore, drafting possibilities, competing for the optimum line, avoiding collisions, minimising fall risk, and overtaking all represent other athlete-opponent interactions that may cause an athlete to alter their pace (Konings et al., Citation2016; Noorbergen et al., Citation2016). For these reasons, previous research has investigated tactical positioning – i.e., athletes ranking within the race (1st, 2nd, 3rd, 4th, etc.) – to help contextualise pacing behaviour (Konings et al., Citation2016; Noorbergen et al., Citation2016), explore how it can be learned (Menting et al., Citation2019), and as a subject in its own right, based on position being the most important performance outcome (Haug et al., Citation2015; Hext et al., Citation2022; Maw et al., Citation2006; Muehlbauer & Schindler, Citation2011; Sun et al., Citation2021).
Our understanding of tactical positioning in short-track speed skating is based on two levels of analysis: group and individual behaviours. The group level of analysis focuses on the collective behaviour of all athletes in the race, with researchers quantifying the tactical importance of athlete ranking at the race start and end of each lap by using Kendall’s Tau-b, τb, to measure the similarity between athletes’ intermediate and final rankings (Haug et al., Citation2015; Konings et al., Citation2016; Maw et al., Citation2006; Menting et al., Citation2019; Muehlbauer & Schindler, Citation2011; Noorbergen et al., Citation2016; Sun et al., Citation2021). In contrast, the individual level of analysis focuses on the tactical positioning behaviours of individuals and usually those of the winner, assuming that they are the most successful at the decision-making process and, therefore, their actions are of interest (Konings et al., Citation2016). In this scenario, researchers quantify how winners position themselves at the race start and end of each lap by calculating the proportion of races where they skated at each ranking or their mean rank (Bullock et al., Citation2008; Konings et al., Citation2016; Maw et al., Citation2006; Muehlbauer & Schindler, Citation2011; Noorbergen et al., Citation2016; Sun et al., Citation2021). Typically, researchers only use the group level of analysis to infer race strategy. Although, on occasions, both group and winner behaviours are used. For example, Noorbergen et al. (Citation2016) concluded that tactical positioning is crucial from the race start in the 500 m as there was a positive association between athletes’ start position and final rankings (τb = 0.38), and 51% of winners started in first position.
Without underestimating these approaches’ insights, the methods used to investigate tactical positioning behaviours treat the race start and each lap as discrete, independent events. Accordingly, the aggregate metrics used to summarise each lap do not allow us to explore the sequential nature of the data, e.g., Lap 2 occurs after Lap 1 and before Lap 3. In , we demonstrate how this limits our capacity to understand tactical positioning by analysing the tactical positioning behaviour of winners for the “Start” and “Lap 1” in 10 races. Using traditional discrete lap analyses, shows that 50% of winners started in 1st position (mean rank: 1.8 ± 0.9), and 60% were ranked 1st at the end of Lap 1 (mean rank: 1.6 ± 0.8). The standard interpretation of such results would infer that: (1) tactical positioning is crucial from the race start, and (2) acknowledge that some variation in tactics exists based on the relatively high standard deviation in winner rank. Now let us consider the data’s sequential structure and produce ten race sequences of the form: (Start position, Lap 1 rank). First, shows that only one race had a sequence where the winner started and remained in 1st, i.e., (1, 1). Such a finding would question the discrete lap analysis’s interpretation that tactical positioning is crucial from the race start. Second, analysis of the ten sequences allows us to surmise the different winning tactical positioning behaviours, unlike the discrete lap analysis, which could only propose their presence. reveals five unique winning sequences: (1, 3), (1, 2), (1, 1), (3, 1), and (2, 1), and identifies the modal sequence as (3,1), appearing in 3 out of 10 sequences. Note that this measure of central tendency also respects the semantic definition of rank, unlike the mean, as an athlete cannot occupy a ranking of 1.8 or 1.6. Both examples highlight how techniques that capture the relationship between discrete events offer a deeper understanding of performance in sport (Borrie et al., Citation2002).
Table 1. Example analysis of winners tactical positioning behaviours ( = 10) using discrete lap analysis and sequence analysis.
State sequence analysis is a statistical framework for identifying patterns in temporally ordered lists of objects, states, or events (Lowe et al., Citation2020). Originally used for sequence matching in bioinformatics and later developed for investigating longitudinal patterns in the social sciences (Abbott & Tsay, Citation2000; Ritschard & Studer, Citation2018), researchers have since applied sequence analysis to a variety of domains (Conway et al., Citation2019; Lowe et al., Citation2020; Roux et al., Citation2019; Vanasse et al., Citation2020). We recently demonstrated the utility of state sequence analysis for investigating tactical positioning in short-track speed skating (Hext et al., Citation2022). We showed that the higher level of measurement granularity afforded by the state sequence analysis better captured the complexity of tactical positioning. In the 1,000 m event, we detected 1,269 unique sequences of group behaviour compared to the single sequence produced by the traditional discrete lap approach, which combined the aggregate metrics used to summarise each lap. We concluded that capturing this complexity offers a more detailed understanding of tactical positioning that could enhance the strategic and tactical decisions essential for success in short-track speed skating (Hext et al., Citation2022).
For these reasons, this study investigates tactical positioning in short-track speed skating using state sequence analysis. Specifically, we use static and dynamic sequence analysis to investigate group and winner tactical positioning behaviours in the 500 m, 1,000 m, and 1,500 m events. The static sequence analysis provides an overall view of tactical positioning behaviours as it treats the complete race sequence (start to end) as a single unit of analysis. The dynamic sequence analysis provides a more nuanced view of how tactical positioning evolves throughout the race as it evaluates nested race sequences with a constant endpoint (the final lap) but varying start points (e.g., Lap 1, Lap 2, Lap 3). To comment on the utility of accounting for the dataset’s sequential structure, we compare our results with the most up-to-date, complete race, discrete lap analyses of group and winner behaviours (Konings et al., Citation2016; Noorbergen et al., Citation2016). As such, we do not stratify our analysis by different environmental factors in this study.
Method
This study was approved by the Research Ethics Committee at Sheffield Hallam University, UK.
Dataset
Our dataset consisted of 10,804 races (500 m = 4,308; 1,000 m = 4,056; 1,500 m = 2,440), from 62 competitions (44 World Cups, 8 European Championships, 8 World Championships, and 2 Winter Olympic Games), over an 8-season period (2010/11 to 2017/18). All data was retrieved from the International Skating Union’s results website (https://shorttrack.sportresult.com/). For each race, the dataset contained all competitors’ starting position, intermediate rankings, and final rankings. The dataset coded starting positions from 1 (innermost track position) to (outermost track position) and intermediate/final rankings from 1 (leading athlete) to
(last athlete). Note the deliberate distinction in terminology between start position and intermediate/final rankings: at the race start, all athletes have the same ranking but different spatial positions as they are distributed across a start line perpendicular to the direction of the track (Hext et al., Citation2022).
Before analysing the dataset, we excluded races with falls, disqualifications, missing values, tied intermediate rankings, and races where the number of athletes competing was not equal to the event’s modal value, i.e., 4 athletes for the 500 m and 1,000 m, and 6 athletes for the 1,500 m. These strict inclusion criteria were in line with previous short-track speed skating research (Hext et al., Citation2022; Konings et al., Citation2016; Noorbergen et al., Citation2016). Our final dataset included 4,135 of the 10,804 races (500 m = 2,020, 46.9%; 1,000 m = 1,549, 38.2%; 1,500 m = 566, 23.2%). We provide a complete breakdown of our cleaning procedure in Supplemental .
Data analysis
Sequence definition
We consider a sequence, , as an ordered, discrete-time series of elements,
, of length,
, that can be represented as
, where
. The discrete-time series represents the points in the race where we measure athlete rank: the race start and end of each lap. Each element in the series has a state that belongs to a finite set of states that characterise tactical positioning behaviour, i.e., the state-space. We use two different state spaces to characterise tactical positioning behaviour. The first state-space characterised the group’s tactical positioning behaviours. As described in Hext et al. (Citation2022), we quantified the group’s tactical positioning behaviour by measuring the similarity between start/intermediate and final rankings in each race using Kendall’s Tau-b, τb. A Kendall’s τb = 1 represents a perfect agreement between start position/intermediate and final rankings, and a Kendall’s τb = −1 represents a perfect disagreement. The second state-space characterised the winner’s tactical positioning behaviours and included all possible athlete rankings. We summarise each event’s group and winner behaviour state-space in of the Supplemental Material.
Table 2. Most recurring group and winner tactical positioning behaviours in the 500 m, 1,000 m, and 1,500 m events.
Static and dynamic sequence formation
We formed static and dynamic sequences for each race in the dataset. illustrates this process. Our static analysis generated a complete race sequence of the group’s and winner’s tactical positioning behaviours. For example, the winner’s tactical positioning behaviour, (4, 4, 1, 1, 1, 1), indicates that the winner started and remained in 4th until Lap 2. From this point onwards, the winner was ranked first at the end of each lap. Note that in , we represent all sequences using the state-permanence-sequence format (Aassve et al., Citation2007). In this format, each successive distinct state in a sequence is given together with its duration, , so that
. Accordingly, we represent the winning sequence, (4, 4, 1, 1, 1, 1), as (4, 2) – (1, 4). Given the length of our sequences, particularly in the 1,500 m event (
15), we will use this format for the remainder of the manuscript.
Figure 1. Static and dynamic race sequence formation. First, we extract the winner (denoted by the red circle) and group tactical positioning behaviours at the race start and end of each lap. Second, we form our static and dynamic sequences. The static sequence treats the whole race as a single unit of analysis. The dynamic sequences are nested race sequences with a constant endpoint (the final lap) but varying start points (e.g., Lap 1–5, Lap 2–5, Lap 3–5). Note that we represent all sequences using the state-permanence-sequence format, i.e., each successive distinct state in a sequence is given together with its duration. For example, we represent the static winning sequence: (4, 4, 1, 1, 1, 1), as (4, 2) – (1, 4).
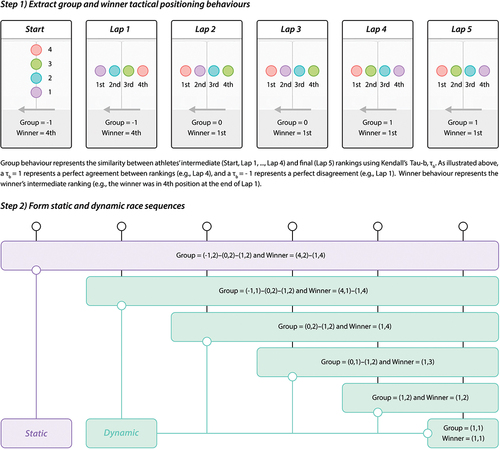
Our dynamic analysis generated nested sequences of the group’s and winner’s tactical positioning behaviours. The nested sequences had a constant endpoint (the race’s final lap) but varying lengths. The number of nested sequences for each race was equal to , where
is the number of elements in the static race sequence. Starting from Lap 1, we incremented the start point of each nested sequence by one lap until the start point equalled the race’s final lap. As demonstrated in , we create five nested sequences (Lap 1–5, Lap 2–5, … , Lap 5) from the six elements (Start, Lap 1, … , Lap 5) in the 500 m. Overall, the static and dynamic sequences formed 6, 10, and 15 sequence periods in the 500 m (4.5 laps), 1,000 m (9 laps), and 1,500 m (13.5 laps), respectively. Here, note that our analysis uses Lap 1 to represent the tactical positioning behaviours at the end of the initial half-lap in the 500 m and 1,500 m events.
Sequence metrics
For each sequence period, we calculated the number of unique sequences, , and the sequence duplication rate,
, where
is the number of races in the dataset. A sequence duplication rate of 0% indicates that no sequences are the same, and a sequence duplication rate of 100% indicates that all sequences are the same. In addition, we calculated each sequence’s absolute and relative support. A sequence’s absolute support,
, denotes the number of times the sequence occurs in the sequence period, with its relative support,
(Fournier-Viger et al., Citation2017; Hext et al., Citation2022). For example, in a dataset of 1,000 races, an absolute support of 500 would indicate that 500 races had the same sequence of tactical positioning behaviours, representing a relative support of 50%. We performed all sequence analyses in MATLAB 2021b and used the R statistical programming language (version 4.0.0) to interrogate the data.
Results
quantifies the time-evolving complexity of tactical positioning in short-track speed skating. First, note that regardless of the level of analysis (group or winner behaviour), the complexity of tactical positioning increases with race distance, i.e., the static sequence duplication rates decrease (Start – Lap ). Second, tactical positioning becomes less complex as the race progresses, i.e., the dynamic sequence duplication rates increase as the length of the nested sequences decreases. Here, the only exception is the start of the 1,500 m. Until the sequence period Lap 5–15, the group sequence duplication rates remain at 0%. In other words, all observed sequences are unique. Finally, the group tactical positioning behaviour is more complex than the winner and, as a result, converges to 100% slower. That is, the group sequence duplication rate is always lower than the winner sequence duplication rate, for each sequence period, in all events.
Figure 2. The sequence duplication rate for group and winner tactical positioning behaviours in the 500 m, 1,000 m, and 1,500 m. A sequence duplication rate of 0% indicates that no sequences are identical, and a sequence duplication rate of 100% indicates that all sequences are identical. We report the number of unique sequences detected in the brackets.
illustrates the time-evolving distribution of all detected sequences’ relative support, with reporting the most frequent sequence for each period. We provide the complete list of unique group and winner sequences and their associated support in the Supplemental Material. Note that for all events and levels of analysis, the median support is always close to 0%. In other words, exact group and winner behaviours typically do not reoccur on multiple occasions. Nevertheless, we did identify behaviours that frequently recurred, i.e., sequences with a support greater or equal to the inner fence: (Tukey, Citation1977). Generally, the most frequent sequence represents behaviours where the winner is ranked first, and the group order mimics the final rankings for the entirety of the race. The only exception is in the 1,500 m event, where we only saw this group behaviour from the sequence periods Lap 11–14 onwards. When considering the complete static race sequence, the support for these group and winner behaviours is greatest in the 500 m and decreases with race distance. When considering the dynamic race sequences, the support increases as the race progresses and is always greater for the winner, regardless of the event.
Figure 3. Boxplots of sequence relative support for group and winner tactical positioning behaviours in the 500 m, 1,000 m, and 1,500 m. Frequently recurring sequences are identified as those greater or equal to the inner fence: . Annotated sequences represent the most frequent sequence with a relative support ≥ 2%.
Discussion
We have used static and dynamic sequence analysis to investigate tactical positioning behaviours in short-track speed skating. To our knowledge, we are the first to use this statistical framework in short-track speed skating performance analysis. Whereas existing research treats laps as discrete events, we captured the sequential relationship between these events for the entire race sequence (static) and nested race sequences with a constant endpoint but varying lengths (dynamic). By combining this approach with a large dataset of races collected over eight seasons ( = 4,135), our results provide the most rigorous and comprehensive description of tactical positioning behaviours in short-track speed skating to date.
A key feature of our sequence analysis is that we do not use aggregate metrics to summarise each lap. Instead, we form sequences that capture the athlete-opponent interactions throughout – and specific to – each race. In doing so, we provide stronger evidence that reaffirms several beliefs about tactical positioning in short-track speed skating. For example, current discrete lap analyses suggest that tactical positioning is crucial from the race start in the 500 m because the start/intermediate rankings (end of each lap) positively correlate with the final rankings (Haug et al., Citation2015; Maw et al., Citation2006; Muehlbauer & Schindler, Citation2011; Noorbergen et al., Citation2016). However, as this evidence evaluates each lap independently from all other laps, it can only infer – rather than show – that winners adopt a skate-from-the-front strategy during races. In contrast, our analysis considers how each winner positioned themselves from one lap to the next for the entirety of the race. Accordingly, our finding that nearly one in every two races was won by the athlete starting and remaining in first position ( = 47.5%) is stronger empirical evidence that controlling the race from the front is a key determinant of success in the 500 m. Similarly, current discrete lap analyses propose that athletes reduce their effort to skate-from-the-front as the race distance increases (Muehlbauer & Schindler, Citation2011; Noorbergen et al., Citation2016; Sun et al., Citation2021) and that the number of ways to win increases with the race distance (Sun et al., Citation2021). The former is inferred from positive correlations between start/intermediate rankings and final rankings decreasing, and the latter is inferred from the standard deviation of the winner’s rank increasing. Our analysis provides stronger empirical evidence as we can show that: (1) the support for the skate-from-the-front strategy decreases (
= 47.5%,
= 8.1%,
= 0.5%); and (2) the winner’s sequence duplication rate decreases (
= 94.1%,
= 57.7%, and
= 0.7%), as the race distance increases.
While confirming established ideas on tactical positioning behaviours in short-track speed skating, our analysis also offers new perspectives. For example, we found that the most recurring winning behaviour in the 1,000 m and 1,500 m events was to skate-from-the-front. With seven laps to go, this sequence represented at least one in every four races ( = 30.5%, Lap 3–9;
= 24.7%, Lap 8–14). This strategy differs from current discrete lap analyses, which advocate that athletes should conserve energy by occupying a ranking other than first until Lap 6 (1,000 m) and Lap 10 (1,500 m), because there is not a strong relationship between intermediate and final rankings before this (Konings et al., Citation2016; Noorbergen et al., Citation2016). Note that we ensured this finding was due to our sequence analysis rather than due to analysing different datasets (8 seasons from 2010/11 to 2017/18 compared to 1 season from 2012/13) by replicating the traditional discrete lap analysis on our dataset. As illustrated in the Supplemental Material (Supplemental Figures 1–4), there were no discernible differences between the two datasets – and the inferences drawn – when treating laps as discrete events. Our observation of this most-recurring sequence suggests that some winners choose to forgo the physiological benefit of drafting and lead for the majority. This decision, in part, may be due to: (1) the athlete deciding that the difficulty in overtaking is more costly than having other competitors benefit from drafting them (Hoffman et al., Citation1998); and (2) attempting to mitigate the risk of falls associated with collisions (Hext et al., Citation2022). Such a strategy, therefore, may be more suited to an athlete with a higher perception of risk (Micklewright et al., Citation2015). While we do not endorse one strategy over another, it is clear that more than one winning strategy exists. Importantly, sequence analysis allows us to capture and broaden our understanding of the different race strategies adopted in short-track speed skating.
Our analysis also has several more direct implications for race strategy and performance research in short-track speed skating. First, we provide an empirical list of group and winner behaviours, and their associated support, at any stage of the race. We hope that practitioners can use this list to: (1) support the formulation of race strategies and tactics; and (2) inform the design of practice constraints and learning tasks that represent the performance environment and thus enhance the transfer of skill from training to competition (Pinder et al., Citation2011). Second, we believe both researchers and practitioners should use individual levels of analysis to inform race strategy rather than the norm of using group behaviour, as the latter is more complex and therefore appears to underestimate the importance of tactical positioning for an individual, particularly during the race’s earlier stages. For example, consider the 1,000 m event where the most recurring group and winner sequence supported a skate-from-the-front strategy. For the sequence period Lap 2–9 (89% of the total race distance), the winner support for this strategy was at least 1 in 5 races ( 22.2%) compared to at least 1 in 20 races for the group behaviour (
5.2%). Third, future work should explore detecting commonalities between unique sequences to create a taxonomy of tactical positioning behaviours. Such a taxonomy would enhance our understanding of the different race strategies and tactics utilised in short-track speed skating by capturing the latent structures of the many behaviours observed. State sequence analysis is well suited for this work because it offers a suite of metrics and methods for estimating sequence dissimilarity and building sequence typologies (Lowe et al., Citation2020; Ritschard & Studer, Citation2018). Finally, future work should replicate our sequence analysis for different race scenarios because previous research has shown that environmental factors, such as the season, competition round, whether athletes are male or female, and the competition importance, can evoke modifications in tactical positioning or pacing behaviour (Konings & Hettinga, Citation2018b; Maw et al., Citation2006; Muehlbauer & Schindler, Citation2011; Sun et al., Citation2021). Such analyses would help coaches and athletes tailor their race preparation for the relevant performance environment.
While our work represents an advance in tactical positioning analysis in short-track speed skating, we should note two limitations. First, our dataset only represented race scenarios with each event’s modal number of athletes, no falls, and no disqualifications. While these strict inclusion criteria resulted in our analysis excluding over half of each event’s data, we could compare our sequential analysis directly with results from traditional analyses. Second, our sequences only characterised group and winner behaviour at the race start and end of each lap. Accordingly, we could not characterise within-lap position changes as this exceeds the dataset’s resolution. For example, an athlete may start and finish a lap ranked 2nd but be ranked 1st halfway through the lap. Note, however, that this issue is present in all studies that use competition results to investigate tactical positioning behaviours in short-track speed skating.
Conclusion
Tactical positioning behaviour is a complex process that emerges from multiple athletes interacting continuously over many laps. By accounting for the sequential structure of these interactions, we can begin to quantify and decode this complexity. Here, we have taken the first step by providing the most rigorous and comprehensive description of tactical positioning behaviours in short-track speed skating to date. This empirical aid quantifies the time-evolving complexity of tactical positioning, offers new thoughts on race strategy based on the prevalence of winners choosing to skate-from-the-front, and can help practitioners design more representative learning tasks to enhance skill transfer.
Supplemental Material
Download Zip (1.2 MB)Disclosure statement
No potential conflict of interest was reported by the authors.
Supplementary material
Supplemental data for this article can be accessed online https://doi.org/10.1080/02640414.2023.2238162
Additional information
Funding
References
- Aassve, A., Billari, F. C., & Piccarreta, R. (2007). Strings of adulthood: A sequence analysis of young British women’s work-family trajectories. European Journal of Population / Revue européenne de Démographie, 23(3–4), 369–388. https://doi.org/10.1007/s10680-007-9134-6
- Abbiss, C. R., & Laursen, P. B. (2008). Describing and understanding pacing strategies during athletic competition. Sports Medicine, 38(3), 239–252. https://doi.org/10.2165/00007256-200838030-00004
- Abbott, A., & Tsay, A. (2000). Sequence analysis and optimal matching methods in sociology. Sociological Methods & Research, 29(1), 3–33. https://doi.org/10.1177/0049124100029001001
- Borrie, A., Jonsson, G. K., & Magnusson, M. S. (2002). Temporal pattern analysis and its applicability in sport: An explanation and exemplar data. Journal of Sports Sciences, 20(10), 845–852. https://doi.org/10.1080/026404102320675675
- Bullock, N., Martin, T. D., & Zhang, A. (2008). Performance analysis of world class short-track speed skating: What does it take to win? International Journal of Performance Analysis in Sport, 8(1), 9–18. https://doi.org/10.1080/24748668.2008.11868418
- Conway, A., Collins, P., Chang, K., Mafeld, S., Sutherland, J., & Fingleton, J. (2019). Sequence analysis of capnography waveform abnormalities during nurse-administered procedural sedation and analgesia in the cardiac catheterization laboratory. Scientific Reports, 9(1), 1–9. https://doi.org/10.1038/s41598-019-46751-2
- Fournier-Viger, P., Lin, J. C.-W., Kiran, R. U., Koh, Y. S., & Thomas, R. (2017). A survey of sequential pattern mining. Data Science and Pattern Recognition, 1(1), 54–77. https://doi.org/10.1007/978-3-030-04921-8_4
- Haug, W. B., Drinkwater, E. J., Mitchell, L. J., & Chapman, D. W. (2015). The relationship between start performance and race outcome in elite 500 m short-track speed skating. International Journal of Sports Physiology and Performance, 10(7), 902–906. https://doi.org/10.1123/ijspp.2014-0504
- Hettinga, F. J., Konings, M. J., & Pepping, G.-J. (2017). The science of racing against opponents: Affordance competition and the regulation of exercise intensity in head-to-head competition. Frontiers in Physiology, 8(February), 1–7. https://doi.org/10.3389/fphys.2017.00118
- Hext, A., Heller, B., Kelley, J. W., & Goodwill, S. R. (2017). Relay exchanges in elite short-track speed skating. European Journal of Sport Science, 17(5), 503–510. https://doi.org/10.1080/17461391.2016.1276219
- Hext, A., Hettinga, F. J., & McInernery, C. (2022). Tactical positioning in short-track speed skating: The utility of race-specific athlete-opponent interactions. European Journal of Sport Science, 23(5), 693–702. https://doi.org/10.1080/17461391.2022.2069513
- Hoffman, E., Listemann, E., McManaman, C., & Rundell, K. W. (1998). Short track speed skating: Analysis of drafting during world championship competition. Medicine & Science in Sports and Exercise, 30(Suppplement 5), 310. https://doi.org/10.1097/00005768-199805001-01765
- ISU. (2021). Special regulations and rules short-track speed skating. International Skating Union.
- Konings, M. J., & Hettinga, F. J. (2018a). The effect of preceding race efforts on pacing and short-track speed skating performance. International Journal of Sports Physiology and Performance, 13(8), 970–976. https://doi.org/10.1123/ijspp.2017-0637
- Konings, M. J., & Hettinga, F. J. (2018b). The impact of different competitive environments on pacing and performance. International Journal of Sports Physiology and Performance, 13(6), 701–708. https://doi.org/10.1123/ijspp.2017-0407
- Konings, M. J., & Hettinga, F. J. (2018c). Objectifying tactics: Athlete and race variability in elite short-track speed skating. International Journal of Sports Physiology and Performance, 13(2), 170–175. https://doi.org/10.1123/ijspp.2016-0779
- Konings, M. J., & Hettinga, F. J. (2018d). Pacing decision making in sport and the effects of interpersonal competition: A critical review. Sports Medicine, 48(8), 1829–1843. https://doi.org/10.1007/s40279-018-0937-x
- Konings, M. J., Noorbergen, O. S., Parry, D., & Hettinga, F. J. (2016). Pacing behavior and tactical positioning in 1500 m short-track speed skating. International Journal of Sports Physiology and Performance, 11(1), 122–129. https://doi.org/10.1123/ijspp.2015-0137
- Lowe, M. R., Holbrook, C. M., & Hondorp, D. W. (2020). Detecting commonality in multidimensional fish movement histories using sequence analysis. Animal Biotelemetry, 8(1), 1–14. https://doi.org/10.1186/s40317-020-00195-y
- Maw, S., Proctor, L., Vredenburg, J., & Ehlers, P. (2006). Influence of starting position on finishing position in World Cup 500 m short-track speed skating. Journal of Sports Sciences, 24(12), 1239–1246. https://doi.org/10.1080/02640410500497733
- Menting, S. G. P., Konings, M. J., Elferink-Gemser, M. T., & Hettinga, F. J. (2019). Pacing behavior of elite youth athletes: Analyzing 1500 m short-track speed skating. International Journal of Sports Physiology and Performance, 14(2), 222–231. https://doi.org/10.1123/ijspp.2018-0285
- Micklewright, D., Parry, D., Robinson, T., Deacon, G., Renfree, A., Gibson, A. S. C., & Matthews, W. J. (2015). Risk perception influences athletic pacing strategy. Medicine and Science in Sports and Exercise, 47(5), 1026–1037. https://doi.org/10.1249/MSS.0000000000000500
- Muehlbauer, T., & Schindler, C. (2011). Relationship between starting and finishing position in short-track speed skating races. European Journal of Sport Science, 11(4), 225–230. https://doi.org/10.1080/17461391.2010.499968
- Noorbergen, O. S., Konings, M. J., Micklewright, D., Elferink-Gemser, M. T., & Hettinga, F. J. (2016). Pacing behavior and tactical positioning in 500- and 1000-m short-track speed skating. International Journal of Sports Physiology and Performance, 11(6), 742–748. https://doi.org/10.1123/ijspp.2015-0384
- Pinder, R. A., Davids, K., Renshaw, I., & Araújo, D. (2011). Representative learning design and functionality of research and practice in sport. Journal of Sport and Exercise Psychology, 33(1), 146–155. https://doi.org/10.1123/jsep.33.1.146
- Renfree, A., & Casado, A. (2018). Athletic races represent complex systems, and pacing behavior should be viewed as an emergent phenomenon. Frontiers in Physiology, 9(OCT), 1–6. https://doi.org/10.3389/fphys.2018.01432
- Renfree, A., Martin, L., Micklewright, D., & St Clair Gibson, A. (2014). Application of decision-making theory to the regulation of muscular work rate during self-paced competitive endurance activity. Sports Medicine, 44(2), 147–158. https://doi.org/10.1007/s40279-013-0107-0
- Ritschard, G., & Studer, M. (2018). Sequence analysis: Where are we, where are we going? In G. Ritschard & M. Studer (Eds.), Sequence analysis and related approaches: innovative methods and applications (pp. 1–11). Springer International Publishing. https://doi.org/10.1007/978-3-319-95420-2_1
- Roux, J., Grimaud, O., & Leray, E. (2019). Use of state sequence analysis for care pathway analysis: The example of multiple sclerosis. Statistical Methods in Medical Research, 28(6), 1651–1663. https://doi.org/10.1177/0962280218772068
- Smits, B. L. M., Pepping, G.-J., & Hettinga, F. J. (2014). Pacing and decision making in sport and exercise: The roles of perception and action in the regulation of exercise intensity. Sports Medicine, 44(6), 763–775. https://doi.org/10.1007/s40279-014-0163-0
- Sun, L., Guo, T., Liu, F., & Tao, K. (2021). Champion position analysis in short track speed skating competitions from 2007 to 2019. Frontiers in Psychology, 12(December), 1–7. https://doi.org/10.3389/fpsyg.2021.760900
- Tukey, J. W. (1977). Exploratory data analysis. Addison-Wesley.
- Vanasse, A., Courteau, J., Courteau, M., Benigeri, M., Chiu, Y. M., Dufour, I., Couillard, S., Larivée, P., & Hudon, C. (2020). Healthcare utilization after a first hospitalization for COPD: A new approach of state sequence analysis based on the “6W” multidimensional model of care trajectories. BMC Health Services Research, 20(1), 1–15. https://doi.org/10.1186/s12913-020-5030-0