
ABSTRACT
The monitoring of athletes is crucial to preventing injuries, identifying fatigue or supporting return-to-play decisions. The purpose of this study was to explore the ability of Kohonen neural network self-organizing maps (SOM) to objectively characterize movement patterns during sidestepping and their association with injury risk. Further, the network’s sensitivity to detect limb dominance was assessed. The data of 67 athletes with a total of 613 trials were included in this study. The 3D trajectories of 28 lower-body passive markers collected during sidestepping were used to train a SOM. The network consisted of 1247 neurons distributed over a 43 × 29 rectangular map with a hexagonal neighbourhood topology. Out of 61,913 input vectors, the SOM identified 1247 unique body postures. Visualizing the movement trajectories and adding several hidden variables allows for the investigation of different movement patterns and their association with joint loading. The used approach identified athletes that show significantly different movement strategies when sidestepping with their dominant or non-dominant leg, where one strategy was clearly associated with ACL-injury-relevant risk factors. The results highlight the ability of unsupervised machine learning to monitor an individual athlete’s status without the necessity to reduce the complexity of the data describing the movement.
1. Introduction
Active participation in sports is regarded as one contributor to life-long health including its social benefits (Biddle et al., Citation2000; Hagger & Chatzisarantis, Citation2005). However, sport is also a major cause of injuries to the musculoskeletal system. These injuries result in loss of training hours and high socio-economic cost (Gottlob et al., Citation1999) may end an athlete’s career and in the worst-case result in degenerative diseases (Ruiz et al., Citation2002). Especially with increasing professionalization, the narrow gap between performance enhancement and injury prevention makes it crucial to identify an athlete at risk. Various screening tools have been developed in the past years, but they often lack high reliability and validity or are not of high predictive value (Bahr, Citation2016). In their meta-analysis, Bonazza et al. reported, that the Functional Movement Screen (FMS), which is a widely used screening tool for the prevention of musculoskeletal injuries, shows an intra- and inter-rater reliability of 0.81, which was rated as excellent. The tool’s predictive value showed a 2.7 times higher chance of getting injured if scoring lower than 14 in the FMS. However, concerns remained regarding validity (Bonazza et al., Citation2017). Also, the question remains how sensitive the tool is to detect an actual athlete at risk (Bahr, Citation2016).
Recent studies showed the impact of individual movement patterns on injury-related structural loadings during fast sidestepping manoeuvres (David et al., Citation2018; Dempsey et al., Citation2009; Donnelly et al., Citation2017). The results provided a clear indication that preparatory strategies such as trunk inclination, preorientation and foot strike pattern determine the knee valgus moment, which is often considered a proxy for anterior cruciate ligament (ACL) load.
Also, limb dominance was pointed out as a risk indicator (Dos’Santos et al., Citation2019). The unpredictable nature of multidirectional sports requires the athlete to perform sidestepping manoeuvres in a safe manner both with their dominant and non-dominant limb (Dos’Santos et al., Citation2019). While several studies reported no or minor biomechanical differences between limbs (Bencke et al., Citation2013; Brown et al., Citation2014; Greska et al., Citation2017; Marshall et al., Citation2015; Mok et al., Citation2018; Pollard et al., Citation2020) the study of Brophy et al. reported that males rupture the ACL of their dominant limb more often than females (Brophy et al., Citation2010). Whether or not leg dominance is indeed a risk factor for ACL injuries is to date not clear, however, the fact that some athletes do show limb differences indicates that also the movement pattern of each leg should be investigated when monitoring an athlete (Dos’Santos et al., Citation2019).
The strong evidence that a high knee frontal and transverse plane moments is of predictive value for injury risk screening is jeopardized by the problem that identifying an athlete at risk requires the definition of a load threshold (Bahr, Citation2016). But the load tolerance of the ACL is not the same for every athlete (Bahr & Krosshaug, Citation2005) and therefore defining a meaningful threshold is impossible. Also, this is in contrast to the idea that the transition between no risk and risk is not categorical but continuous and that athletes who score similarly should not end up in different groups if they happen to fall on different sides of the division line.
Modern lab technology allows researchers to investigate complex problems from different perspectives. Three-dimensional movement analysis systems can capture accurate positions and orientations of linked body segments and the use of inverse dynamics can combine the movement data with external forces to calculate joint loading. Additional features like electromyography to obtain muscle activity, pressure distribution within the shoe and other objective data can be added to further increase the amount of information and to give a more granular picture. This results in a large amount of multidimensional data which is a big advantage of modern data acquisition, but the problem arises of how to process and more importantly understand and interpret all the data. The human brain can receive, process, and remember between seven to nine items at a time (Miller, Citation1956). When reviewing the large datasets gathered through motion analysis, only the lower limb joint angles of the right leg in three dimensions already exceed this number of items. So, the researcher must decide on a preselection of parameters. From other subdisciplines employing 3D motion analysis, it was reported that these assumptions are dependent on the profession or experience of the investigator or even the institution the researcher works at (Skaggs et al., Citation2000; Watts, Citation1994). In sports biomechanics, the selection is often based on the mechanical understanding of the load-tissue interaction. However, every movement is the result of the interplay of mechanics, tissue characteristics, motor control, psychology, and others. It might therefore be impossible to identify a single cause that forces an athlete into a movement pattern with an elevated risk of injury while others will end up using a different pattern in the same situation. Additionally, the transition from one movement pattern into another is continuous – as are the risk factors, which makes data analysis even more complex and the grouping of athletes to further investigate them neglects athlete-specific factors (Bahr, Citation2016).
We summarize the state-of-the-art motion analysis approaches result in high-quality datasets. The conventional ways to approach these datasets require a reduction of the amount of data and often also force the researcher to make a-priori assumptions. This may result in a narrowed view of the dataset and eventually lead to overestimating the importance of single parameters together with loss of essential information. One solution to the raised issues is to employ Kohonen self-organizing map neural networks (Kohonen, Citation2001). These unsupervised neural networks can overcome the described problems as they can process large quantities of input data without the need to make an a-priory reduction of data (Barton et al., Citation2006). A recent paper has already shown the ability of SOMs to identify athletes who change their movement pattern during drop jumps after a fatigue protocol (Strutzenberger et al., Citation2022). With this study, we aim to assess a more complex and injury-relevant movement, namely sidestepping and will explore to what extent the SOM is sensitive to limb dominance with regard to ACL-injury-relevant joint loading. SOMs were already used to find clusters of athletes of different skill levels (Babaee Khobdeh et al., Citation2021) or shot techniques (Lamb et al., Citation2010) in Basketball. Both studies showed that SOMs outperform expert-based or standard statistical analysis when it comes to decision-making. Schöllhorn et al. used SOMs in their study to analyse javelin throwing techniques and concluded, that contrary to the expectations, there is a variety of different techniques that result in high performance, therefore strengthening the need for athlete-specific investigations (Schöllhorn & Bauer, Citation1998). Also, their results justify that SOMs can be considered the right approach for this current study about athlete-specific execution of the turning task.
The aim of this study was therefore to explore the ability of SOMs as an objective tool to assess the athlete’s individual movement pattern and monitor changes between the dominant and non-dominant limb herein. We demonstrate that the SOM can be used to relate the athlete’s movement to accepted ACL-relevant risk factors in an unsupervised manner.
2. Materials and methods
Lower body marker trajectories of athletes performing planned full-effort 90° sidestepping (David et al., Citation2017) were used to train an unsupervised neural network using Kohonen self-organizing maps (Kohonen, Citation2001).
The dataset contained 613 trials of 67 athletes in total (adults: 26 male, 31 female, age 22.6 ± 3.3 years, height 1.77 ± 0.1 m, mass 70.9 ± 0.1 kg; children: 10, age 9.8 ± 1.0 years, height 1.45 ± 0.1 m, mass 36.98 ± 6.38 kg). All participants were free of injury or pain and gave their written informed consent to participate in the study. Ethical approval for the study was given by the University’s ethical committee (Approval number 125/2015).
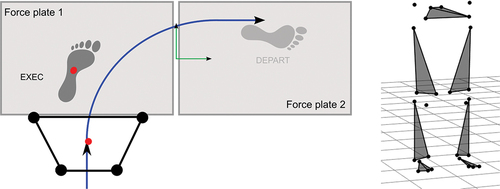
The trajectories of 28 lower body retro-reflective markers were captured by 14 infrared cameras (sampled at 200 Hz, VICON, Oxford, UK). Two floor-embedded force plates (Kistler, Winterthur) recorded the ground reaction forces (GRF) of the execution (EXEC) and depart (DEPART) contact phases of the sidestepping task (). Each athlete performed sidesteps using their dominant and non-dominant leg as the EXEC leg, where the preferred side was determined by asking them to kick a ball.
Figure 1. Left: Laboratory setup. All sidestepping trials executed to the left side were modified to match the right sidestepping trials by using the left leg as the EXEC leg and touching force plate 1 during the EXEC contact. The black trapezium represents the pelvis segment with the four pelvis markers that were used to calculate the pelvis centre at the initial touch-down of the EXEC contact. The green coordinate system represents the global reference frame. Right: 3D position of the lower-body markers on the pelvis, thighs, shanks and feet.
Inverse kinematics and dynamics were carried out using AnyBody (V6, Aalborg, Denmark) to calculate the 3D lower-limb joint angles and internal joint moments. For this purpose, kinematic and kinetic data were filtered with a recursive 2nd order low pass filter with a cut-off frequency of 20 Hz (Kristianslund et al., Citation2012).
MATLAB 2020b (The Mathworks) was used for all the following steps. As the dataset contained sidestepping to the left and the right, the marker positions were mirrored, and the GRF and GRF moments were rotated around the global reference frame which was placed centrally between the two force plates in case athletes turned to the left and used force plate 2 for the EXEC contact. After this procedure, all sidesteps were executed to the right, with the left leg touching Force Plate No.1 during the EXEC contact and the right leg touching Force Plate No. 2 during the DEPART contact. The origin of the global reference frame was placed between the two force plates (see ). This process ensured, that the neural network was not biased by sidestepping either to the left or the right side.
The marker trajectories, joint angles and moments and the GRF were time-normalized to the ground contact of the EXEC contact, using the vertical GRF. Touch down and take off were the first and last instances where the GRF crossed a threshold of 20 N.
To test the SOM’s ability to be used as a tool to screen the ACL-relevant load that is related to specific movement patterns, we extracted factors relevant to an ACL injury which were knee abduction moment (Nm/m*kg−1) and knee and hip joint angles to account for the leg alignment, in the following referred to as hidden variables. The idea behind relating the movement pattern to the hidden variables is, that they have to be represented in the training data, in this case, the joint angles, although their relationship to this input data is not clear. The hidden variables are not used for the training process. With this approach, we aimed to identify movement patterns, that will cross areas of increased injury risk of ACL-relevant joint loading, therefore being related to increased injury risk.
In the next step, all lower-limb marker trajectories were space-corrected. To ensure that the distance from the global reference frame does not bias the input data for the neural network, the centre of the four pelvis markers at the instance of the touch-down of the EXEC contact was calculated and subtracted from the time-normalized marker trajectories (). With this, the confounding effect of the absolute position of the body in the global reference frame was removed. In other words, all athletes started the EXEC contact at the same spot. Any different movement trajectory from this point is an expression of their movement strategy.
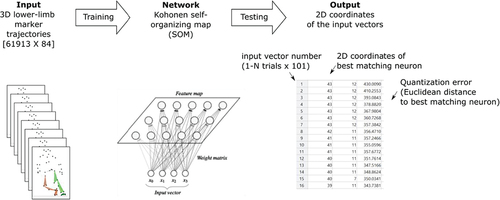
Finally, one matrix was created (61913 × 84) containing all 613 trials with 101 data points in each (613 × 101 = 61913) with the 84 marker trajectories in the 61913 rows to generate the input data set for the neural network.
An unsupervised learning Kohonen self-organizing map (SOM) neural network was trained with the marker trajectories (Kohonen, Citation2001) using the SOM Matlab Toolbox (V 2.1). The input layer consisted of a matrix of 61,913 input vectors. The columns of the input matrix were normalized by subtracting the mean of each input column and dividing it by its standard deviation upon presenting them to the network. The initial connection weights of the neurons are set by the first two principal components of the input dataset. The SOM was trained using a Gaussian neighbourhood relationship of the weights and the default settings as described in the SOM Toolbox (http://www.cis.hut.fi/somtoolbox/, initialization: linear, algorithm: batch, lattice: hexagonal, map size: small, training: short).
For a more in-depth description of the SOMs functionality, we refer to Kohonen (Citation2001).
To use the hidden variables, the following approach was taken: For each input vector of the training data, also data for the hidden variables are present (i.e., for 101 marker trajectory vectors, also 101 joint moment vectors exist). The vector numbers that were associated with a single best-matching neuron were extracted (). Then, these vector numbers were used to extract the according hidden variable vectors (i.e., the joint moment of that specific posture) and the mean of these hidden variable vectors was calculated. By doing so, each posture that was identified by the SOM could be associated with the hidden variable of choice.
Figure 2. Workflow of training and testing a Kohonen self-organizing map with 3D marker trajectories, leading to the selection of the best matching neuron and its quantization error.
3. Results
After initialization, the Kohonen layer consisted of 1247 neurons (determined by the size of the input matrix), distributed over a 43 × 29 rectangular map with a hexagonal neighbourhood topology of each neuron (). The size of the map is determined automatically when initializing the SOM with the target to represent the variability in the training data sufficiently. This means that the 61913 input postures were reduced to 1247 relevant postures to describe the whole data set. From the 2D trajectory of the best-matching neurons on the map (see ) one can reconstruct the movement of a specific input trial from the codebook vectors representing the movement patterns in the SOM weights. With this, the movement trajectory of an athlete can be followed and also compared to either other athletes or within the same athlete to monitor changes. From it becomes visible that the movement trajectory of four different athletes follow quite distinct paths on the 2D SOM.
Figure 3. Results gained with the trained SOM. a) plane plot of the SOM showing the content of the single neurons that can be reconstructed into a stick figure b) movement trajectories of four selected athletes, showing distinct paths on the SOM. The coloured squares indicate the neurons that were hit by the athlete’s movement trajectory. c) distribution of the timing during the EXEC contact (%) added as a hidden variable to the SOM. The colour change indicates the change of time. d–g) visualization of the movement trajectories of sidestepping trials towards the preferred (black) and non-preferred (red) sides of four randomly selected athletes. h–k) distribution of the knee flexion and adduction angle, hip flexion angle and knee adduction moment added as hidden variables to the SOM. The colour coding represents the value of the respective parameter.
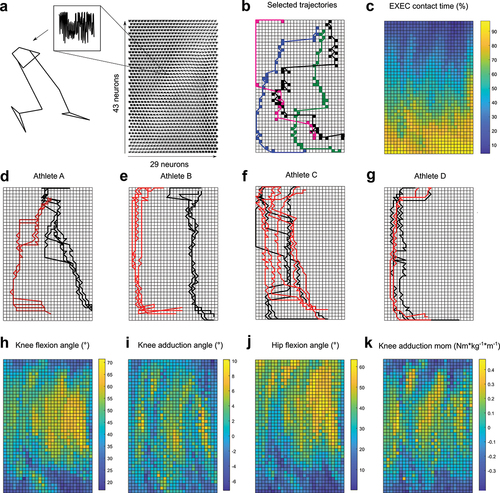
In combination with the 2D coordinates and the quantisation error (see ), additional hidden variables can be used to label the SOM. The first of these was the time instance (%) during the EXEC contact. As can be deducted from , the distribution of the postures over the SOM is very smooth concerning their occurrence in time during the EXEC contact. With this, zones of interest e.g., in terms of injury risk can be identified on the map. Most non-contact injuries occur during the weight acceptance phase which refers to approximately the first 30% of the contact phase (the upper part of the SOM in ). Also, the number of neurons (representing similar but discrete instances of postures along movement patterns) associated with each of the phases during the ground contact is different between athletes, as can be appreciated from . While the pink trajectory shows the highest resolution (number of neurons per phase) during the first 40% of the contact, the black trajectory is showing a higher resolution during 50 to 60% and the green one dominates the last 20% of the contact phase. Taking this one step further changes to the movement trajectory within one athlete can be monitored. The maps in show the trajectories of four different athletes and the trials towards their preferred (black) and non-preferred (red) directions. While athletes A and B show clear changes in their movement trajectories, athletes C and D do not seem to be affected by changing the movement direction. The same procedure can be done with data pre- and post-injury, or to monitor fatigue.
Finally, adding more hidden variables such as joint angles or moments can be used to interpret the path of the trajectory. The maps in display the distribution of the knee’s sagittal and frontal and the hip’s sagittal joint angle as well as the frontal knee joint moment. These variables were chosen for illustration as they are related to knee joint injuries. By projecting the trajectories on these maps, it becomes possible to investigate, whether an athlete crosses an area of high joint loading or joint positions with a high risk of injury. Also, the aforementioned changes in the path of the trajectory can directly be translated into changes in the joint angles and moments. The change of movement path of athletes A and B from the preferred to the non-preferred side results in a decrease in knee and hip flexion and an increase in knee abduction, which is more likely to result in a collapse of the knee joint. Athletes C and D show this movement strategy for all their trials, which could indicate that they are in general at higher risk for knee joint injuries.
4. Discussion
The results of this study demonstrated the power of the SOM to reduce the dimensionality of a large dataset of 61913 input vectors to 1247. The reduction of dimensionality refers to visualising an 84-dimensional problem on a two-dimensional map of neurons. This leads to the emergence of fundamental patterns of the movement arranged on the SOM according to their similarities. This is done with some loss of detail while retaining most of the information content as proven by the ability to reconstruct an entire movement pattern from the stored vectors of the SOM. Further, this is a data-driven approach, which did not require any assumptions or hypotheses for data reduction.
The visualization of the marker trajectories during sidestepping using a Kohonen self-organising map allows for a new way to investigate individual movement patterns and the associated research questions. The SOM itself can be used to understand the distribution of the different postures along the individual movement trajectories. The option to examine other hidden variables such as time gives insight into the proportion of time taken within the different phases of the movement. This does not mean that an athlete spends more time in the weight acceptance phase, but the resolution of the SOM for this athlete is higher in this phase (indicated by the number of neurons in this phase), meaning that the differences (i.e., multi-dimensional distances) between the single input vectors are higher for this athlete than for the other examples chosen for . By following the black trajectory in , it can be observed that the athlete shows more knee and hip flexion of the execution leg than the other athletes, suggesting that a higher number of different postures were achieved. Evaluating the lower limb joint angles as hidden variables as with time could be one way of gaining deeper insight into these individual movement patterns. It has to be mentioned that time or joint angles were not included in the input vectors used for training, thus the smooth distribution of the timing () confirms the quality of the learning process based purely on pre-processed marker positions.
Taking this one step further, information associated with injury risk such as joint moments can also be evaluated as hidden variables. In this way, the user can take advantage of the hidden relationships between e.g., the movement and the actual joint loading. With this, it becomes possible to identify zones on the map, where several risk factors fall together, such as a high knee valgus moment during the weight acceptance phase (Boden et al., Citation2010; Dempsey et al., Citation2009; Donnelly et al., Citation2017). A movement trajectory that is travelling through this zone could identify an athlete with a higher risk of injury. However, data including injured athletes is necessary, which was not the case for the current study. In particular, longitudinal data that includes athletes before and after an injury would be beneficial to understand whether their movement pattern was increasing their injury risk.
The results displayed in show the network’s sensitivity to limb dominance. Although limb dominance as a risk factor is to date still questionable, it is used for return-to-play decisions. If a test detects a difference between limbs, the athlete is supposed to be not ready to return to the pitch. While the concept of symmetry is generally questionable, the variable that is chosen to calculate the differences is subjective. So instead of calculating a ratio between legs, our proposed approach is to assess whether the movement pattern differs between legs and whether one of the trajectories is passing through a zone of high joint loading within the map.
The advantage of using a network as presented in this study is, that once the network is trained and the associated hidden variables are linked, it is not necessary anymore to acquire these hidden variables. This is supported by an acceptable good correlation between the joint moments calculated via the inverse dynamics approach and the reconstructed joint moments from the SOM (e.g., r = 0.7 for the knee joint moments). To monitor a future athlete, only the movement trajectories have to be collected and expensive equipment such as force plates and time-consuming calculations for inverse dynamics are not needed.
This approach is completely different from the screening tools that are commonly used. There is no need to define thresholds for joint loading or other risk factors, which was critically discussed recently (Bahr, Citation2016). An athlete who is closer to the centre of a risk zone will be more likely to be exposed to an injury-relevant load. Also, there is no need to group athletes according to any hypotheses, which always contain the risk of missing effects or choosing a grouping variable that is not discriminative. Therefore, a SOM is a sensitive tool, to highlight individual movement patterns and given its mode of operation it offers the identification of risk.
A distinct advantage of the proposed method is the gradual change that is distributed across the map. With this, the effect of small changes in the movement on the overall movement pattern can be visualized. Another important benefit of the proposed method is its flexibility. If the research question focuses on the ankle instead of knee injuries, the same map can be used but labelled with ankle-relevant latent parameters. Also, the SOM can be used to monitor athletes, by observing how their trajectories on the 2D SOM change over time, e.g., indicating a movement towards or away from identified risk zones. The advances in pose estimation would allow feeding the network with other features such as joint angles or even parameterised images. For example, this could be used for direct feedback to the athlete in the form of warnings if risky postures are detected repeatedly.
It has to be mentioned that the used data set does not contain data from injured athletes. Therefore, no conclusion can be drawn towards the predictive value of the SOM as an injury screening tool. However, this was also not the aim of the study. Also, we only included the lower-body marker trajectories as upper-body markers were not present for all included athletes. Where whole-body movements contribute to injury risk, the additional data could improve the sensitivity of the method.
Future investigations should also take other network settings into account. For the present study, mainly default settings were used. The study of Serrien et al. reported the influence of different training settings on the training and quantization error of the SOM (Serrien et al., Citation2017). The topographic error with the current setting was 0.12 which is slightly higher when compared to the results of the optimization study results of Serrien et al (Serrien et al., Citation2017). However, by taking a look at the reconstruction accuracy of the knee moment data, we are confident, that our results are based on sufficient accuracy, however, improvements can and should be achieved in the future.
Another point to discuss is the normalization method. For the presented results, the input matrix was normalized column-wise by subtracting the mean of each column and dividing the result by the column’s standard deviation. This ensured that all variables were centred around zero and had a spread of ± one standard deviation. However, this form of normalization retains the effects of different body heights. We argue that for this study – namely to identify different movement patterns, the outcome is not affected by different body heights. We could not find clusters of movement patterns of the adults and the children, which would have been caused by their different heights. It seems that the large differences in the horizontal movement of the athletes were more informative to the network than the smaller differences in the vertical displacement. Also, for this study, within-participant changes were the main focus. However, different normalization methods should be considered depending on the research question.
5. Conclusion
Kohonen self-organizing maps are a useful method to investigate the outcome of different movement patterns without the need for assumptions or grouping of athletes according to global parameters. Further, the network is sensitive to limb dominance and as presented earlier to fatigue. They can highlight how small adaptations in the movement pattern influence the movement pattern. In combination with the advances in posture estimation, they can be used for feedback training or athlete evaluation.
Acknowledgments
The authors would like to thank the International Society of Biomechanics in Sports for supporting the collaboration between the authors with an early career travel grant.
Disclosure statement
No potential conflict of interest was reported by the author(s).
Additional information
Funding
References
- Babaee Khobdeh, S., Yamaghani, M. R., & Khodaparast Sareshkeh, S. (2021). Clustering of basketball players using self-organizing map neural networks. Journal of Applied Research on Industrial Engineering, 8(4), 412–428. https://doi.org/10.22105/jarie.2021.276107.1270
- Bahr, R. (2016). Why screening tests to predict injury do not work-and probably never will: A critical review. British Journal of Sports Medicine, 50(13), 776–780. https://doi.org/10.1136/bjsports-2016-096256
- Bahr, R., & Krosshaug, T. (2005). Understanding injury mechanisms: A key component of preventing injuries in sport. British Journal of Sports Medicine, 39(6), 324–329. https://doi.org/10.1136/bjsm.2005.018341
- Barton, G., Lees, A., Lisboa, P., & Attfield, S. (2006). Visualisation of gait data with Kohonen self-organising neural maps. Gait & Posture, 24(1), 46–53. https://doi.org/10.1016/j.gaitpost.2005.07.005
- Bencke, J., Curtis, D., Krogshede, C., Jensen, L. K., Bandholm, T., & Zebis, M. K. (2013). Biomechanical evaluation of the side-cutting manoeuvre associated with ACL injury in young female handball players. Knee Surgery, Sports Traumatology, Arthroscopy, 21(8), 1876–1881. https://doi.org/10.1007/s00167-012-2199-8
- Biddle, S., Fox, K. R., & Boutcher, S. H. (2000). Physical activity and psychological well-being (Vol. 552). Routledge London.
- Boden, B. P., Sheehan, F. T., Torg, J. S., & Hewett, T. E. (2010). Noncontact anterior cruciate ligament injuries: Mechanisms and risk factors. The Journal of the American Academy of Orthopaedic Surgeons, 18(9), 520. https://doi.org/10.5435/00124635-201009000-00003
- Bonazza, N. A., Smuin, D., Onks, C. A., Silvis M. L., & Dhawan A. (2017). Reliability, validity, and injury predictive value of the functional movement screen: A systematic review and meta-analysis. The American Journal of Sports Medicine, 45(3), 725–732. https://doi.org/10.1177/0363546516641937
- Brophy, R., Silvers, H. J., Gonzales, T., & Mandelbaum, B. R. (2010). Gender influences: The role of leg dominance in ACL injury among soccer players. British Journal of Sports Medicine, 44(10), 694–697. https://doi.org/10.1136/bjsm.2008.051243
- Brown, S. R., Wang, H., Dickin, D. C., & Weiss, K. J. (2014). The relationship between leg preference and knee mechanics during side stepping in collegiate female footballers. Sports Biomechanics / International Society of Biomechanics in Sports, 13(4), 351–361. https://doi.org/10.1080/14763141.2014.955047
- David, S., Komnik, I., Peters, M., Funken, J., & Potthast, W. (2017). Identification and risk estimation of movement strategies during cutting maneuvers. Journal of Science & Medicine in Sport / Sports Medicine Australia, 20(12), 1075–1080. https://doi.org/10.1016/j.jsams.2017.05.011
- David, S., Mundt, M., Komnik, I., & Potthast, W. (2018). Understanding cutting maneuvers – the mechanical consequence of preparatory strategies and foot strike pattern. Human Movement Science, 62, 202–210. https://doi.org/10.1016/j.humov.2018.10.005
- Dempsey, A. R., Lloyd, D. G., Elliott, B. C., Steele, J. R., & Munro, B. J. (2009). Changing sidestep cutting technique reduces knee valgus loading. The American Journal of Sports Medicine, 37(11), 2194–2200. https://doi.org/10.1177/0363546509334373
- Donnelly, C. J., Chinnasee, C., Weir, G., Sasimontonkul, S., & Alderson, J. (2017). Joint dynamics of rear- and fore-foot unplanned sidestepping. Journal of Science & Medicine in Sport / Sports Medicine Australia, 20(1), 32–37. https://doi.org/10.1016/j.jsams.2016.06.002
- Dos’santos, T., Bishop, C., Thomas, C., Comfort, P., & Jones, P. A. (2019). The effect of limb dominance on change of direction biomechanics: A systematic review of its importance for injury risk. Physical Therapy in Sport, 37, 179–189. https://doi.org/10.1016/j.ptsp.2019.04.005
- Gottlob, C. A., Baker, C. L., Pellissier, J. M., & Colvin, L. (1999). Cost effectiveness of anterior cruciate ligament reconstruction in young adults. Clinical Orthopaedics & Related Research, 367, 272–282. https://doi.org/10.1097/00003086-199910000-00034
- Greska, E. K., Cortes, N., Ringleb, S. I., Onate, J. A., & Van Lunen, B. L. (2017). Biomechanical differences related to leg dominance were not found during a cutting task. Scandinavian Journal of Medicine & Science in Sports, 27(11), 1328–1336. https://doi.org/10.1111/sms.12776
- Hagger, M., & Chatzisarantis, N. (2005). The social psychology of exercise and sport. McGraw-Hill Education (UK).
- Kohonen, T. (2001). Self-organizing maps (Vol. 30). Springer.
- Kristianslund, E., Krosshaug, T., & van den Bogert, A. J. (2012). Effect of low pass filtering on joint moments from inverse dynamics: Implications for injury prevention. Journal of Biomechanics, 45(4), 666–671. https://doi.org/10.1016/j.jbiomech.2011.12.011
- Lamb, P., Bartlett, R., & Robins, A. (2010). Self-organising maps: An objective method for clustering complex human movement. International Journal of Computer Science in Sport, 9(1), 20–29.
- Marshall, B., Franklyn-Miller, A., Moran, K., King, E., Richter, C., Gore, S., Strike, S., & Falvey, É. (2015). Biomechanical symmetry in elite rugby union players during dynamic tasks: An investigation using discrete and continuous data analysis techniques. BMC Sports Science, Medicine and Rehabilitation, 7(1), 1–13. https://doi.org/10.1186/s13102-015-0006-9
- Miller, G. A. (1956). The magical number seven, plus or minus two: Some limits on our capacity for processing information. Psychological Review, 63(2). https://doi.org/10.1037/h0043158
- Mok, K.-M., Bahr, R., & Krosshaug, T. (2018). Reliability of lower limb biomechanics in two sport-specific sidestep cutting tasks. Sports Biomechanics / International Society of Biomechanics in Sports, 17(2), 157–167. https://doi.org/10.1080/14763141.2016.1260766
- Pollard, C. D., Norcross, M. F., Johnson, S. T., Stone, A. E., Chang, E., & Hoffman, M. A. (2020). A biomechanical comparison of dominant and non-dominant limbs during a side-step cutting task. Sports Biomechanics / International Society of Biomechanics in Sports, 19(2), 271–279. https://doi.org/10.1080/14763141.2018.1461236
- Ruiz, A. L., Kelly, M., & Nutton, R. W. (2002). Arthroscopic ACL reconstruction: A 5–9 year follow-up. The Knee, 9(3), 197–200. https://doi.org/10.1016/S0968-0160(02)00019-4
- Schöllhorn, W. I., Bauer, H. U. (1998). Identifying individual movement styles in high performance sports by means of self-organizing kohonen maps. ISBS-Conference Proceedings Archive, Konstanz, Germany.
- Serrien, B., Goossens, M., & Baeyens, J.-P. (2017). Issues in using self-organizing maps in human movement and sport science. International Journal of Computer Science in Sport, 16(1), 1–17. https://doi.org/10.1515/ijcss-2017-0001
- Skaggs, D. L., Rethlefsen, S. A., Kay, R. M., Dennis, S. W., Reynolds, R. A. K., & Tolo, V. T. (2000). Variability in gait analysis interpretation. Journal of Pediatric Orthopaedics, 20(6), 759–764. https://doi.org/10.1097/01241398-200011000-00012
- Strutzenberger, G., David, S., Borcard, L. M., Fröhlich, S., Imhoff, F. B., Scherr, J., & Spörri, J. Breaking new grounds in injury risk screening in soccer by deploying unsupervised learning with a special focus on sex and fatigue effects. Sports Biomechanics / International Society of Biomechanics in Sports, 2022, 1–17. https://doi.org/10.1080/14763141.2022.2112748
- Watts, H. G. (1994). Gait laboratory analysis for preoperative decision making in spastic cerebral palsy: Is it all it’s cracked up to be? Journal of Pediatric Orthopedics, 14(6), 703–704. https://doi.org/10.1097/01241398-199414060-00002