
 ?Mathematical formulae have been encoded as MathML and are displayed in this HTML version using MathJax in order to improve their display. Uncheck the box to turn MathJax off. This feature requires Javascript. Click on a formula to zoom.
ABSTRACT
Training and assessment of agility is often prioritised by soccer coaches and practitioners aiming to develop multi-directional speed. Although the importance of agility is advocated throughout childhood and adolescence, limited data evidence agility performance at different stages of adolescence. The purpose of this study was to examine differences in multi-directional speed performance in youth soccer players spanning an entire soccer academy. A total of 86 male junior-elite soccer players volunteered to participate. Anthropometric data were collected, alongside performance data from a battery of physical tests including sprinting, jumping, change of direction, reaction time, and agility. Bayesian models using log-likelihoods from posterior simulations of parameter values displayed linear or curvilinear relationships between both chronological and biological age and performance in all tests other than agility and reaction time. For agility and reaction time tests, performance improved until ~14 years of age or the estimated age of peak height velocity whereby arrested development in performance was observed. Our results demonstrate that while most performance skills improve as chronological or biological age increases, measures of agility and reaction time may not. These findings support the notion that agility performance is complex and multifaceted, eliciting unique, challenging physical demands and non-linear development.
Introduction
The ability to evade opponents is a critical element of team sport performance (Nimphius et al., Citation2018; Paul et al., Citation2016; Wright et al., Citation2014). In soccer, evasion is challenged during both attacking and defensive possessions as players attempt to gain positional advantage on the opposition (Palucci Vieira et al., Citation2019; Pettersen & Brenn, Citation2019). Supporting this need for multi-directional and multi-velocity competency, Martínez-Hernández et al. (Citation2022) reported that linear sprints followed by decelerations and turns are the most common movements preceding goals in the English Premier League. These changes in mode or direction of movement typically occur in response to external stimuli within soccer, such as random and unpredictable postural changes or movements from an opposing player (Nimphius et al., Citation2018; W. B. Young et al., Citation2015), or following a deceptive body movement (i.e., step-over) by the athlete to evade an opposing player (Jackson et al., Citation2018; Wright et al., Citation2014). This combination of physical change of direction (COD) and perceptual-cognitive components (visual search; decision-making) factors is typically referred to as “agility performance” (Nimphius, Citation2014; Sheppard & Young, Citation2006).
Agility skills are vital in the professional (i.e., senior) game (Williams et al., Citation2020) and, therefore, the development of agility, particularly in youth academy soccer, is advocated throughout childhood and adolescence (Lloyd et al., Citation2013). During this time-period, long-term athlete development models promote advancement of various physical qualities and education of fundamental movement skills (P. Ford et al., Citation2011; Lloyd et al., Citation2013). These models are often integrated into the National Federation and governing body talent development programmes such as the Elite Player Performance Plan (The Premier League, Citation2011), whereby physical qualities (e.g., agility) are assessed and monitored across developmental phases in male youth soccer. As male youth soccer players age and mature, improvements in physical qualities such as linear sprint speed (McCunn et al., Citation2016; Murtagh et al., Citation2018), jump height (Dugdale et al., Citation2019; Murtagh et al., Citation2018), and COD performance (Dugdale et al., Citation2020; Taylor et al., Citation2019), are commonly observed. Morphological factors such as body stature and mass also increase throughout adolescence (Malina et al., Citation2004). While there is a lack of research examining the association between growth, maturation, and perceptual-cognitive qualities (Schumacher et al., Citation2018; Vänttinen et al., Citation2010; Williams et al., Citation2012), physical and biological growth typically aligns with developments in skills such as anticipation and decision-making (Machado et al., Citation2020; Roca et al., Citation2012). Considering that both perceptual-cognitive and physical COD factors contribute to agility performance, it is logical to speculate that this quality may improve comparably. However, limited data exist evidencing this claim.
A variety of factors including growth, maturation, and physical competency may influence the development of agility performance within samples of youth athletes. While physical qualities typically develop throughout adolescence, improvements may be non-linear in nature. For example, differences in both linear sprint and COD performance are not always reported across age groups of adolescent male soccer players (Loturco et al., Citation2018, Citation2020; Trecroci et al., Citation2020). These authors report that speed and acceleration performances were better in U15/U16 compared to players in older age groups (i.e., U18) and that a plateau or increase in COD deficit (the time taken to change direction in comparison to the same distance covered linearly) across the same age ranges is observed. Compared to adult and senior-academy male players, reduced inter-session reliability of COD and agility performance has also been observed in youth soccer players during early- to mid-adolescence (Dugdale et al., Citation2019, Citation2020; Taylor et al., Citation2019). These authors propose that task complexity, factors germane to growth and maturation, and insufficient movement competency may explain this inconsistency of task performance in these groups. Supporting this, a recent review by Thieschäfer and Büsch (Citation2022) report discrepancies and ambiguity of observed improvements in agility performance across adolescent years. Considering these findings and acknowledging the emphasis of multidirectional speed development during talent development in soccer, an increased understanding of agility performance and associated physical and perceptual-cognitive qualities, across adolescence, would be of interest to coaches and practitioners to help inform training and developmental strategies in this population.
When developing and assessing agility performance, a variety of methods have been utilised within applied environments (Inglis & Bird, Citation2016; Nimphius et al., Citation2018; Paul et al., Citation2016). Selecting training drills or assessments is typically dependent on sport-specific factors, such as activity profiles during competition (Dos’Santos et al., Citation2019; Liefeith et al., Citation2018; Paul et al., Citation2016). Moreover, different measures of agility elicit varied physiological demands dependent on the constraints of the drill or test (McBurnie et al., Citation2022). A common approach adopted in soccer is to assess and develop “cut agility” performance; typically performing a COD in response to a stimulus across an angle of ~45° while maintaining a high running velocity (Chaalali et al., Citation2016; Dos’Santos et al., Citation2019; Dugdale et al., Citation2020; Fiorilli et al., Citation2017; Morral-Yepes et al., Citation2022; Pojskic et al., Citation2018). This approach stems from early multidirectional speed data from soccer match play (Bloomfield et al., Citation2007) and is supported by recent observations (Dos’Santos et al., Citation2022). Therefore, training and assessing agility utilising this movement should be considered by soccer coaches and practitioners to elicit locomotive demands comparable to those experienced during competition.
Accordingly, the purpose of this study was to examine differences in agility performance, along with related physical and perceptual-cognitive qualities, in a sample of junior-elite male youth soccer players ranging from U11-U17 age groups. Acknowledging the potential disparities between age and maturity due to disparities in timing and tempo of the maturation process between individuals (Malina et al., Citation2005), the effect of both chronological and biological age on the rate of performance development was considered. It is hypothesised improvements in performance will be observed as players became chronologically and biologically older. Yet, these changes would not improve in a linear fashion due to the individual nature and non-linear process of growth and maturation.
Materials and methods
Participants
We employed an approach that combined Bayesian calibration (Betancourt, Citation2018) and decision-driven sample size planning (Kruschke, Citation2015) to ensure robust and reliable results. Model selection and validation were conducted using both prior and posterior predictive checks. To identify the effects of age and maturity on performance, we aimed for a precision level of 0.06 for our parameter estimates. Using a simulation-based approach with Bayesian regression, we iteratively increased the sample size until the desired precision was attained. The recruited sample met this criterion. The resulting models, even when more complex than the simulation model, produced appropriately precise credible intervals.
In total, 86 male youth soccer players (mean ± SD [range]: age 13.6 ± 2.0 [10.6–17.3] years; stature 160.8 ± 13.7 [134.2–193.9] cm; mass 50.1 ± 13.0 [27.5–78.7] kg) volunteered to participate in this study. Participants were signed to a junior-elite soccer academy playing at the top competitive level of the Scottish Football Association (SFA) youth soccer structure and all received the same training exposure within their respective age groups (ranging from U11: 4.5 h/week to U17: 10 h/week). Participants were categorised within the following age groups as specified by the SFA: U11/U12 (n = 31), U13/U14 (n = 23), and U15-U17 (n = 32). Before conducting any trials, we obtained assent from all participants, consent from parents/guardians and gatekeeper consent from the Academy Head of Sport Science. The study received institutional ethical approval from the local university ethics panel (NICR16/17_45_v2).
Procedures
Participants completed a single testing session as part of their routine, end-of-season fitness testing. The testing session was conducted indoors (~22 °C) on a synthetic 4 G pitch, completed a minimum of 48 h following competition, in the absence of strenuous exercise within 24 h prior, and during regular training hours. Anthropometric data including body mass, standing stature, and sitting height were collected alongside performance data from the countermovement jump (CMJ), 10 m linear sprint, modified 505 COD test (m505COD), a Y-sprint drill in both pre-planned (Y-SprintPRE) and reactive (Y-SprintREACT) conditions, and a lower body reaction time test (LBRTT). Assessments utilised in this study have previously been reported to achieve acceptable reliability in comparable samples (ICC = 0.81–0.97; Dugdale et al., Citation2019, Citation2020). Performance tests were completed in ascending order from least to most demanding and in an identical order for all participants. Before conducting any tests, participants conducted a standardised warm-up routine consisting of light aerobic activity, dynamic stretching, progressive sprinting, sub-maximal jumping, and sub-maximal pre-planned and reactive COD.
Following the standardised warm-up, participants received verbal instructions and demonstrations from the research team immediately before conducting 3 familiarisation attempts for each test in the order stated above. Electronic timing gates were adjusted to an appropriate hip height as per the mean stature of the sample group, and start positions were standardised as self-selected crouch starts from 0.7 m behind the start gate (Haugen & Buchheit, Citation2016). Data were collected using the Witty Dual Beam Timing System (Microgate, Bolzano, Italy) with time being reported to the nearest 0.01 s. For the CMJ and linear sprint tests, participants completed 3 attempts of each test with the best attempt being selected for analysis (Al Haddad et al., Citation2015). For the m505COD and Y-SprintPRE tests, participants completed 3 attempts in each direction, alternating between right and left attempts. Best attempts from each direction were selected, and a mean time from the two directions was calculated and used for analysis. To account for the performance variance, the average of all four and all ten attempts was used for the analysis of the Y-SprintREACT (Al Haddad et al., Citation2015; Oliver & Meyers, Citation2009) and LBRTT (Spiteri et al., Citation2013), respectively. Recovery intervals between trials were standardised at 3 min for all tests, with the exception of LBRTT due to the low-fatigue nature of the procedure.
Anthropometrics/Maturity status
Body mass was assessed using digital floor scales (Seca, Birmingham, UK) and reported to the nearest 0.1 kg. Standing stature and sitting height were assessed using a free-standing stadiometer (Seca, Birmingham, UK) and reported to the nearest 0.1 cm. Leg length was estimated as standing height minus sitting height. Birth dates of players were also provided to calculate chronological age on the date of assessment. The Mirwald equation for boys (Mirwald et al., Citation2002) was implemented as the routine assessment of somatic maturity estimation at the academy due to its non-invasive nature, ease of application, and available normative data within comparable populations. A regression equation was used to estimate age at peak height velocity (PHV) and, subsequently, calculate age from PHV – maturity offset (see EquationEquation 1(1)
(1) , maturity offset equation for boys; Mirwald et al., Citation2002). Participants were then categorised as pre-PHV (> −0.5 years PHV), circa-PHV (−0.5–0.5 years PHV), or post-PHV (>0.5 years PHV) as per classifications used by the academy.
Countermovement jump
CMJ data were collected using the JustJump mat (Probiotics, Huntsville, AL) (Dugdale et al., Citation2019). Attempts were conducted with participants placing their hands on their hips and utilising a self-selected countermovement depth. Attempts were disqualified if participants abandoned the hands on hip position or actively flexed at the knee or hip during flight. Participants who completed one additional jump per disqualified attempt, however, received no score for that attempt if the additional jump was also disqualified. Data were reported to the nearest 0.1 cm.
10 m sprint
Linear sprint performance was assessed over a distance of 10 m as per previously reported match-based observations of youth soccer players (Buchheit et al., Citation2010; Mendez-Villanueva et al., Citation2011). Participants were provided verbal encouragement and were instructed to sprint maximally throughout the duration of the test to a set of cones 2 m beyond the final timing gate.
Modified 505 change of direction test
Pre-planned COD ability through the horizontal plane was assessed via the m505COD test (Dugdale et al., Citation2020; Gabbett et al., Citation2008). The methodology for the m505COD was as per originally established methods (Draper & Lancaster, Citation1985); however, shortening the initial linear sprint by 5 m in distance. Therefore, this involved a 10 m linear sprint from a static start, a 180° turn on the nominated leg ensuring contact with a turn line, and a 5 m return sprint through an identified finish line. The combined duration of the final 5 m of the 10 m linear sprint, turn, and 5 m return sprint were recorded.
Y-SprintPRE
COD performance was also assessed using a pre-planned version of the Y-Sprint drill (Y-SprintPRE) (). Participants completed two maximal attempts changing direction to the left and two attempts changing direction to the right. Best attempts from each direction were selected and mean times from these two attempts were calculated and used for analysis.
Figure 1. Set up of Y-SprintPRE and Y-SprintREACT tests.
Y-SprintREACT
Agility performance was assessed using the Y-SprintREACT test. The protocol for the Y-SprintREACT was identical to Y-SprintPRE trials; however, with the addition of a Witty SEM light stimulus (Microgate, Bolzano, Italy), 10 m from the start position (). Stimuli were displayed following a 0.5 sec delay after crossing the “stimulus received” timing gate and received in a randomised order. All participants completed the Y-SprintREACT trials following completion of the Y-SprintPRE trials to allow for further familiarisation with the test before including a reactive component. Timings for the Y-SprintREACT were provided for phase 1 (the initial 4 m linear sprint), phase 2 (the subsequent 2 m linear sprint followed by the change of direction and 4 m sprint to either the left or right finish gates) and a combination of both phases (total time).
Lower body reaction time test
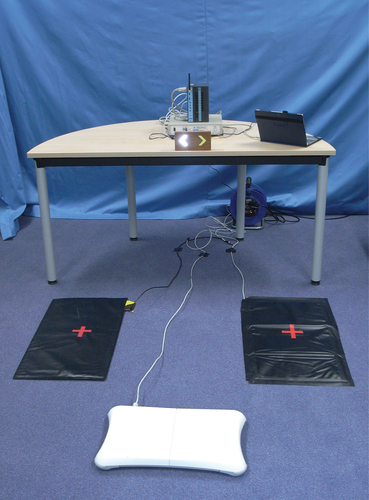
The “complex” version of the LBRTT established by Spiteri et al., (Citation2013) was selected as a measure of reaction time (). Attempts for this test required participants to stand on a custom-made force platform in an athletic “ready” position with feet shoulder width apart. Participants were instructed to remain as still as possible and focus on a visual LED display positioned 1.5 m away from the force platform at a height of 1 m. Two contact mats (PM2/PK, Defender Security, Leeds, UK) were used in conjunction with the force platform to test the foot reaction times of participants during the test. Contact mats were placed at 45° angles to the left and right, 70 cm in front of the force platform. The visual stimulus was presented as an arrow on the LED display facing left or right, in a random order, appearing between 3 and 5 sec following the beginning of each attempt. Participants were instructed to leap from the force platform as fast as possible, landing with one foot in the centre of the corresponding contact mat in response to the visual stimulus, landing on the left foot when responding to the left-facing arrow and right foot when responding to the right-facing arrow. Participants completed a total of 10 attempts, with each attempt starting automatically on a timed loop within the software. The directions of attempts were generated randomly to avoid anticipation by participants. Attempts were collected over a period of 10 s with 10 s delay intervals. Data for LBRTT were analysed using AcqKnowledge v4.4 (Biopac Systems Inc, CA, USA). The total reaction time for each attempt of the LBRTT was identified as the time taken from the presentation of the stimulus to closing the switch on the appropriate contact mat.
Figure 2. Set up of the LBRTT test (Spiteri et al., Citation2013).
Statistical analysis
Descriptive statistics are presented as means and their associated standard deviations. To offer flexibility in modelling, avoid common issues with misinterpretation of p-values and confidence intervals, and the possibility of calculating direct probabilities of non-random samples – something not possible with standard frequentist analysis methods (Greenland et al., Citation2016; Wasserstein et al., Citation2019), a Bayesian approach was used. We fitted a range of Bayesian regression models including standard linear models (see EquationEquation 2(2)
(2) ), polynomials (see EquationEquation 3
(3)
(3) ), and non-linear models (see EquationEquation 4
(4)
(4) ) (Wood, Citation2003; Zhou & Shen, Citation2001) with chronological age and age adjusted using PHV. The prior used for the intercept (α) was a t-distribution with 3 degrees of freedom (ν), the location parameter (μ) the median of the response variable, and the scale parameter (σ) the median absolute deviation of the response variable. As a prior for sigma, we used a half t-distribution with 3 degrees of freedom (ν), with the location parameter (μ) set at zero and the scale parameter (σ) the median absolute deviation of the response variable. For β coefficients, we applied a flat prior.
We determined the best models using Leave-One-Out cross-validation (LOO), a method for estimating pointwise out-of-sample prediction accuracy from fitted Bayesian models using log-likelihoods from posterior simulations of the parameter values (Vehtari et al., Citation2017). All models were checked for convergence (ȓ = 1), and posterior predictive checks were used to check how closely data simulated from the models compared to the empirical data (Gabry et al., Citation2019). For the best-fitted models, there were no systematic discrepancies between simulated and observed data. All models were fitted using R (R Core Team, 2022), and with the Bayesian Regression Models using “Stan” (brms) package (Bürkner, Citation2017).
Results
Descriptive statistics for body mass, stature, CMJ, 10 m sprint time, m505COD, LBRTT, Y-SprintPRE, and Y-SprintREACT are presented across chronological age groups () and maturity offset years ().
Table 1. Descriptive statistics for anthropometric and performance measurements across chronological age groups.
Table 2. Descriptive statistics for anthropometric and performance measurements pre-, circa-, and post-peak height velocity.
When the best models are referred to in each of the sections below, they refer to the best models according to our criteria as described in the statistical analysis section, above.
Body mass
The best model that describes the relationship between body mass and chronological age, and the relationship between mass and maturity offset is linear with Gaussian distributed errors (). Predictions from modelling mass and chronological age suggest that mass increases by approximately 5.6 kg (5.5–5.7 kg) per year from 10 to 17 years of age. Similarly, predictions from the relationship modelled between body mass and maturity offset suggest that mass increases by just under 7 kg (6.7–6.9 kg) with each offset year.
Figure 3. Relationships between chronological age and physical/perceptual-cognitive qualities.
Figure 4. Relationships between maturity offset and physical/perceptual-cognitive qualities.
Stature
The best model that describes the relationship between stature and chronological age is linear with Gaussian distributed errors (). Predictions from the model suggest that stature increases by approximately 5.6 cm (5.5–5.7 cm) per year from 10 to 17 years of age. The best model that describes the relationship between stature and maturity offset is quadratic with Gaussian distributed errors (). This results in a curvilinear relationship where stature is predicted to increase in a gradually reducing manner, reducing from increases of 10.2 cm per year from 4 years pre-PHV to 3.8 cm per year between 2 and 3 years post-PHV.
Countermovement jump (CMJ)
The best model that describes the relationship between counter movement jump height (CMJ) and chronological age is linear with Gaussian-distributed errors (). Predictions from the model suggest that jump height improves by just under 3 cm (2.7–2.8 cm) per year from 10 to 17 years of age. Similarly, the relationship between counter movement jump height (CMJ) and maturity offset was also modelled best as a linear relationship with Gaussian errors (). Predictions from the maturity offset model suggest that the jump height improves by approximately 3 cm with each offset year.
10 m sprint time
The best model that describes the relationship between 10 m Sprint Time and chronological age data is quadratic with Gaussian distributed errors (). This results in a curvilinear relationship where 10 m sprint time is predicted to reduce by ~0.8 sec each year from 10 to 12 years of age and the difference reduces by ~0.01 sec from 13 to 17 years of age, resulting in a flattening of the downward trajectory of the curve. Conversely, the relationship between 10 m sprint time and maturity offset was best modelled as a linear model with Gaussian distributed errors () with 10 m sprint time predicted to reduce by 0.06 with each offset year.
Modified 505 change of direction test (m505COD)
The best model that describes the relationship between the m505COD test and chronological age and m505COD and maturity offset is quadratic with Gaussian distributed errors (). Predictions from the model show that players’ time reduces across years with differences between year categories reducing from 0.1 sec to 0.03 sec in 0.01 sec increments and between maturation categories from 0.12 sec to 0.01 sec in 0.02 sec increments.
Lower body reaction time test (LBRTT)
The best model that describes the relationship between the lower body reaction time test (LRRTT) and chronological age LBRTT and maturity offset, is quadratic with Gaussian-distributed errors () producing a parabola-like curve. Predictions from the model show that players’ lower body reaction time decreases from 10 to 14 years of age before increasing again from 14 to 17 years of age.
Pre-planned Y-Sprint change of direction test (Y-SprintPRE)
The best model that describes the relationship between performance on the Y-SprintPRE test and chronological age is quadratic relationship with Gaussian distributed errors (). Forming a curvilinear relationship, Y-SprintPRE time is predicted to reduce each year with an initial 0.1 sec difference between 10 and 11 years of age and reducing by 0.01 sec from 11 to 17 years of age, resulting in a flattening of the downward trajectory of the curve. A similar relationship is shown between Y-SprintPRE time and maturity offset ().
Reactive Y-Sprint change of direction test (Y-SprintREACT)
The best model that describes the relationship between performance on the Y-SprintREACT test and chronological age is non-linear (). An initial decrease in performance time is observed across age groups until 14 years of age, when the relationship undulates – increasing at 15 years of age, before decreasing again more gradually up to 17 years of age. The relationship between Y-SprintREACT performance and maturity offset was best modelled as a quadratic relationship with Gaussian distributed errors (), decreasing until the estimated onset of peak height velocity (maturity offset = 0 years) and then increasing gradually.
Discussion
The aim of the present study was to examine agility performance, along with physical and perceptual-cognitive performance related to agility, in youth soccer players considering the effect of both chronological and biological age. We hypothesised that improvements in performance would occur as players increase in chronological and biological age. Yet, these changes would not improve in a linear fashion. Our findings demonstrate that while most of the physical performance measures adopted within this study improved as chronological or biological age increased, measures of agility and reaction time did not, displaying arrested performance development at around 14 years of age, or circa-PHV for our sample. We also observed both linear and non-linear increases in physical performance for our sample, dependent on the measure.
The primary finding from this investigation, and contrary to our hypothesis, was the observation that agility performance and reaction time did not continue to improve as chronological age increased past 14 years of age and following the onset of PHV. This was particularly of note, as this disagreed with improvements made across the other measures of physical performance conducted within this study. Agility performance is a complex and multifaceted skill requiring individuals to execute a rapid, whole-body movement, with a change of velocity or direction in response to a stimulus (Sheppard & Young, Citation2006). Consequently, several factors may explain this observation for our sample. Our results show that linear sprint performance improved across adolescence, alongside increases in body mass. Therefore, for the chronologically and biologically older players within our sample, momentum (i.e., the product of mass and velocity) will likely have increased in the locomotor performance tests included within our study. Previous reports suggest that momentum may explain disparities observed between increases in linear sprint and COD performance (Fernandes et al., Citation2021; Freitas et al., Citation2022). While we did not observe impairments in COD performance as linear sprint performance and body mass increased across adolescence, previous authors isolated COD performance within their respective studies by analysing COD deficit, as well as reporting time taken to complete the COD test (Fernandes et al., Citation2021; Freitas et al., Citation2022; Loturco et al., Citation2020). We used a modified version of the original 505 COD test (Gabbett et al., Citation2008) and a 10 m linear sprint which were both included in the soccer academy’s routine testing battery. Unfortunately, this prevented us from calculating the COD deficit in line with previous studies. Nevertheless, comparisons between Y-SprintPRE and Y-SprintREACT allow us to make similar interpretations regarding the influence of a reactive stimulus on performance of this test. We propose that the additional momentum exhibited by the chronologically and biologically older players within our study impairs their agility performance due to their inability to decelerate and change direction efficiently when receiving the COD stimulus. This observation further supports the notion that agility is an independent and distinct performance characteristic (W. B. Young et al., Citation2015). From an applied perspective, we suggest that practitioners prioritise the development of deceleration and braking performance alongside acceleration and sprinting in the pursuit of improved agility performance (Clarke et al., Citation2022; Harper et al., Citation2022). Moreover, considering the faster times achieved during phase 1, yet slower times achieved during phase 2 of the Y-SprintREACT test for older and more mature players, it is probable that these players within our study were approaching the COD of the Y-SprintREACT “too fast” relative to their braking and COD ability. To combat this, we recommend that explicit technical coaching of agility performance should be delivered as part of a comprehensive physical development programme to help players who are post-PHV become more attuned to their current physical attributes (Dos’Santos et al., Citation2019; McBurnie et al., Citation2022). Given our findings, these suggestions may be beneficial for all ages and stages of development. However, this may be particularly important for players from older age groups as training specialises to prioritise technical and tactical developments (Jeffreys et al., Citation2018; Loturco et al., Citation2020).
We observed similar results for LBRTT (our measure of perceptual-cognitive performance) with players demonstrating a decrease in performance from ~13.5 years of age to circa-PHV. This finding was also in contrast to our hypothesis as it has previously been reported that perceptual-cognitive ability develops throughout childhood and adolescence (Malina et al., Citation2004; Schumacher et al., Citation2018). We suggest that comparative to our explanations for the impairments in agility performance observed, morphological factors related to growth and maturation may explain this finding within our sample. Dimensionality scaling across adolescence represents the development of physiological performance correlated to increases in body size (Malina et al., Citation2004). Across adolescence, increases in body size are commonly accompanied by relative improvements in performance (Philippaerts et al., Citation2006), as we observed for most of the performance tests within our study. However, as evidenced by our results for Y-SprintREACT and LBRTT, this may not always be the case. One phenomenon that may explain these findings is that of “adolescent awkwardness” observed circa-PHV (Quatman-Yates et al., Citation2012). This period of development has been described to exhibit delays or regressions in sensorimotor function relative to rapid growth spurts (Quatman-Yates et al., Citation2012; Ryan et al., Citation2018). Acknowledging the rapid growth (particularly of the lower limbs) experienced circa-PHV (Malina et al., Citation2004), theories of adolescent awkwardness and inadequate dimensionality scaling potentially explain our observations for these measures in our study. Consequently, practitioners may continue to emphasise the development of movement skills and competencies throughout adolescence in an effort to counteract the potential effects of adolescent awkwardness.
Aligning to our hypothesis, we observed increases in countermovement jump, linear sprint and pre-planned COD performance for chronologically and biologically older players. Increases in countermovement jump performance were observed in a linear fashion, while decreases in performance time for both pre-planned COD tests (m505COD & Y-SprintPRE) were observed to be curvilinear in nature when modelled against both chronological and biological age. Aligned with the concept of dimensionality scaling, briefly discussed above, developments in physical and neuromuscular performances are often observed across adolescence (Malina et al., Citation2004). These developments in performance are likely supported by the impact of growth on speed, strength, and power qualities (Oliver et al., Citation2013). Adolescent growth and maturation are typically associated with increases in limb length, increased muscle mass, changes in intrinsic muscle tendon properties, and development of anaerobic metabolism (P. Ford et al., Citation2011; Oliver et al., Citation2013). Peak gains in speed qualities have also been shown to occur circa-PHV (Philippaerts et al., Citation2006). These biological advancements, combined with the influence of immersion within a professional talent development system, likely explain these performance increases for our sample. However, decreases in linear sprint time were observed to be curvilinear when modelled against chronological age and linear when modelled against biological age. We suggest that this discrepancy potentially reflects the impact of factors associated with biological maturity, briefly mentioned above, on linear sprint performance, specifically.
Finally, our findings suggest that while body mass increases in a linear fashion as players become chronologically and biologically older, stature may increase in a curvilinear fashion, with the rate of development gradually slowing as players navigated through (circa-) and beyond (post-)PHV. Estimates of maturity offset typically rely on variations in standing stature when predicting proximity from PHV (Mirwald et al., Citation2002), potentially explaining this trajectory. Considering that rapid increases in standing stature are observed up to the onset of PHV, these increases slow from this point and, in males, typically cease at ~18–19 years of age (Malina et al., Citation2004). Furthermore, body mass has the capacity to increase for several years following the adolescent years in athletic populations due to continued exposure to systematic training and the continued influence of biological growth and maturation (Malina et al., Citation2004). We suggest that while modelling body mass against both chronological and biological age may provide comparable outputs, inclusion of maturity offset or predicted age of PHV may be more accurate when modelling trajectories of development of stature in youth athletes.
This study is not without limitations. First, we sought to examine agility performance, along with physical and perceptual-cognitive performance related to agility, in youth soccer players considering the effect of both chronological and biological age. However, we did not assess training age, training phase, and participation history of the players recruited within this study. Given the influence that training adaptations have upon improvements in physiological and perceptual-cognitive performance in youth soccer players (P. R. Ford & Williams, Citation2012), this factor may have contributed to the performance differences that we observed in addition to changes resultant from advanced chronological and biological age. Future research should incorporate this assessment when examining similar research questions to ours to consider this influence. We also implemented a generic light stimulus for both our measure of agility and reaction time. Acknowledging the physical and conditional differences between light and human stimuli (Nimphius, Citation2014; W. Young & Farrow, Citation2013), the employment of this type of stimuli may explain the arrested development of these qualities in older, more mature participants within our study. We also adopted a cross-sectional approach to our research question. While our results include a comprehensive sample of youth soccer players across all age groups from a junior-elite soccer academy, a longitudinal approach may have provided more specific information on intra-individual development of these qualities across adolescence. Finally, we use a predictive equation to estimate the maturity status of our sample (Mirwald et al., Citation2002). While this approach is commonly used in applied settings due to its logistical and non-invasive nature, the accuracy of this method has been questioned in recent years (Teunissen et al., Citation2020). Nevertheless, these methods boast the ability to easily assess many participants within a single data collection session without the requirement of costly equipment or clinical training. We suggest that readers acknowledge these potential limitations when interpreting our results.
Practical recommendations and future research directions
To facilitate the development of agility throughout maturation, coaches should appreciate and apply a multi-system approach to agility skill development. This may be achieved through physical development in actions which require braking and deceleration, and perceptual-motor development in situations which require a response to a stimulus. Tasks such as decelerations and changes of direction from various angles and various approach distances will allow athletes to develop the required braking qualities considering both morphology and coordinative skill, given the appropriate dose and learning conditions. Furthermore, variations in the angle and approach distance will facilitate the development of affordances for the athlete of what is “too fast” of an approach relative to their braking and COD ability, helping optimise their agility outcomes. The addition of reactive tasks progressed systematically to increase time constraints and task complexity will then allow the athlete to express these skills in increasingly shorter time windows and more difficult perceptual circumstances, increasing the perceptual-motor link and subsequent agility performance. Future research should consider evaluating the effectiveness of varied training approaches to developing agility performance considering the impact of chronological and biological age adopting a longitudinal study design.
Conclusion
Our results demonstrate that while most physical skills improve as chronological or biological age increases, measures of agility and reaction time may not. Agility and reaction time may display arrested performance development during adolescence, potentially due to delays or regressions in sensorimotor function relative to rapid growth spurts. Our findings further support the notion that agility performance is a complex and multifaceted skill eliciting unique and challenging physical demands. Moreover, we encourage coaches and practitioners to continue to emphasise the development of multi-directional movement skills and competencies throughout adolescence, particularly as training specialises to prioritise technical and tactical developments.
Disclosure statement
No potential conflict of interest was reported by the author(s).
Additional information
Funding
References
- Al Haddad, H., Simpson, B. M., & Buchheit, M. (2015). Monitoring changes in jump and sprint performance: Best or average values? International Journal of Sports Physiology and Performance, 10(7), 931–934. https://doi.org/10.1123/ijspp.2014-0540
- Betancourt, M. (2018). Calibrating Model-Based Inferences and Decisions. http://arxiv.org/abs/1803.08393
- Bloomfield, J., Polman, R., & O’Donoghue, P. (2007). Physical demands of different positions in FA Premier League soccer. Journal of Sports Science and Medicine, 6(1), 63–70.
- Buchheit, M., Mendez-Villanueva, A., Simpson, B. M., & Bourdon, P. C. (2010). Match running performance and fitness in youth soccer. International Journal of Sports Medicine, 31(11), 818–825. https://doi.org/10.1055/s-0030-1262838
- Bürkner, P. C. (2017). brms: An r package for bayesian multilevel models using stan. Journal of Statistical Software, 80(1). https://doi.org/10.18637/jss.v080.i01
- Chaalali, A., Rouissi, M., Chtara, M., Owen, A., Bragazzi, N. L., Moalla, W., Chaouachi, A., Amri, M., & Chamari, K. (2016). Agility training in young elite soccer players: Promising results compared to change of direction drills. Biology of Sport, 33(4), 345–351. https://doi.org/10.5604/20831862.1217924
- Clarke, R., Read, P. J., de Ste Croix, M. B. A., & Hughes, J. D. (2022). The deceleration deficit: A novel field-based method to quantify deceleration during change of direction performance. Journal of Strength and Conditioning Research, 36(9), 2434–2439. https://doi.org/10.1519/JSC.0000000000003856
- Dos’santos, T., Cowling, I., Challoner, M., Barry, T., & Caldbeck, P. (2022). What are the significant turning demands of match play of an English Premier League soccer team? Journal of Sports Sciences, 40(15), 1750–1759. https://doi.org/10.1080/02640414.2022.2109355
- Dos’santos, T., McBurnie, A., Thomas, C., Comfort, P., & Jones, P. A. (2019). Biomechanical comparison of cutting techniques: A review and practical applications. Strength & Conditioning Journal, 41(4), 40–54. https://doi.org/10.1519/SSC.0000000000000461
- Draper, J., & Lancaster, M. (1985). The 505 test: A test for agility in the horizontal plane. Australian Journal of Science and Medicine in Sport, 17(1), 15–18.
- Dugdale, J. H., Arthur, C. A., Sanders, D., & Hunter, A. M. (2019). Reliability and validity of field-based fitness tests in youth soccer players. European Journal of Sport Science, 19(6), 745–756. https://doi.org/10.1080/17461391.2018.1556739
- Dugdale, J. H., Sanders, D., & Hunter, A. M. (2020). Reliability of change of direction and agility assessments in youth soccer players. Sports, 8(4), 51. 8(4. https://doi.org/10.3390/sports8040051
- Fernandes, R., Bishop, C., Turner, A. N., Chavda, S., & Maloney, S. J. (2021). Train the engine or the brakes? Influence of momentum on the change of direction deficit. International Journal of Sports Physiology and Performance, 16(1), 90–96. https://doi.org/10.1123/IJSPP.2019-1007
- Fiorilli, G., Mitrotasios, M., Iuliano, E., Pistone, E. M., Aquino, G., Calcagno, G., & diCagno, A. (2017). Agility and change of direction in soccer: Differences according to the player ages. The Journal of Sports Medicine and Physical Fitness, 57(12), 1597–1604. https://doi.org/10.23736/S0022-4707.16.06562-2
- Ford, P., de Ste Croix, M., Lloyd, R., Meyers, R., Moosavi, M., Oliver, J., Till, K., & Williams, C. (2011). The long-term Athlete development model: Physiological evidence and application. Journal of Sports Sciences, 29(4), 389–402. https://doi.org/10.1080/02640414.2010.536849
- Ford, P. R., & Williams, A. M. (2012). The developmental activities engaged in by elite youth soccer players who progressed to professional status compared to those who did not. Psychology of Sport and Exercise, 13(3), 349–352. https://doi.org/10.1016/j.psychsport.2011.09.004
- Freitas, T. T., Pereira, L. A., Alcaraz, P. E., Comyns, T. M., Azevedo, P. H. S. M., & Loturco, I. (2022). Change-of-Direction Ability, Linear Sprint Speed, and Sprint Momentum in Elite Female Athletes: Differences Between Three Different Team Sports. Journal of Strength and Conditioning Research, 36(1), 262–267. https://doi.org/10.1519/JSC.0000000000003857
- Gabbett, T. J., Kelly, J. N., & Sheppard, J. M. (2008). Speed, change of direction speed, and reactive agility of rugby league players. Journal of Strength and Conditioning Research, 22(1), 174–181. https://doi.org/10.1519/JSC.0b013e31815ef700
- Gabry, J., Simpson, D., Vehtari, A., Betancourt, M., & Gelman, A. (2019). Visualization in Bayesian workflow. Journal of the Royal Statistical Society Series A: Statistics in Society, 182(2), 389–402. https://doi.org/10.1111/rssa.12378
- Greenland, S., Senn, S. J., Rothman, K. J., Carlin, J. B., Poole, C., Goodman, S. N., & Altman, D. G. (2016). Statistical tests, P values, confidence intervals, and power: A guide to misinterpretations. European Journal of Epidemiology, 31(4), 337–350. https://doi.org/10.1007/s10654-016-0149-3
- Harper, D. J., McBurnie, A. J., Santos, T. D., Eriksrud, O., Evans, M., Cohen, D. D., Rhodes, D., Carling, C., & Kiely, J. (2022). Biomechanical and neuromuscular performance requirements of horizontal deceleration: A review with implications for random intermittent multi-directional sports. Sports Medicine, 52(10), 2321–2354. https://doi.org/10.1007/s40279-022-01693-0
- Haugen, T., & Buchheit, M. (2016). Sprint running performance monitoring: Methodological and practical considerations. Sports Medicine, 46(5), 641–656. https://doi.org/10.1007/s40279-015-0446-0
- Inglis, P., & Bird, S. P. (2016). Reactive agility tests – review and practical applications. Journal of Australian Strength and Conditioning, 24(5), 62–69.
- Jackson, R. C., Barton, H., Ashford, K. J., & Abernethy, B. (2018). Stepovers and signal detection: Response sensitivity and bias in the differentiation of genuine and deceptive football actions. Frontiers in Psychology, 9(OCT). https://doi.org/10.3389/fpsyg.2018.02043
- Jeffreys, I., Huggins, S., & Davies, N. (2018). Delivering a gamespeed-focused speed and agility development program in an English Premier League soccer academy. Strength and Conditioning Journal, 40(3), 23–32. https://doi.org/10.1519/SSC.0000000000000325
- Kruschke, J. K. (2015). Goals, power, and sample size. In Doing bayesian data analysis: A tutorial with R, JAGS, and Stan (pp. 359–398). Elsevier.
- Liefeith, A., Kiely, J., Collins, D., & Richards, J. (2018). Back to the future – in support of a renewed emphasis on generic agility training within sports-specific developmental pathways. Journal of Sports Sciences, 36(19), 2250–2255. https://doi.org/10.1080/02640414.2018.1449088
- Lloyd, R. S., Read, P., Oliver, J. L., Meyers, R. W., Nimphius, S., & Jeffreys, I. (2013). Considerations for the development of agility during childhood and adolescence. Strength and Conditioning Journal, 35(3), 2–11. https://doi.org/10.1519/SSC.0b013e31827ab08c
- Loturco, I., Jeffreys, I., Abad, C. C. C., Kobal, R., Zanetti, V., Pereira, L. A., & Nimphius, S. (2020). Change-of-direction, speed and jump performance in soccer players: A comparison across different age-categories. Journal of Sports Sciences, 38(11–12), 1279–1285. https://doi.org/10.1080/02640414.2019.1574276
- Loturco, I., Jeffreys, I., Kobal, R., Abad, C. C. C., Ramirez-Campillo, R., Zanetti, V., Pereira, L. A., & Nakamura, F. Y. (2018). Acceleration and speed performance of Brazilian elite soccer players of different age-categories. Journal of Human Kinetics, 64(1), 205–218. https://doi.org/10.1515/hukin-2017-0195
- Machado, G., González-Víllora, S., Sarmento, H., & Teoldo, I. (2020). Development of tactical decision-making skills in youth soccer players: Macro- and microstructure of soccer developmental activities as a discriminant of different skill levels. International Journal of Performance Analysis in Sport, 20(6), 1072–1091. https://doi.org/10.1080/24748668.2020.1829368
- Malina, R. M., Bouchard, C., & Bar-Or, O. (2004). Growth, maturation, and physical activity (2nd ed.). Human Kinetics.
- Martínez-Hernández, D., Quinn, M., & Jones, P. (2022). Linear advancing actions followed by deceleration and turn are the most common movements preceding goals in male professional soccer. Science and Medicine in Football, 7(1), 25–33. https://doi.org/10.1080/24733938.2022.2030064
- McBurnie, A. J., Parr, J., Kelly, D. M., & Dos’santos, T. (2022). Multidirectional speed in youth soccer players: Programming considerations and practical applications. Strength & Conditioning Journal, 44(2), 10–32. https://doi.org/10.1519/SSC.0000000000000657
- McCunn, R., Weston, M., Hill, J. K. A., Johnston, R. D., & Gibson, N. V. (2016). Influence of physical maturity status on sprinting speed among youth soccer players. Journal of Strength and Conditioning Research, 31(7), 1795–1801. https://doi.org/10.1519/JSC.0000000000001654
- Mendez-Villanueva, A., Buchheit, M., Kuitunen, S., Douglas, A., Peltola, E., & Bourdon, P. (2011). Age-related differences in acceleration, maximum running speed, and repeated-sprint performance in young soccer players. Journal of Sports Sciences, 29(5), 477–484. https://doi.org/10.1080/02640414.2010.536248
- Mirwald, R. L., Baxter-Jones, A. D., Bailey, D. A., & Beunen, G. P. (2002). An assessment of maturity from anthropometric measurements. Medicine & Science in Sports and Exercise, 34(4), 689–694. https://doi.org/10.1249/00005768-200204000-00020
- Morral-Yepes, M., Moras, G., Bishop, C., & Gonzalo-Skok, O. (2022). Assessing the reliability and validity of agility testing in team sports: A systematic review. Journal of Strength and Conditioning Research, 36(7), 2035–2049. https://doi.org/10.1519/JSC.0000000000003753
- Murtagh, C. F., Brownlee, T. E., O’Boyle, A., Morgans, R., Drust, B., & Erskine, R. M. (2018). Importance of speed and power in elite youth soccer depends on maturation status. Journal of Strength and Conditioning Research, 32(2), 297–303. https://doi.org/10.1519/JSC.0000000000002367
- Nimphius, S. (2014). Increasing agility. In D. Joyce & D. Lewindon (Eds.), High-performance training for sports (pp. 185–198). Human Kinetics.
- Nimphius, S., Callaghan, S. J., Bezodis, N. E., & Lockie, R. G. (2018). Change of direction and agility tests: Challenging our Current measures of performance. Strength and Conditioning Journal, 40(1), 26–38. https://doi.org/10.1519/SSC.0000000000000309
- Oliver, J. L., Lloyd, R. S., & Rumpf, M. C. (2013). Developing speed throughout childhood and adolescence. Strength & Conditioning Journal, 35(3), 42–48. https://doi.org/10.1519/SSC.0b013e3182919d32
- Oliver, J. L., & Meyers, R. W. (2009). Reliability and generality of measures of acceleration, planned agility, and reactive agility. International Journal of Sports Physiology & Performance, 4, 345–354.
- Palucci Vieira, L. H., Carling, C., Barbieri, F. A., Aquino, R., & Santiago, P. R. P. (2019). Match running performance in young soccer players: A systematic review. Sports Medicine, 49(2), 289–318. https://doi.org/10.1007/s40279-018-01048-8
- Paul, D. J., Gabbett, T. J., & Nassis, G. P. (2016). Agility in Team Sports: Testing, training and factors affecting performance. Sports Medicine, 46(3), 421–442. https://doi.org/10.1007/s40279-015-0428-2
- Pettersen, S. A., & Brenn, T. (2019). Activity profiles by position in youth elite soccer players in official matches. Sports Medicine International Open, 03(1), E19–E24. https://doi.org/10.1055/a-0883-5540
- Philippaerts, R. M., Vaeyens, R., Janssens, M., van Renterghem, B., Matthys, D., Craen, R., Bourgois, J., Vrijens, J., Beunen, G., & Malina, R. M. (2006). The relationship between peak height velocity and physical performance in youth soccer players. Journal of Sports Sciences, 24(3), 221–230. https://doi.org/10.1080/02640410500189371
- Pojskic, H., Åslin, E., Krolo, A., Jukic, I., Uljevic, O., Spasic, M., & Sekulic, D. (2018). Importance of reactive agility and change of direction speed in differentiating performance levels in junior soccer players: Reliability and validity of newly developed soccer-specific tests. Frontiers in Physiology, 9(MAY). https://doi.org/10.3389/fphys.2018.00506
- Premier League. (2011). Elite player performance plan.
- Quatman-Yates, C. C., Quatman, C. E., Meszaros, A. J., Paterno, M. V., & Hewett, T. E. (2012). A systematic review of sensorimotor function during adolescence: A developmental stage of increased motor awkwardness? British Journal of Sports Medicine, 46(9), 649–655. https://doi.org/10.1136/bjsm.2010.079616
- Roca, A., Williams, A. M., & Ford, P. R. (2012). Developmental activities and the acquisition of superior anticipation and decision making in soccer players. Journal of Sports Sciences, 30(15), 1643–1652. https://doi.org/10.1080/02640414.2012.701761
- Ryan, D., Mccall, A., Fitzpatrick, G. F., Hennessy, L., Meyer, T., & McCunn, R. (2018). The influence of maturity status on movement quality among English Premier League Academy soccer players. Sport Performance Science Reports, 32(1), 1–3.
- Schumacher, N., Schmidt, M., Wellmann, K., Braumann, K. M., & Rogan, S. (2018). General perceptual-cognitive abilities: Age and position in soccer. PLoS One, 13(8), e0202627. https://doi.org/10.1371/journal.pone.0202627
- Sheppard, J. M., & Young, W. B. (2006). Agility literature review: Classifications, training and testing. Journal of Sports Sciences, 24(9), 919–932. https://doi.org/10.1080/02640410500457109
- Spiteri, T., Cochrane, J. L., & Nimphius, S. (2013). The evaluation of a New Lower-Body Reaction Time Test. The Journal of Strength & Conditioning Research, 27(1), 174–180.
- Taylor, J. M., Cunningham, L., Hood, P., Thorne, B., Irvin, G., & Weston, M. (2019). The reliability of a modified 505 test and change-of-direction deficit time in elite youth football players. Science and Medicine in Football, 3(2), 157–162. https://doi.org/10.1080/24733938.2018.1526402
- Teunissen, J. W., Rommers, N., Pion, J., Cumming, S. P., Rössler, R., D’Hondt, E., Lenoir, M., Savelsbergh, G. J. P., & Malina, R. M. (2020). Accuracy of maturity prediction equations in individual elite male football players. Annals of Human Biology, 47(4), 409–416. https://doi.org/10.1080/03014460.2020.1783360
- Thieschäfer, L., & Büsch, D. (2022). Development and trainability of agility in youth: A systematic scoping review. Frontiers in Sports and Active Living, 4. https://doi.org/10.3389/fspor.2022.952779
- Trecroci, A., Rossi, A., Dos’santos, T., Formenti, D., Cavaggioni, L., Longo, S., Iaia, F. M., & Alberti, G. (2020). Change of direction asymmetry across different age categories in youth soccer. PeerJ, 8, e9486. https://doi.org/10.7717/peerj.9486
- Vänttinen, T., Blomqvist, M., Luhtanen, P., & Häkkinen, K. (2010). Effects of age and soccer expertise on general tests of perceptual and motor performance among adolescent soccer players. Perceptual and Motor Skills, 110(3), 675–692. https://doi.org/10.2466/pms.110.3.675-692
- Vehtari, A., Gelman, A., & Gabry, J. (2017). Practical Bayesian model evaluation using leave-one-out cross-validation and WAIC. Statistics and Computing, 27(5), 1413–1432. https://doi.org/10.1007/s11222-016-9696-4
- Wasserstein, R. L., Schirm, A. L., & Lazar, N. A. (2019). Moving to a world beyond “p < 0.05”. American Statistician , 73(sup1), 1–19. https://doi.org/10.1080/00031305.2019.1583913
- Williams, A. M., Ford, P. R., & Drust, B. (2020). Talent identification and development in soccer since the millennium. Journal of Sports Sciences, 38(11–12), 1199–1210. https://doi.org/10.1080/02640414.2020.1766647
- Williams, A. M., Ward, P., Bell-Walker, J., & Ford, P. R. (2012). Perceptual-cognitive expertise, practice history profiles and recall performance in soccer. British Journal of Psychology, 103(3), 393–411. https://doi.org/10.1111/j.2044-8295.2011.02081.x
- Wood, S. N. (2003). Thin plate regression splines. Journal of the Royal Statistical Society Series B: Statistical Methodology, 65(1), 95–114. https://doi.org/10.1111/1467-9868.00374
- Wright, M. J., Jackson, R. C., & Canal-Bruland, R. (2014). Deceptive body movements reverse spatial cueing in soccer. PLoS one, 9(8), e104290. https://doi.org/10.1371/journal.pone.0104290
- Young, W. B., Dawson, B., & Henry, G. J. (2015). Agility and change-of-direction speed are Independent skills: Implications for training for agility in invasion sports. International Journal of Sports Science & Coaching, 10(1), 159–169. https://doi.org/10.1260/1747-9541.10.1.159
- Young, W., & Farrow, D. (2013). The Importance of a Sport-Specific Stimulus for Training Agility. Strength and Conditioning Journal, 35(2), 39–43. https://doi.org/10.1519/SSC.0b013e31828b6654
- Zhou, S., & Shen, X. (2001). Spatially adaptive regression splines and accurate knot selection schemes. Journal of the American Statistical Association, 96(453), 247–259. https://doi.org/10.1198/016214501750332820