Abstract
Purpose: To compare the radiological criteria RECIST, WHO, and tumor volume for evaluation of tumor response in patients with soft tissue sarcomas (STS) showing either good or poor pathohistological response to neoadjuvant chemotherapy combined with regional hyperthermia, and to examine the dependence of the findings on the applied thermal dose.
Materials and methods:19 patients with pathohistological complete response (no vital tumor cells, group 1) and 27 with pathohistological no response (<25% necrosis, group 2) were selected from our previous clinical trials. The change in tumor size before and after therapy was determined. Intratumoral temperature (T90) and thermal dose (CEM 43°C T90) were calculated for 13 patients.
Results: In the first group, 6 partial response (PR) and 13 stable disease (SD) according to RECIST, 7 PR and 12 SD according to WHO, 7 PR and 12 SD according to volumetric criteria were evaluated. In the second group, the results were 10 PR and 17 SD (RECIST), 9 PR and 18 SD (WHO), 8 PR and 19 SD (volume). The concordance of these criteria was 73.7% in group 1 and 74% in group 2. PR and SD were equally distributed in both groups (p > 0.421). Thermal parameters were not different between the groups (p > 0.327).
Conclusions: SD or PR in radiological response assessment does not correlate with the pathohistological response after neoadjuvant thermochemotherapy. RECIST, WHO and volumetric criteria for response evaluation in STS are in substantial agreement. For irregularly shaped lesions, volumetric criteria seem to be more appropriate.
Introduction
Soft tissue sarcomas (STS) are a heterogeneous group of tumors which are derived from the mesoderm and can affect almost all anatomical sites. In adults, they are most frequently located in the extremities (50%) as well as in the trunk and retroperitoneum (40%). Patients with newly diagnosed primary STS are at high risk (HR) for distant metastasis and tumor-related mortality when the tumor is of large size (≥5 cm), shows a high-grade histology, and has a deep localization Citation1. The unfavorable prognosis is due to limited resectability, frequent tumor recurrences, and early metastatic disease. Neoadjuvant chemotherapy combined with regional hyperthermia (RHT) is a multimodality treatment scheme which has been under investigation in prospective clinical trials for several years Citation2 and shows encouraging results in patients with locally advanced HR STS Citation3. The rationale for this multimodal approach is based on evidence that heat increases killing of tumor cells by direct thermal toxicity, by enhancement of drug efficacy as well as by modulation of the immune system to express heat-shock proteins Citation4,Citation5. Assessment of early treatment-induced response is not only important to prevent the patient from further therapy in case it is likely ineffective, but is also predictive for an improved local tumor control and survival Citation6–9.
The most widely used method in vivo to evaluate tumor response to combined neoadjuvant chemotherapy and RHT is the assessment of modifications in tumor size. This is usually performed in daily clinical routine by serial radiological measurements both before and after therapy. Since the early 1980s, World Health Organization (WHO) criteria have been widely used Citation10. They are based on bidimensional measurement of target lesions and calculation of the product of the maximum diameter by its longest perpendicular diameter. Due to several problems with this way of measurement, response evaluation criteria in solid tumors (RECIST) were established in 1999. They are based on unidimensional measurement of the largest diameter instead of the bidimensional WHO criteria Citation11. RECIST also gave much more detailed recommendations to assess tumor lesions as well as to report responses, and took into account recent developments in medical imaging techniques Citation12. A third radiological, three-dimensional method is the determination of the change in tumor volume during the treatment with anticancer drugs. The volume is approximated by encircling the tumor on each sectional image (slice), subsequently multiplying the encircled area with the slice thickness, and finally calculating the summation. In comparison with the above-mentioned radiological approaches, treatment-induced tumor response can also be assessed ex vivo by the pathohistological examination of the resected tumor in terms of vital tumor cells. It is commonly seen as gold standard.
In this work, the comparability of the three radiological approaches (RECIST, WHO, and volumetric criteria) and their concordance with pathohistological tumor response were retrospectively studied in two groups of patients with STS after undergoing neoadjuvant chemotherapy combined with RHT. The first group was composed of 19 patients who showed a pathohistological complete response (pCR), which means that no vital tumor cells were detected by examining the resected tumor. The second group consisted of 27 patients who showed no pathohistological response (NR), which means that more than 75% of vital tumor cells were found.
Furthermore, 13 patients of all 46 patients studied were assessable for intratumoral temperature measurements. Two thermal parameters, the achieved intratumoral index temperature T90 and the applied thermal (isoeffect) dose CEM 43°C T90, were calculated. T90 is defined as the temperature which 90% of all measured intratumoral temperatures exceed for the treatment time of 60 min in our clinical trials. CEM 43°C T90 stands for cumulative equivalent minutes at the reference temperature T90 ≥ 43°C and describes a ‘virtual’ treatment time which is calculated from the ‘actual’ treatment time of 60 min and for which T90 exceeds 43°C for each ‘actual’ treatment time point Citation13,Citation14. The dependence of the radiological and the pathohistological tumor response on the T90 and CEM 43°C T90 was examined.
Methods
Patients
The patients studied in this work were selected from our three previous clinical trials. The first clinical trial is a phase II study (RHT-91 protocol). Fifty-nine patients with high-risk soft tissue sarcomas (HR STS) received four cycles of neoadjuvant systemic chemotherapy comprised of etoposide 250 mg/m2, ifosfamide 6 g/m2, and adriamycin 50 mg/m2 (EIA) combined with two concurrent regional hyperthermia (RHT) applications. Following these cycles, the patients whose tumor was judged to be resectable underwent surgery. All patients who were not pre-irradiated also received external beam radiotherapy Citation1,Citation7. If the tumor showed signs of radiological response, four additional cycles of chemotherapy EIA combined with RHT were given. The second clinical trial is also a phase II study (RHT-95 protocol). A similar patient group including 54 patients with HR STS received the same treatment as in the RHT-91 protocol except that the patients received chemotherapy EIA alone after surgery Citation8. The third clinical trial is a recently finished randomized intergroup phase III study (EORTC 62961/ESHO RHT-95) conducted by the European Organization for Research and Treatment of Cancer (EORTC) and the European Society for Hyperthermic Oncology (ESHO). It comprises a multimodal treatment in patients with primary tumor (S1 group), local recurrence of S1 tumor (S2 group), or inadequate surgery of S1 or S2 tumors (S3 group: resections with positive margins or macroscopic residual tumor). In this clinical trial, all patients were randomized in two arms: arm A received chemotherapy EIA combined with RHT and arm B received chemotherapy EIA alone, followed by definitive surgery and radiotherapy. Additional four cycles of the same chemotherapy EIA with or without RHT were then administered according to the initial randomization Citation15. Therefore, all patients in the RHT-91, RHT-95, and arm A of the EORTC 62961/ESHO RHT-95 studies underwent the identical scheme of preoperative chemotherapy EIA combined with RHT.
Within the time period from the respective study onset (RHT-91: 1991, RHT-95: 1995, EORTC 62961/ESHO RHT-95: 1997) until December 2006, we retrospectively selected all patients who had a pathohistological outcome of complete response after four preoperative EIA/RHT cycles. These 19 patients were considered as a group of ‘good responders’. We also composed a group of ‘poor responders’ consisting of patients which had no pathohistological response after four preoperative EIA/RHT cycles. In order to ensure the comparability we took care that this group exhibited as far as possible a similar distribution regarding age, sex, localization of tumor, and entity as the ‘good responder’ group. This selection process yielded 27 patients.
Imaging
The protocols of the above-quoted studies required staging examinations with cross-sectional imaging methods 30 days before and after preoperative EIA/RHT therapy. These images were used for our response evaluation. The examinations were performed on either computed tomography (CT) or magnetic resonance (MR) scanners with different makes and models since the patients were retrospectively selected from a time period that covered 14 years. The majority of CT examinations were performed on single-slice scanners ‘Somatom Plus 4’ and multislice-scanners ‘Somatom Plus VD 30’ (both Siemens Medical Solutions, Erlangen, Germany). CT examinations of the chest, abdomen, and pelvis were regularly performed with 8-mm contiguous slices. Unless contraindications were present, bolus intravenous contrast agent was used in all patients. Oral contrast agent was used in all studies of the abdomen and the pelvis. In most patients with tumors at the extremities, MR imaging was performed. Mostly, MR scanners with 1.5 Tesla (‘Vision’ or ‘Symphony’, Siemens Medical Solutions) or 1.0 Tesla (‘Impact’ or ‘Harmony’, Siemens Medical Solutions) were employed in combination with surface coils. T1- and T2-weighted spin echo sequences were used before and after the application of intravenous contrast agent. Depending on the strength of the static magnetic field, the range of repetition time/echo time (TR/TE) was 548–600/6–22 ms for the T1-weighted and 2100–6100/60–112 ms for the T2-weighted sequences. The tumor was imaged in at least two planes. For initial and follow-up scans, the imaging parameters and slice positions were maintained constant whenever possible.
Postprocessing
Depending on the best visibility of the tumor, either CT or MR images were selected individually for analysis. Thus, in 25 of all 46 patients, the response to therapy was evaluated on corresponding CT images before and after therapy. In the other 21 patients, the response was assessed on corresponding MR images. Images from older studies (before 2000) were digitized and evaluated with a free imaging software (DicomWorks, version 1.3.5, http://dicom.online.fr/). Images from newer studies (since 2000) were evaluated on a PACS workstation (Picture Archiving and Communications Systems, Magic View 1000, Siemens Medical Solutions). The tumor size according to RECIST and WHO criteria were determined with electronic calipers. The measurement of tumor volume was performed by encircling the tumor on each axial slice and multiplying the corresponding slice thickness with the encircled area to calculate the individual tumor volume (). All calculated volumes were then added up. The percentage change in tumor size for each criterion was calculated according to Equation 1:These results were subsequently assigned to the radiological response-defined categories Citation10,Citation11,Citation16 of complete response (CR), partial response (PR), stable disease (SD), and progressive disease (PD) (). All tumor measurements were made by a radiologist and an oncologist, each with experience of more than five years in oncological imaging, together in consensus. To determine the interobserver reliability, both of them performed an individual analysis of a subset of eight patients from each patient group six weeks before the consensus evaluation. They were blinded to the results of the pathohistological findings.
Figure 1. A representative CT image of a tumor mass at the left gluteal region from a patient with a leiomyosarcoma (a) before and (b) after EIA/RHT therapy (the radiological examination before therapy was performed in prone position). Solid lines were maximum diameter and perpendicular maximum diameter of the lesion for the determination of the tumor size according to RECIST and WHO criteria. Dashed lines were delineation of the lesion for the determination of the tumor size according to volumetric criteria. The response to therapy was assessed as stable disease using each radiological response criterion. The pathohistological examination yielded no response.
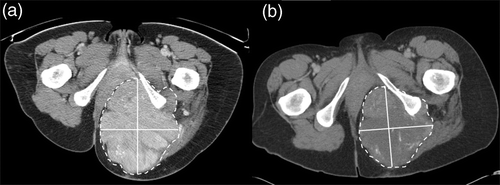
Table I. Definition of radiological response according to RECIST, WHO, and volumetric criteria.
Calculation of thermal parameters
A subset of 13 patients (8 with pathohistological complete response, 5 with no response) was assessable for intratumoral temperature measurements. For each of these patients the achieved intratumoral index temperature T90 was determined and the applied thermal dose CEM 43°C T90 was calculated for each preoperative EIA/RHT treatment. All T90 values were then summed and averaged over all 8 RHT treatments of the 4 preoperative EIA/RHT cycles. In contrast, the CEM 43°C T90 values were merely added up over all preoperative EIA/RHT treatments. CEM 43°C T90 was calculated according to the model of Sapareto Citation13,Citation14 by the equation:with
where T90i is T90 at the i-th minute during the treatment and n is the treatment time. F(T90i) is designated as thermal equivalency factor at 43°C and is a function of T90i. Δti is the time interval between the temperature measurement at the i-th minute and the last temperature measurement.
Statistical analysis
Data were initially assessed for normality by using the Kolmogorov-Smirnov test. On the basis of these results, it was decided to use the Student t-test to compare age, amount of relative change in tumor size, thermal parameters, duration of the EIA/RHT therapy as well as time between initial/final imaging examination and beginning/end of the EIA/RHT therapy, respectively, between the groups. Group differences in the number of administered EIA/RHT cycles, tumor sizes before and after therapy, and amount of absolute change in tumor size were compared by using the Mann-Whitney U test. Differences between the groups in distribution of sex, tumor entities, tumor grades, response categories, and the amount of concordant findings considering all response measurement methods were evaluated by using the χ2 test. The percentage change in tumor size before and after EIA/RHT therapy within each patient group was assessed with a Wilcoxon signed rank test. The interobserver reliability in determining tumor sizes was assessed by using interclass correlation coefficients (ICCs) Citation17. Possible values range from 0 to 1: a value of 0.5 indicates achievable by chance, value >0.6 good agreement, and value = 1 perfect agreement Citation18. The pairwise level of agreement for categorial tumor response evaluation of the three radiological approaches was measured with the κ test Citation19. The scale for the κ coefficients for agreement is described as follows: κ < 0.20 denotes poor, κ = 0.21–0.40 fair, κ = 0.41–0.60 moderate, κ = 0.61–0.80 substantial, and κ = 0.81–1.00 almost perfect. Correlation between the thermal data was calculated with the Pearson correlation coefficient. All evaluations were done using the SPSS statistical package (version 16, SPSS, Chicago, IL). A level of significance of p < 0.05 (or 0.001) for comparative measurements was used throughout the study.
Results
Patients
The good responder group consisted of 9 male patients and 10 female patients with an age ranging from 15 to 75 years and an average age of 48.84 ± 17.52 (standard deviation, SD) years. Six patients (31.6%) suffered from malignant fibrous histiocytoma (MFH), 3 patients (15.8%) from liposarcoma, and 4 patients (21.1%) from unclassified tumors. The remaining 6 patients (31.6%) had chondrosarcoma, fibrosarcoma, stromasarcoma, leiomyosarcoma, desmoid tumor and sarcoma not otherwise specified (NOS), respectively. There were 11 patients (57.9%) with grade 3 tumors, 6 patients (31.6%) with grade 2, and 2 patients (10.5%) with grade 1. In the poor responder group, 12 patients were males and 15 patients were females with an age ranging from 17 to 70 years and an average age of 46.52 ± 16.78 years. The predominant histological tumor types were 6 liposarcoma (22.2%) and 5 MFH (18.5%), followed by 4 leiomyosarcoma (14.8%). The remainder consisted of 3 synovial sarcoma (11.1%), 2 chondrosarcoma (7.4%), 2 fibrosarcoma (7.4%), 1 malignant schwannoma (3.7%), 1 rhabdomysarcoma (3.7%), 1 neurogenic sarcoma (3.7%), 1 desmoid tumor (3.7%), and 1 unclassified sarcoma (3.7%). 13 patients (48.1%) presented grade 3 tumors, 11 patients (40.7%) grade 2, and 3 patients (11.1%) grade 1. Thus, distribution of age, sex, the tumor entities, and grades did not differ significantly with p = 0.652, 0.541, 0.430, and 0.795, respectively.
All patients in the good responder group received the prescribed 4 preoperative chemotherapy EIA cycles. In 10 (52.6%) of these patients, the full number of intended 8 preoperative regional hyperthermia treatments could be administered. Five patients (26.3%) received 7 preoperative RHT treatments, and 4 patients (21.1%) received only 6. Twenty-four patients (88.9%) in the poor responder group were treated with the full number of 4 intended preoperative EIA cycles. In 3 patients (11.1%), only 3 preoperative EIA cycles could be administered. Of all patients, 13 (48.1%) had 8 preoperative RHT treatments and 8 (29.6%) of all patients had 7. In 3 patients (11.1%), only 6 preoperative RHT treatments could be applied and in 3 patients (11.1%) only 5. The reasons for not receiving the whole 4 EIA/RHT cycles were either toxicity or refusal. The number of administered EIA cycles and RHT treatments were not statistically different between the groups with p = 0.193 and 0.404, respectively.
The mean duration of the therapy (in terms of days between first and last application of EIA/RHT treatments) was equally distributed with p = 0.701. It was 76.39 ± 16.62 days in the good responder group vs. 72.50 ± 16.39 days in the poor responder group. The mean time between the imaging study before therapy and the onset of therapy was 8.94 ± 9.97 days in the good responder group vs. 7.88 ± 8.35 days in the poor responder group. This difference was not statistically significant with p = 0.356. The corresponding time period between the end of therapy and the imaging study after therapy was also comparable: 16.28 ± 8.33 days in the good responder group vs. 19.69 ± 9.58 in the poor responder group with p = 0.661.
Interobserver reliability in determining tumor sizes
Results of interobserver reliability assessment in the subset of the data indicated good to excellent agreements: interclass correlation coefficients (ICC) for RECIST, WHO, and volumetric criteria were 0.9052, 0.8198, and 0.9253, respectively.
Tumor sizes and response categories
The results are shown in . Tumor sizes before and after EIA/RHT therapy were not statistically different between the good and poor responder group in all radiological approaches (size before therapy: p = 0.655, 0.366, 0,763 for RECIST, WHO and volume, respectively; size after therapy: p = 0.435, 0.251, 0.415 for RECIST, WHO and volume, respectively). The absolute amount of change in tumor size was statistically significant within each group for all radiological approaches (p < 0.0001) resulting in significantly smaller tumor sizes after therapy (p < 0.0001). However, the absolute and percentage change in tumor size was not significantly different between the groups (absolute change: p = 0.655, 0.532, 0.867 for RECIST, WHO and volume, respectively; percentage change: p = 0.591, 0.641, 0.472 for RECIST, WHO and volume, respectively).
Table II. Tumor sizes, changes in tumor size, and number of patients in the corresponding radiological response categories. Tumor sizes before and after EIA/RHT therapy and the absolute tumor size changes are reported as median values and interquartile ranges (25%, 75%). Percentage changes in tumor size are means ± standard deviations.
The distribution of the categorical responses ‘partial response’ (PR) and ‘stable disease’ (SD) was comparable in both groups within every radiological assessment: PR ranged from 31.6% (6/19 in the good responder group for RECIST) to 37% (10/27 in the poor responder group for RECIST), SD ranged from 63.2% (12/19 for the good responder group in WHO and volume) to 70.3% (19/27 in the poor responder group for volume). The slightly smaller number of PR in comparison to SD within each group was not statistically different (RECIST: p = 0.475, WHO: p = 0.525, Volume: p = 0.421). ‘Complete response’ and 'progressive disease’ were not observed.
Correspondence of the response categories assessed with the three radiological approaches
The synopsis of RECIST, WHO, and volumetric criteria yielded concordant results in 14 (73.7%) of the cases in the good responder group and in 20 (74%) of the patients in the poor responder group. This amount of concordance was not significantly different between both patient groups (p = 0.618).
RECIST and WHO criteria were discordant in one case in the good responder group and in three cases in the poor responder group (a).
Figure 2. Evaluated percentage change in tumor size after EIA/RHT therapy according to (a) WHO criteria versus RECIST, (b) volumetric criteria versus RECIST, and (c) volumetric criteria versus WHO criteria in both good and poor responder groups. Data points in the upper left and lower right sectors show discordant categorical findings, data points in the lower left and upper right sectors represent concordant findings.
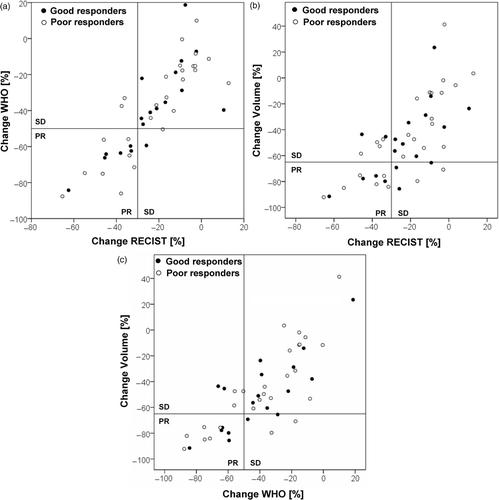
Volumetric criteria were discordant from RECIST criteria in 5 cases in the good responder group and in 6 cases in the poor responder group (b). WHO criteria were not concordant with volumetric criteria in 4 cases of the good responder group and in 5 cases of the poor responder group (c).
The findings described above are supported by the κ statistics (): The overall agreement of the three radiological approaches on all patients was substantial with κ = 0.612. Application of RECIST and WHO response criteria yielded substantial to almost perfect agreement within the patient groups (κ = 0.757 and 0.883). Volumetric response criteria showed moderate agreement with RECIST (κ = 0.417 and 0.503) and WHO (κ = 0.548 and 0.571) criteria.
Table III. Pairwise comparison and average of the level of agreement among RECIST, WHO, and volumetric criteria within the patient groups and over all patients assessed with the κ test.
Thermal parameters
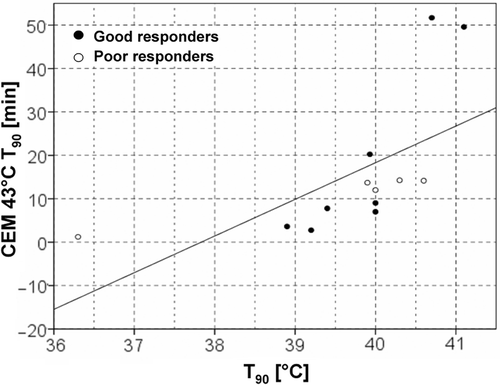
T90 was 39.90 ± 0.74°C in the good responder group vs. 39.42 ± 1.78°C in the poor responder group. CEM 43°C T90 yielded 17.96 ± 7.16 min in the good responder group and 11.07 ± 5.58 min in the poor responder group. Both parameters did not differ significantly between the groups (p > 0.327). The results of the summed CEM 43°C T90 vs. the T90 values of the 13 assessable patients are plotted in . Both parameters were significantly correlated (R = 0.627, p < 0.05). The two data points with especially high CEM 43°C T90 > 49 min corresponded to two patients who both had an excellent pathohistological and radiological response to therapy (complete response and partial response, respectively). However, considering the low number of cases, there is no threshold visible which would distinguish pathohistological good responders from poor responders by their respective T90 or CEM 43°C T90 values.
Figure 3. Calculated CEM 43°C T90 vs. T90 for each of 13 assessable patients. Both parameters were significantly correlated (R = 0.627, p < 0.05).
Discussion
In this study, we thought to assess the correlation between radiological and pathohistological tumor response to neoadjuvant thermochemotherapy in patients with high risk soft tissue sarcomas. We examined radiologically a patient population which had a good pathohistological response to therapy and compared the findings with those from a patient group with a poor pathohistological response to therapy. Both groups were composed of patients with a similar distribution of age, sex, tumor entity, and tumor grade. The radiological response was determined using three different approaches of tumor size measurement. The effect of heat on response was also determined in a subset of the studied patients by comparing the achieved thermal parameters with the radiological and pathohistological tumor response.
Baur et al. Citation20 showed in a magnetic resonance imaging (MRI) study that neoadjuvant chemotherapy combined with RHT resulted in significant reduction of tumor size and induction of tumor necrosis. Tumor necrosis occurred in some patients already after one cycle of treatment. Several previously published studies on the treatment of soft tissue sarcomas with neoadjuvant combined therapy also reported on significant reduction of tumor size after therapy Citation6–9. However, a radiological response evaluation based only on tumor size reduction often underestimates the real extent of response because fibrous tissue produced after neoadjuvant combined therapy may prevent visible shrinkage of tumor masses. Consistent with the above-quoted studies, we also found a significant reduction of tumor size after therapy within both patient groups in our study by applying all three radiological approaches. The percentage amount of reduction was slightly, but not significantly higher in the good responder group than in the poor responder group as shown in .
Considering our results, the radiological effect seems to be too small to allow conclusions on vital tumor burden and, thus, no conclusion on pathohistological tumor response could be drawn in individual cases. Consequently, computed tomography (CT) and MRI staging examinations should be conducted only with the intention to exclude progressive disease and the occurrence of distant metastasis to prevent the patient from a further unnecessary therapy regime. To assess tumor vitality in vivo, other techniques like F-18 fluorodeoxyglucose positron emission tomography (FDG-PET) Citation21 or its combination with CT (PET-CT) might be useful Citation22.
The radiological assessment methods according to RECIST, WHO and volumetric criteria yielded a good to excellent agreement in the interobserver reliability within each approach. However, in the consensus reading the observers yielded different categories of tumor response in 12 cases (26.1%) when utilizing all three different radiological approaches, leading to an overall classification of substantial agreement. In a pairwise comparison, the application of RECIST and WHO criteria yielded with 42 out of 46 patients (91.3%) the highest amount of concordant results. Volumetric criteria were discordant to RECIST in 11 cases (23.9%) and to WHO in 9 cases (19.6%). RECIST is based on the assumption that tumors are spherical and the responding patients have equivalent percentage reductions in the measures of length, width, and depth of the tumor Citation23–26. This is true in a weaker manner for WHO criteria due to the second diameter which is also taken into account. Volumetric criteria compensate violations against the above-described assumption at best. A review of all cases in our study in which discordant results occurred, showed notably irregular lesions (). Furthermore, tumors in this disease group often tend to already have irregular shapes. In agreement with Therasse et al. Citation27, our findings suggest that the uni- and bidimensional criteria RECIST and WHO can be applied in most cases to assess tumor size changes after thermochemotherapy for decision making in daily usage. They are easily understood and quick-to-perform methods, that allow simple ruler analysis on workstations and on printed films. However, three-dimensional volumetric criteria seem to be more appropriate in cases with explicitly irregular lesions. This method requires manual delineation of the tumor border on each acquired cross-sectional image, so that it is very time-consuming and not easy to use. Further technical developments like automated volumetric methods are to be expected in the future Citation28 and should thereby help implementation of this approach in clinical routine.
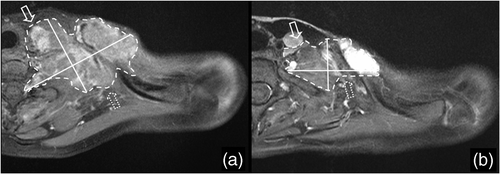
Figure 4. A representative axial T1-weighted MR image of a tumor mass at the left cervicothoracic area from a patient with a neurogenic sarcoma of the brachial plexus (a) before and (b) after EIA/RHT therapy. The tumor boundaries are irregularly shaped which is typical for sarcomas. Therefore, a homogeneous tumor shrinkage in all spatial directions could not be assumed, especially in the anterior-medial (solid arrows) and posterior-lateral (dotted arrows) parts of the tumor. Volumetric criteria yielded a partial response whereas application of RECIST and WHO criteria resulted in stable disease.
A limitation of our study is that our radiological response was assessed with different modalities (CT or MR imaging). Since the study covers a time period of 16 years, these CT or MR images were acquired on different scanners with different performances. Digitized films from older examinations may lack resolution as compared with newer scanners. In addition, CT is less sensitive to movement artifacts and can provide thinner slices with higher resolution and isovolumetric cuts than MRI. In MRI, on the other hand, contrast of tumor vs. adjacent tissues is much higher.
Finally, it has to be noted that only a relatively small number of patients (n = 46) was studied. The subjects belong to a highly selected patient population which is treated with a special therapy form. High-grade soft-tissue sarcomas are rare and the tumors are often pre-resected before combined chemotherapy and RHT can be initiated. Moreover, patients in the poor responder group were selected to match those in the good responder group as good as possible which could have induced a selection bias. However, this process was thoroughly conducted and the statistical analysis revealed no difference between these subject groups in the clinical data.
Conclusions
In this work, radiological and pathohistological response to neoadjuvant chemotherapy EIA combined with RHT in patients with STS (n = 46) were compared. The results revealed a substantial agreement among the radiological assessment methods (RECIST, WHO, and volumetric criteria), suggesting the use of the easiest RECIST for routine response evaluation. However, no significant correspondence between the radiological response and the pathohistological response was shown. This agrees with previous findings reported in the literature and is caused presumably by underestimation of the treatment effects because of the well-known effects creating tissue-edema and coagulation necrosis within the field of the heat-treated tumor. Since the number of assessable patients with intratumoral temperature measurements was low (n = 13) in this retrospective study, prospective studies with a larger sample size will be required to determine if the applied thermal dose correlates with tumor response to neoadjuvant chemotherapy combined with regional hyperthermia.
Acknowledgements
This work was supported by grant VH-VI-140 from Helmholz Association of German Research Centers (HGF) and grant SFB 455 from the German Research Foundation (DFG).
Declaration of interest: The authors report no conflicts of interest. The authors alone are responsible for the content and writing of the paper.
References
- Issels RD. High-risk soft tissue sarcoma: Clinical trial and hyperthermia combined chemotherapy. Int J Hyperthermia 2006; 22: 235–239
- Falk MH, Issels RD. Hyperthermia in oncology. Int J Hyperthermia 2001; 17: 1–18
- Lindner LH, Schlemmer M, Hohenberger P, Wust P, Abdel-Rahman S, Schmid M, Judson I, Blay JY, Verweij J, Issels RD. First interim report on the randomized EORTC 62961/ESHO-RHT 95 Intergroup Study (phase III) combined with regional hyperthermia (RHT) vs. chemotherapy alone in the treatment of high-risk soft tissue sarcomas (HR-STS) in adults. ASCO Annual Meeting Proceedings (Post-Meeting Edition). J Clin Oncol 2004; 22: 9015
- Dewey WC, Holahan EV. Hyperthermia – Basic biology. Prog Exp Tumor Res 1984; 28: 198–219
- Dewey WC. Interaction of heat with radiation and chemotherapy. Cancer Res 1984; 44: 4714s–4720s
- Issels RD, Prenninger SW, Nagele A, Boehm E, Sauer H, Jauch KW, Denecke H, Berger H, Peter K, Wilmanns W. Ifosfamide plus etoposide combined with regional hyperthermia in patients with locally advanced sarcomas: A phase II study. J Clin Oncol 1990; 8: 1818–1829
- Issels RD, Abdel-Rahman S, Wendtner C, Falk MH, Kurze V, Sauer H, Aydemir U, Hiddemann W. Neoadjuvant chemotherapy combined with regional hyperthermia (RHT) for locally advanced primary or recurrent high-risk adult soft-tissue sarcomas (STS) of adults: Long-term results of a phase II study. Eur J Cancer 2001; 37: 1599–1608
- Wendtner C, Abdel-Rahman S, Baumert J, Falk MH, Krych M, Santl M, Hiddemann W, Issels RD. Treatment of primary, recurrent or inadequately resected high-risk soft-tissue sarcomas (STS) of adults: Results of a phase II pilot study (RHT-95) of neoadjuvant chemotherapy combined with regional hyperthermia. Eur J Cancer 2001; 37: 1609–1616
- Wendtner CM, Abdel-Rahman S, Krych M, Baumert J, Lindner LH, Baur A, Hiddemann W, Issels RD. Response to neoadjuvant chemotherapy combined with regional hyperthermia predicts long-term survival for adult patients with retroperitoneal and visceral high-risk soft tissue sarcomas. J Clin Oncol 2002; 20: 3156–3164
- Miller AB, Hoogstraten B, Staquet M, Winkler A. Reporting results of cancer treatment. Cancer 1981; 47: 207–214
- Therasse P, Arbuck SG, Eisenhauer EA, Wanders J, Kaplan RS, Rubinstein L, Verweij J, Van Glabbeke M, van Oosterom AT, Christian MC, et al. New guidelines to evaluate the response to treatment in solid tumors. European Organization for Research and Treatment of Cancer, National Cancer Institute of the United States, National Cancer Institute of Canada. J Natl Cancer Inst 2000; 92: 205–216
- Therasse P, Eisenhauer EA, Verweij J. RECIST revisited: A review of validation studies on tumour assessment. Eur J Cancer 2006; 42: 1031–1039
- Oleson JR, Samulski TV, Leopold KA, Clegg ST, Dewhirst MW, Dodge RK, George SL. Sensitivity of hyperthermia trial outcomes to temperature and time: Implications for thermal goals of treatment. Int J Radiat Oncol Biol Phys 1993; 25: 289–297
- Sapareto SA, Dewey WC. Thermal dose determination in cancer therapy. Int J Radiat Oncol Biol Phys 1984; 10: 787–800
- Issels RD, Lindner LH, Wust P, Hohenberger P, Jauch K, Daugaard S, Mansmann U, Hiddemann W, Blay J, Verweij J. Regional hyperthermia (RHT) improves response and survival when combined with systemic chemotherapy in the management of locally advanced, high grade soft tissue sarcomas (STS) of the extremities, the body wall and the abdomen: A phase III randomised pros. ASCO Annual Meeting Proceedings Part I. J Clin Oncol 2007; 25: S10009
- Chappell R, Miranpuri SS, Mehta MP. Dimension in defining tumor response. J Clin Oncol 1998; 16: 1234
- Shrout PE, Fleiss JL. Intraclass correlations: Uses in assessing rater reliability. Psychol Bull 1979; 86: 420–428
- Shrout PE, Spitzer RL, Fleiss JL. Quantification of agreement in psychiatric diagnosis revisited. Arch Gen Psychiatry 1987; 44: 172–177
- Landis JR, Koch GG. The measurement of observer agreement for categorical data. Biometrics 1977; 33: 159–174
- Baur A, Stabler A, Wendtner CM, Arbogast S, Rahman SA, Santl M, Issels R, Reiser M. MR-imaging changes of musculoskeletal soft-tissue sarcomas associated with neoadjuvant chemotherapy and hyperthermia. Int J Hyperthermia 2003; 19: 391–401
- Amthauer H, Denecke T, Rau B, Hildebrandt B, Hunerbein M, Ruf J, Schneider U, Gutberlet M, Schlag PM, Felix R, et al. Response prediction by FDG-PET after neoadjuvant radiochemotherapy and combined regional hyperthermia of rectal cancer: Correlation with endorectal ultrasound and histopathology. Eur J Nucl Med Mol Imaging 2004; 31: 811–819
- Hicks RJ, Toner GC, Choong PF. Clinical applications of molecular imaging in sarcoma evaluation. Cancer Imaging 2005; 5: 66–72
- Byrne MJ, Nowak AK. Modified RECIST criteria for assessment of response in malignant pleural mesothelioma. Ann Oncol 2004; 15: 257–260
- Prasad SR, Saini S, Sumner JE, Hahn PF, Sahani D, Boland GW. Radiological measurement of breast cancer metastases to lung and liver: Comparison between WHO (bidimensional) and RECIST (unidimensional) guidelines. J Comput Assist Tomogr 2003; 27: 380–384
- van Klaveren RJ, Aerts JG, de Bruin H, Giaccone G, Manegold C, van Meerbeeck JP. Inadequacy of the RECIST criteria for response evaluation in patients with malignant pleural mesothelioma. Lung Cancer 2004; 43: 63–69
- Werner-Wasik M, Xiao Y, Pequignot E, Curran WJ, Hauck W. Assessment of lung cancer response after nonoperative therapy: Tumor diameter, bidimensional product, and volume. A serial CT scan-based study. Int J Radiat Oncol Biol Phys 2001; 51: 56–61
- Therasse P, Le Cesne A, Van Glabbeke M, Verweij J, Judson I. RECIST vs. WHO: Prospective comparison of response criteria in an EORTC phase II clinical trial investigating ET-743 in advanced soft tissue sarcoma. Eur J Cancer 2005; 41: 1426–1430
- Marten K, Auer F, Schmidt S, Kohl G, Rummeny EJ, Engelke C. Inadequacy of manual measurements compared to automated CT volumetry in assessment of treatment response of pulmonary metastases using RECIST criteria. Eur Radiol 2006; 16: 781–790