
Abstract
Purpose: (1) To analyse rehydration, thermal convection and increased electrical conductivity as the three phenomena which distinguish the performance of internally cooled electrodes (IC) and internally cooled wet (ICW) electrodes during radiofrequency ablation (RFA), (2) Implement a RFA computer model with an ICW which includes these phenomena and (3) Assess their relative influence on the thermal and electrical tissue response and on the coagulation zone size.
Methods: A 12-min RFA in liver was modelled using an ICW electrode (17 G, 3 cm tip) by an impedance-control pulsing protocol with a constant current of 1.5 A. A model of an IC electrode was used to compare the ICW electrode performance and the computational results with the experimental results.
Results: Rehydration and increased electrical conductivity were responsible for an increase in coagulation zone size and a delay (or absence) in the occurrence of abrupt increases in electrical impedance (roll-off). While the increased electrical conductivity had a remarkable effect on enlarging the coagulation zone (an increase of 0.74 cm for differences in electrical conductivity of 0.31 S/m), rehydration considerably affected the delay in roll-off, which, in fact, was absent with a sufficiently high rehydration level. In contrast, thermal convection had an insignificant effect for the flow rates considered (0.05 and 1 mL/min).
Conclusions: Computer results suggest that rehydration and increased electrical conductivity were mainly responsible for the absence of roll-off and increased size of the coagulation zone, respectively, and in combination allow the thermal and electrical performance of ICW electrodes to be modelled during RFA.
Introduction
Radiofrequency ablation (RFA) is a minimally invasive procedure using radiofrequency (RF) electrical currents to selectively heat tumours, causing their destruction by thermal coagulative necrosis [Citation1,Citation2]. The roll-off phenomenon is produced during heating and consists of a sudden increase in electrical impedance caused by the charring and dehydration of the tissue around the electrode [Citation3]. When roll-off occurs the entire electrode is completely encircled by the dehydrated tissue, which obstructs energy diffusion and limits the coagulation zone size. Changing the electrode design can sometimes overcome this drawback; for instance, internally cooled (IC) electrodes prevent the adjacent tissue from charring and consequently can produce larger coagulation zones than conventional (dry) electrodes [Citation4]. Although IC electrodes are commonly used, the coagulation zone obtained by them is limited to ≈2.5 cm [Citation5]. In order to achieve larger coagulation volumes, wet electrodes infuse isotonic (0.9% NaCl) or hypertonic (20% NaCl) saline into the tissue through one or more perforations in the electrode surface [Citation6,Citation7]. This interstitial infusion enhances RF power deposition, improves electrical and thermal conductivity of tissue during ablation and prevents the tissue from vaporising and charring [Citation6–9]. Finally, internally cooled wet (ICW) electrodes combine saline infusion and internal cooling of the electrode [Citation10] and have been clinically used for RFA of hepatic tumours [Citation11]. Previous experimental studies have shown that ICW electrodes can create larger coagulation zones than IC and wet electrodes separately [Citation12–14]. This could be explained by their electrical performance, in particular by the delay or lack of roll-off. It is thought that rehydration could play a relevant role, that is infusion could compensate for desiccation by the continuous supply of liquid to the zone in which vaporisation occurs, and consequently keep impedance low for a longer period, thus allowing the creation of larger coagulation zones [Citation15,Citation16]. Two other effects could also influence the capacity of ICW electrodes to create larger coagulation zones: (1) the increase in tissue electrical conductivity by infused saline and (2) the thermal convection produced by the flow of saline. The relative importance of these three phenomena (rehydration, thermal convection and increased electrical conductivity) in the delay or total absence of roll-off and in coagulation zone size is an issue, which remains to be clarified. Our aim was (1) analyse the biophysics associated with the thermal and electrical performance of ICW electrodes and identify the phenomena which distinguish the modelling of IC and ICW electrodes, (2) implement a computer modelling including the identified phenomena and (3) study their effect on tissue electrical and thermal performance and coagulation zone size.
Since theoretical modelling can provide a comprehensive and detailed biophysical description of the electrical and thermal performance of ICW electrodes, we planned a study to assess the impact of each phenomenon separately. The computational results obtained were compared with the experimental results of previous studies [Citation5,Citation11,Citation12,Citation17,Citation18] in terms of coagulation zone size and impedance evolution.
Methods
Background
An ICW electrode delivers RF current and saline simultaneously, which means these are mutually coupled phenomena. In electrical power application, RF current produces a temperature increase which has two main effects: (1) an increase in tissue electrical conductivity up to a limit temperature of ≈100 °C and (2) above this limit temperature, tissue dehydration by water vaporisation, which involves a drastic and sudden drop in electrical conductivity. The saline infusion chiefly causes: (3) rehydration of the previously dehydrated tissue (at temperatures around 100 °C), (4) thermal convection by saline infusion into the tissue and (5) the increased electrical conductivity of the tissue. All these phenomena are interrelated as follows: the tissue rehydrated by saline infusion partially impedes total dehydration due to vaporisation, which occurs when the tissue temperature reaches ≈100 °C, since the water loss is balanced by the saline infusion. The secondary effects include: changes in electrical conductivity of the background tissue due to the saline infusion (with different electrical conductivity to non-infused tissue), modification of the temperature increase produced by RF currents, and hence the increased tissue electrical conductivity.
Phenomena (1) and (2), associated with the application of RF current, have been extensively considered in previous modelling studies [Citation19,Citation20]. However, there are very few studies on the modelling of phenomena (3), (4) and (5), related to saline infusion and its influence on RF delivery. Demazunder et al. [Citation21] built a computational model of an irrigated electrode during RF cardiac ablation, but only modelled the thermal convection as a boundary condition along the electrode-tissue interface. Antunes et al. [Citation22] built a model of an irrigated electrode during RFA in liver and focussed on how the electrical and thermal conductivities varied with saline content. Neither of these two studies simultaneously assessed all the phenomena associated with saline infusion and its effect on RF heating.
In a previous computational study, we modelled the hypertonic saline infusion simply with a convective term in the governing equation and an electrical conductivity function that varied with distance from the infusion point [Citation16]. Although the results reproduced a delay in roll-off, this was never totally absent. Neither was this model able to explain the low repeatability of the number of roll-offs and the time of their appearance, as observed experimentally. This suggests that a more realistic model of an ICW electrode for RFA should include a combination of additional issues.
General issues of the theoretical model
We considered RF hepatic ablation with a monopolar arrangement, in which RF current flows between an active electrode and a grounding patch placed on the patient’s body surface (dispersive electrode). We considered a 1.5-mm diameter 17 G ICW as an active electrode with a 3-cm active tip, which combines an IC circuit and an isotonic saline perfusion system (0.9% NaCl). shows the geometry of the electrode and how it was simplified to a two-dimensional model by assuming that the problem presented axial symmetry. The dispersive electrode was modelled as an electrical condition on boundaries at a distance from the active electrode. Tissue dimensions were checked by a convergence test to be large enough to keep tissue surfaces at boundary tissue temperature and voltage. We used the value of the maximum temperature (Tmax) reached in the liver at the first roll-off time as a control parameter in these analyses. When there was a difference of less than 0.5% in Tmax between simulations we considered the former dimension as appropriate.
Figure 1. (A) Three-dimensional scheme of the real geometry (out of scale and dimensions in mm). The domain is divided into three zones: plastic portion of the electrode, metallic cooled electrode and hepatic tissue. The zoom shows the ICW electrode system, in which the isotonic saline is infused into the tissue through two microholes (0.03 mm in diameter). Arrows show the direction of saline flow. (B) Two-dimensional geometry used in the study. Dashed curve shows the spatial distribution of saline.
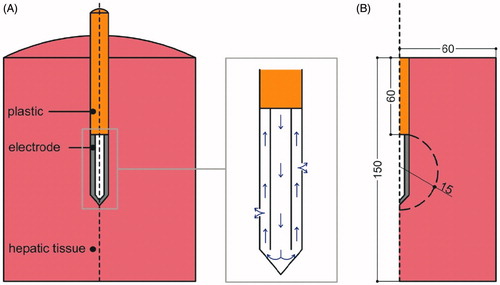
We assumed that saline exits through two 0.03-mm diameter microholes () [Citation12], so their effective area was (2πr2 = 2π(0.015)2 = 1.41 × 10⁻³ mm2). Due to the axial symmetry, we mimicked these holes by means of a short segment on the surface of the electrode at the mid-point of its length, which is a cylinder in the real geometry. As the equivalent cylinder has to have the same area as the microholes (2πr2L = 1.41 × 10⁻³ mm2), so L = 3 × 10⁻⁴ mm, r2 being the radius of the electrode (= 0.75 mm). The model was based on a coupled electric-thermal problem, which was solved numerically on COMSOL Multiphysics software (COMSOL, Burlington, MA). The thermal problem was solved using the bioheat equation:
(1) where ρ is tissue density, c is specific heat, T is temperature, t is time, k is thermal conductivity, q heat source produced by RF power, Qp is the heat loss by blood perfusion and Qm is the metabolic heat generation. This last term was not considered since it is negligible in RFA. The characteristics of materials used in the model are shown in [Citation23–26]. The RF power heat source was given by q = σ|E|2, where E is the electric field obtained from the electrical problem and σ is the electrical conductivity. Equation ∇·σ∇V = 0 was the governing equation for the electric problem, V being the voltage. The electric field was calculated from E = –∇V. We used a quasi-static approach since the resistive current is much lower than the displacement current at RF (≈500 kHz) [Citation27]. The blood perfusion heat Qp is computed from:
(2) where ρb is density of blood (1000 kg/m3) [Citation20], cb is specific heat of blood (4180 J/kg K) [Citation28], Tb is blood temperature (37 °C), ωb is the blood perfusion coefficient (0.019 s−1) [Citation29] and β is a coefficient which took the values of 0 and 1 according to the value of the thermal damage: β = 0 for Ω ≥ 4.6, and β = 1 for Ω < 4.6. The parameter Ω was assessed by the Arrhenius damage model [Citation30], which associates temperature with exposure time by a first-order kinetics relationship:
(3) where R is the universal gas constant, A (7.39 × 1039 s−1) is a frequency factor and ΔE (2.577 × 10⁵ J/mol) is the activation energy for the irreversible damage reaction [Citation31].
Table 1. Characteristics of the materials used in the theoretical model [Citation23–26].
Thermal boundary conditions were: Null thermal flux in the transversal direction to the symmetry axis and constant temperature of 37 °C in the tissue boundaries. The cooling effect produced by the liquid circulating inside the electrode was modelled on Newton’s law of cooling, using a thermal convection coefficient h with a value of 3127 W/K m2 and a coolant temperature of 10 °C. The value of h was calculated by considering a length of 30 mm and a flow rate of 45 mL/min through an area equivalent to half of the cross section of the inner diameter of the electrode (see . Initial temperature of the tissue was considered to be 37 °C.
Electrical boundary conditions were: zero current density in the transverse direction to the symmetry axis, in the tissue boundaries and inside the electrode, zero voltage in the dispersive electrode (bottom and top tissue surfaces) and current value of 1.5 A applied in the active electrode [Citation32]. Once roll-off occurs, power is switched off for 15 s and then a new current pulse is applied until the next roll-off [Citation33]. This procedure is repeated for a period of 12 min.
The model mesh was heterogeneous, with a finer mesh size at the electrode–tissue interface, where the highest electrical and thermal gradients were expected. All the mesh elements used were triangular. In the case of the time-step we used an adaptive scheme since we let the time-stepping method choose time steps freely. The suitable mesh size and time-step were assessed by means of a convergence test with the same characteristics as those used for outer dimensions of geometry.
Modelling the phenomena associated with the RF power application
RF current produces heating in the tissue by ionic agitation. Increasing the temperature has two remarkable effects: first, as the temperature rises, tissue electrical conductivity (σ) also goes up to a limit temperature ≈100 °C. Second, this temperature value causes water vaporisation and consequently tissue dehydration. Water vaporisation implies a phase change, while the dehydration involves a drastic drop of σ above this limit temperature (≈100 °C). In order to include these phenomena in the modelling we used:
A mathematical piecewise function for σ which uses different mathematical expressions according to the temperature range [Citation19,Citation20]. σ increases with temperatures up to 100 °C and at temperatures above 100 °C vaporisation occurs and desiccation implies a drastic drop in σ. In the present study, we represented the temperature dependence of σ by a function which assumes an exponential increase rate of +1.5%/ °C for T < 100 °C and a linear drop by 2 orders of magnitude between 100 and 105 °C for T > 100 °C [Citation34], as shown in .
Figure 2. Electrical conductivity (σ) variation with temperature. The temperature dependence of σ was represented by a function which assumes for T < 100 °C an exponential increase rate of +1.5%/ °C and for T > 100 °C a linear drop by 2 orders of magnitude between 100 and 105 °C [Citation34].
![Figure 2. Electrical conductivity (σ) variation with temperature. The temperature dependence of σ was represented by a function which assumes for T < 100 °C an exponential increase rate of +1.5%/ °C and for T > 100 °C a linear drop by 2 orders of magnitude between 100 and 105 °C [Citation34].](/cms/asset/e53b198d-e5f2-4447-8820-3602c6c9c451/ihyt_a_1303751_f0002_c.jpg)
The enthalpy method was used to incorporate the phase change due to water vaporisation [Citation35,Citation36]. The use of this method implies modifying the bioheat equation used as the governing equation for the thermal problem in the following way:
(4)
where h is tissue enthalpy. Enthalpy is related to tissue temperature by the following expression [Citation35]:
Modelling the phenomena associated with saline infusion
The phenomena associated with saline infusion are mainly: thermal convection by saline movement inside the tissue, rehydration of the tissue previously dehydrated, and the higher tissue electrical conductivity associated with the saline infusion pattern. The last two phenomena are related to the effects of applying the RF current mentioned above. Tissue rehydration partially blocks dehydration. Note that although vaporisation does occur when the temperature reaches ≈100 °C, the saline infusion balances the water loss. The changes in the electrical conductivity of the background tissue due to the saline also modify the temperature rise produced by the RF current, and so the increase in σ. To include these phenomena we made the following modifications:
Convection modification: A new term was added to EquationEquation (3)
u being the velocity field (m/s) of the saline inside the tissue, which depends on the infusion rate. The term u was computed by using the Darcy equation [Citation37]:
Conductivity modification: A modification was made to the σ expression shown in , which consisted of considering higher values of σ (37 °C). We initially considered σ (37 °C) = 0.19 S/m for the liver tissue without the presence of saline. This value was in the range proposed for liver electrical conductivity at 37 °C [Citation29] and matches with initial experimentally observed impedance values [Citation16]. However, as liver σ increases with the presence of saline [Citation16], we assessed the impact of using higher values for σ (37 °C) in the tissue zone affected by saline. Since we used a constant current protocol, a higher value of σ (37 °C) implied a smaller impedance value and hence a smaller power value and smaller coagulation zone. In order to estimate the real effect of the σ (37 °C) value, we therefore modulated the applied current in order to have the same initial voltage value despite the changes of σ (37 °C). We increased σ (37 °C) up to a value whose corresponding current was 2 A, which is the maximum current applied by the generators usually employed in this type of ablation.
Phase-change modification: A modification was made to EquationEquation (4)
where F is a factor used to multiply latent heat. The higher the F value is, the greater the amount of energy required. As far as we know, this parameter has never been used before and so we conducted a sensitivity analysis to assess the impact of different values in the interval [Citation1,Citation10].
Regarding the porosity of the desiccated tissue, that is changes in hydraulic permeability once the tissue has been completely denatured by heat, two interesting experimental studies [Citation39,Citation40] reported that permeability decreases after RF application (a mean of 43 ± 19.8%, [Citation39]), which means that desiccated tissue does not completely lose its hydraulic permeability, so that in a first approach we can assume that rehydration is constant (i.e. factor F is constant).
A value of u = 0 m/s, σ (37 °C) = 0.19 S/m and F = 1 represented the case in which there was no saline infusion and the electrode worked as an IC electrode. This was considered to be the control case (which will be used as a reference to assess the effect of introducing convection, conductivity and phase-change modifications).
Saline spatial distribution
EquationEquations (6)(6) and Equation(7)
(7) were applied exclusively in the area in which the saline was distributed. Experimental studies have reported that saline follows a heterogeneous spatial distribution in tissue [Citation38,Citation41]. Since our objective was to assess the impact of each factor of saline infusion, we considered a general pattern represented by a circular distribution, assuming that saline was distributed symmetrically around the electrode, which represented an “ideal” distribution (see ). This circular area was assumed to be placed in the centre of the electrode, had a radius of 0.015 m and covered the electrode, as has been observed experimentally [Citation38].
Outcomes
The following outcomes were analysed: (1) times when roll-offs occur and time between two consecutive roll-offs, (2) evolution of electrical variables (voltage, power and impedance) and (3) evolution of the short (also known as transverse) diameter of the coagulation zone. The representation of the coagulation zone by the Arrhenius damage model at 12 min provided by the numerical resolution produced a “very noisy” contour. According to [Citation42] the 48–50 °C isotherm correlates with the thermal damage contour D99 to compute the lesion dimension contour, which corresponds to Ω = 4.6 (99% probability of cell death) after a 12 min protocol. In the present study, we verified that the 50 °C isotherm really matched with Ω = 4.6 (differences were <2 mm) and the isotherm provided a better defined line and so decided to use the 50 °C isotherm to measure the coagulation zone diameter.
Results
In the control case, we found that the first roll-off occurred 45 s after beginning the RFA, there was a total of 16 roll-offs in a period of 12 min, and the short diameter and volume of the coagulation zone was 2.98 cm and 17.53 cm3, respectively (see ). The evolution of impedance, voltage and power are shown in .
Figure 3. Impedance, power and voltage evolution during a 12 min RFA for the control case (σ(37 °C) = 0.19, F = 0 and u = 0) using a current value of 1.5 A.
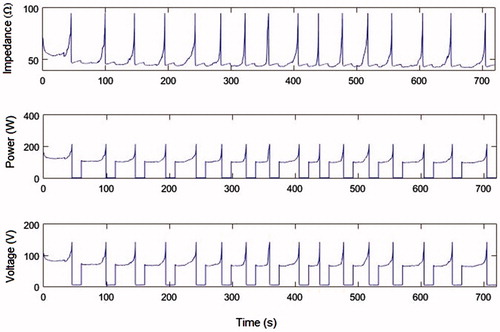
Table 2. Computer results for the internally cooled electrode (IC, case A), and internally cooled-wet electrode (ICW, cases B–K): diameters (a: short, b: axial) and volume (V) of the coagulation zone, time of first roll-off (t1), and number of roll-offs (N).
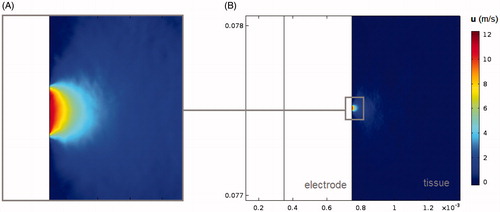
shows the short and axial diameters of the coagulation zone, its volume, the time of the first roll-off and the number of roll-offs at 720 s RFA in all the analysed cases, except the cases with a convection modification. The results of these cases are not given, since when we only assessed the impact of thermal convection (at high and low saline infusion rates) we did not find any differences with the control case. In order to explain this finding, shows the velocity field u obtained from the Darcy problem using a high rate of saline infusion. It can be seen that the saline velocity is drastically reduced with distance from the infusion point, which confines the effect of saline convection to a radial area of ≈0.1 mm around the infusion point.
Figure 4. Velocity field u obtained from the Darcy problem using a high rate of saline infusion in the area of saline distribution (B) and with a zoom-in on the area of saline distribution around the infusion zone (A).
To assess the impact of increasing electrical conductivity, we first decided the σ (37 °C) values to be used. Initially, we thought of progressively raising the σ (37 °C) value in the control case by ≈0.1 S/m (i.e. 0.3, 0.4, 0.5, … S/m). Changes in σ (37 °C) also implied changes in the current applied, which had to be modulated to obtain the same initial voltage value as in the control case (≈110 V, see . This meant that we had to use currents of I = 1.85, 2.1 and 2.4 A for σ (37 °C) values of 0.3, 0.4 and 0.5 S/m, respectively. Since the current value in RF generators cannot exceed 2 A, in these three cases we could only consider the case of σ (37 °C) = 0.3 S/m (case B in ). We also decided to include the case of the maximum current allowed (I = 2 A), which was σ (37 °C) = 0.35 S/m (case C in ). We then considered an additional case corresponding to σ (37 °C) = 0.5 S/m with a I = 2.4 A (case D in ). Since this current value exceeded the limit, there was a notable increase in σ (37 °C) and therefore their effect would also be more notable.
shows that coagulation zone size increases with the value of σ (37 °C). For the case of σ (37 °C) = 0.35 S/m and I = 2 A (case C) the coagulation zone minor diameter was 7% bigger than the control case and 25% bigger in case D, and these differences were greater (≈40% and 60%) in terms of the coagulation zone volume. The electrical response also registered differences with respect to the control case, since in cases B, C and D there was a delay in first roll-off time (22, 25 and 26 s, respectively) and fewer total roll-offs (13, 13 and 12 roll-offs). Note that these differences were similar in the three cases, since the maximum difference in first roll-off time was 4 s, and 1 roll-off with respect to the total number of roll-offs. The initial impedance and voltage values were similar in the three cases as a result of modulating the current value.
About the effect of tissue rehydration (Cases E, G and H), we observed that the higher the F values, the greater the changes in the different outcomes with respect to the control case. The coagulation zone volume increased by ≈50% of the control case (IC electrode) value and there was a considerable impact on the roll-off phenomenon: with a delay in the first roll-off time of 133, 257 and 563 s and a reduction of 9, 12 and 15 in total roll-offs ().
Figure 5. Impedance evolution during 12 min of RF ablation (1.5 A) and created coagulation zone diameters for the considered cases (see ). A: case without saline infusion, that is without rehydration, corresponding with an IC electrode. In the case of ICW electrodes, a more and more effective rehydration, modelled by increasing values of the factor F (from 3 to 10, cases E, G and H) delays the appearance of the first roll-off (dashed rows represent this respect with to the case of an IC electrode) and allows larger coagulation zones to be created. Furthermore, when saline infusion allows increasing the background electrical conductivity (from 0.19 to 0.35 S/m), the maximum current to be applied during RF ablation can be augmented to 2.0 A, and as a result the first roll-off delays a bit more and the created coagulation zone is even larger (case K). Grey zone represents the range of coagulation zone diameters reported in experimental studies using ICW electrodes.
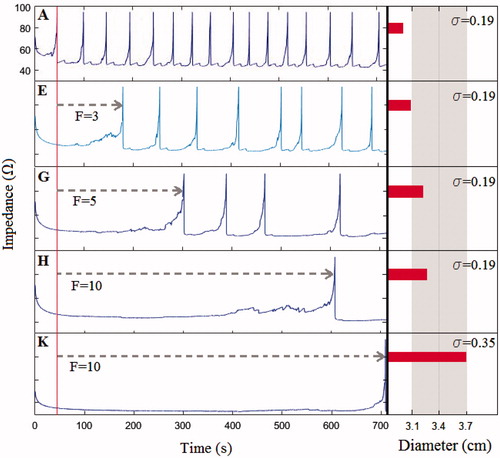
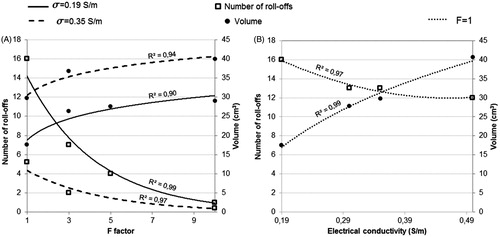
Finally, we varied σ (37 °C) and F simultaneously. In case J, we used F = 3 and σ (37 °C) = 0.35 S/m, for which the corresponding current was 2 A and in case K we used F = 10 and the σ (37 °C) = 0.35 S/m (current 2 A), as is shown in . The combination of both phenomena had a greater effect on all the analysed outcomes than when they were considered separately. For example, when σ (37 °C) = 0.35 S/m and F = 10 (case K), the coagulation zone minor diameter increased by 23% more than the control case, while the increase was 7% and 10% in the cases in which the phenomena were considered separately (change of σ (37 °C) = 0.35 S/m only, case C, and the change F = 10 only, case H, respectively). The delay in first roll-off was 664 s when the phenomena were combined (case K) and 25 and 563 s when they were considered separately (cases C and H). In fact, in case K roll-off was practically absent (). On the other hand, we did not find any changes with respect to the results of cases J and K, also adding the phenomena of convection. Overall, it is observed that both σ and F have a strong influence on number of roll-offs and coagulation zone volume. In this respect, shows the relationship between the number of roll-offs and the coagulation zone volume with variations in factor F and the electrical conductivity values, respectively. The data in are extracted from with the trend lines for every case. Both figures A and B show that for the range of values and the electrical conductivity used for factor F, these variables show a strong influence on the number of roll-offs and coagulation size, which is supported by the high values of the square of the correlation coefficient (R2). In both cases A and B, R2 is obtained from an exponential correlation for the graphs which represents the relationship of F and σ with the volume, and logarithmic for those representing the relationship with the number of roll-offs.
Figure 6. Relationship between the number of roll-offs (squares) and the coagulation zone volume (circles) with respect to variations in factor F (A) and electrical conductivity (B). Data are extracted from and lines are the corresponding trend lines, R2 being the square of the correlation coefficient.
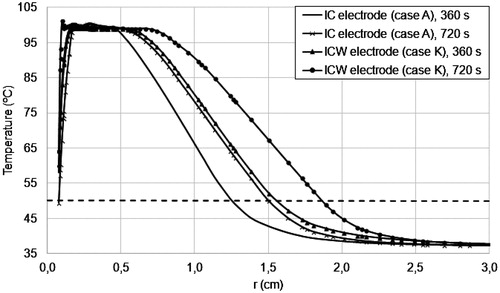
shows the temperature radial distribution at line z = 0.075 m for the control case (IC electrode) and case K (ICW electrode) for t = 6 and t = 12 min. These results show that ICW electrodes can reach high temperatures (above 50 °C) at points further away and consequently achieve a greater coagulation zone volume.
Figure 7. Temperature profiles in the tissue at 6 and 12 min of RF ablation for IC and ICW electrodes (cases A and K, respectively). Black dashed line represents the 50 °C isotherm.
Discussion
In line with our objective, we identified the phenomena which distinguish the performance of IC and ICW electrodes, modelled these phenomena and assessed their relative influence on coagulation zone size and tissue electrical and thermal performance. We found rehydration, thermal convection and increased electrical conductivity to be the three phenomena associated with the use of ICW electrodes that are mainly responsible for their electrical and thermal performance being different from IC electrodes. Specifically, we found that greater coagulation zone size and delay in the occurrence of roll-off are the primary outcomes which characterised the use of ICW electrodes vs. the IC.
We built a computational model of an ICW electrode by modifying the formulation of an IC electrode model in order to represent the above-mentioned phenomena. The saline convection was modelled by introducing a term of heat convection in the governing equation for the heat problem. This new term did not cause any changes in the results obtained with the IC electrode. We assessed two different saline infusion velocities u, but none of them was high enough to have a noticeable thermal effect on tissue. Rates of saline infusion higher than 1 mL/min are not usual in clinical practice. Higher values of σ (and current values modulated in concordance with σ in order to have the same initial voltage value as the control case) were used to model the increase in electrical conductivity. The effect of this phenomenon was more noticeable in coagulation zone size. By increasing the value of electrical conductivity, it was possible to obtain coagulation zone sizes in the range of those obtained experimentally [Citation18]. However, the isolated phenomenon of higher electrical conductivity, even though it delayed roll-off time, was not able to eliminate it completely. On the other hand, rehydration, modelled by introducing factor F into the enthalpy method of vaporisation, had a notable effect on delaying roll-off, and could totally eliminate it at high enough F values. It is important to note that by considering the rehydration phenomenon only, the computed coagulation zones did reach the range obtained experimentally. Only the simultaneous combination of increasing electrical conductivity and rehydration allowed the absence of roll-off and enlarged coagulation zone to be mimicked, as has been observed experimentally [Citation5,Citation18].
In the case of an IC electrode, roll-off occurs when the 100 °C isotherm completely surrounds the electrode [Citation3]. This is due to the abrupt drop in tissue electrical conductivity at temperatures higher than 100 °C. In contrast, although the temperature around the ICW electrode also goes up to 100 °C (), the rehydration phenomenon (mimicked in this study by factor F) prevents the tissue from exceeding this limit and so reduces the tissue electrical conductivity and consequently roll off is delayed. With the rehydration a greater amount of energy is necessary to produce tissue phase-change, which means a lower amount of energy available to raise the tissue temperature (see EquationEquation (4)(4) ). So, for higher F values, a higher limitation to achieving tissue phase-change (and so, roll-off) is assumed. However, the relationship between the F value and the coagulation zone volume was not linear (see ), which means that the growth of the coagulation zone size with respect to F will be negligible for a specific F value. Likewise, although the electrical conductivity showed a strong influence on the number of roll-offs and the coagulation zone volume, their rate of change with σ decreases as σ increases.
We did not observe noticeable differences in the electrical performance of the cases in which we varied the value of electrical conductivity (cases B, C and D), however these cases presented noticeable differences with the control case (IC electrode modelling). The only difference in the modelling of all these cases was in the value of electrical conductivity and the corresponding modulated current value, so it was surprising that cases B, C and D presented differences with the control case but not with each other. A possible explanation for this fact may be found in [Citation32], in which authors observed that differences in electrical performance were reduced when current was increased.
Comparison with experimental and clinical results
To validate our computer results we compared them with some previous experimental and clinical studies.
As regards the electrical performance of an IC electrode during RF ablation, in [Citation16] the authors showed that in a typical impedance evolution throughout a 12-min ablation with an IC electrode, roll-offs appeared more or less equidistantly spaced in time, and the first roll-off appeared before the first 60 s (see of [Citation16]). This pattern was also found in , which shows the impedance evolution obtained for the control case (IC electrode) by means of computer simulations. In the case of an ICW electrode, our results show that this electrode delays the first roll-off and may even eliminate it under certain circumstances, as observed in case K (see and . Romero-Méndez et al. [Citation16] also showed experimentally that the ICW electrode not only delays roll-off ( in [Citation16]), but can even make it disappear completely ( in [Citation16]). Similar results were also found in [Citation43,Citation44].
We selected four studies on the analysis of coagulation zone volume whose experimental conditions were identical to the physical situation considered in the computer model, that is a 17-gauge ICW electrode with 3-cm exposed tip, a couple of tiny side holes (0.03 mm diameter) to conduct the interstitial infusion of saline, and 12-min ablation using impedance control [Citation11,Citation12,Citation17,Citation18]. With these conditions, the reported volumes ranged from 29.3 ± 10.9 cm3 [17] to 49.21 ± 21.18 cm3 [18]. We obtained coagulation zone volumes in the range of 26.31–40.62 cm3 in the computer simulations, which is in the order of those obtained experimentally. This agreement was also found when we analysed the coagulation zone volumes created with IC electrodes (case A in our study): values of 15.2 ± 6.7 cm3 and 11.05 ± 4.27 cm3 in experimental studies [Citation11,Citation12] vs. 17.53 cm3 in computer simulations. Note that the differences between coagulation zone volume produced by IC and ICW electrodes in experimental studies were 53% [Citation11] and 50% [Citation12], while computationally we obtained a difference of 56% by comparing the IC electrode case with case K.
Limitations of the study
We assumed the ideal circular distribution of saline around the electrode, which would maximise the effect of the phenomena studied. This means that that under conditions of heterogeneous or irregular saline distributions, the influence of increasing electrical conductivity and rehydration could be reduced. Despite these limitations, the results suggest that the mathematical framework considered here could be included in modelling ICW electrodes. Moreover, we assumed the continuous rehydration of tissue during RFA, as employed in clinical practice [Citation18]. It has also been reported that greater coagulation zones can be created when saline is infused prior to RFA [Citation45,Citation46]. Even when the application is before RFA, the tissue remains hydrated during the RFA process, so that when modelling the biophysics of this process it would still be valid to consider the F factor.
We propose the idea of a constant factor F modulating the mathematical formulation associated with rehydration. The inclusion of F is only one possible way of hindering tissue vaporisation, as other mathematical approaches, for example based on a water-content function, could also be valid to model the rehydration associated with ICW electrodes. The results suggest that the proposed mathematical approach makes sense, at least in terms of observing a considerable delay in roll-off and increased coagulation volume as compared to the case without saline infusion. Future studies could be planned to give physical support to this mathematical approach, and even to correlate the exact value of F with the hydraulic permeability of different tissue conditions (healthy, cirrhotic, extremely fatty, etc.).
Conclusions
We made some changes in the formulation of an IC in order to model the phenomena which distinguish it from ICW electrodes: higher electrical conductivity, heat convection and rehydration. We also assessed the effect of these changes on coagulation zone size and the tissue electrical and thermal response and found that the combination of tissue rehydration and higher electrical conductivity should be taken into account to increase coagulation zone size in RFA applications. However, it was not considered necessary to take into account the convection phenomenon to model an ICW electrode for the different saline infusion velocities used.
Acknowledgements
This work was supported by the Government of Spain through the Spanish Plan Estatal de Investigación, Desarrollo e Innovación Orientada a los Retos de la Sociedad under grant number TEC2014-52383-C3-R (TEC2014-52383-C3-1-R).
Disclosure statement
The authors report no conflicts of interest. The authors alone are responsible for the content and writing of the article.
Additional information
Funding
References
- Kohlhase KD, Korkusuz Y, Gröner D, et al. (2016). Bipolar radiofrequency ablation of benign thyroid nodules using a multiple overlapping shot technique in a 3-month follow-up. Int J Hyperthermia 32:511–16.
- Zhang F, Wu G, Sun H, et al. (2014). Radiofrequency ablation of hepatocellular carcinoma in elderly patients fitting the Milan criteria: a single centre with 13 years experience. Int J Hyperthermia 30:471–9.
- Trujillo M, Alba J, Berjano E. (2012). Relationship between roll-off occurrence and spatial distribution of dehydrated tissue during RF ablation with cooled electrodes. Int J Hyperthermia 28:62–8.
- McGahan JP, Dodd GD. (2001). Radiofrequency ablation of the liver: current status. AJR Am J Roentgenol 176:3–16.
- Burdío F, Tobajas P, Quesada-Diez R, et al. (2011). Distant infusion of saline may enlarge coagulation volume during radiofrequency ablation of liver tissue using cool-tip electrodes without impairing predictability. AJR Am J Roentgenol 196:837–43.
- Burdío F, Güemes A, Burdío JM, et al. (2003). Bipolar saline-enhanced electrode for radiofrequency ablation: results of experimental study of in vivo porcine liver. Radiology 229:447–56.
- Lee JM, Han JK, Kim SH, et al. (2003). A comparative experimental study of the in-vitro efficiency of hypertonic saline-enhanced hepatic bipolar and monopolar radiofrequency ablation. Korean J Radiol 4:163–9.
- Goldberg SN, Ahmed M, Gazelle GS, et al. (2001). Radio-frequency thermal ablation with NaCl solution injection: effect of electrical conductivity on tissue heating and coagulation-phantom and porcine liver study. Radiology 219:157–65.
- Lobo SM, Afzal KS, Ahmed M, et al. (2004). Radiofrequency ablation: modeling the enhanced temperature response to adjuvant NaCl pretreatment. Radiology 230:175–82.
- Mulier S, Miao Y, Mulier P, et al. (2005). Electrodes and multiple electrode systems for radiofrequency ablation: a proposal for updated terminology. Eur Radiol 15:798–808.
- Kim JH, Kim PN, Won HJ, Shin YM. (2013). Percutaneous radiofrequency ablation with internally cooled versus internally cooled wet electrodes for small subphrenic hepatocellular carcinomas. J Vasc Interv Radiol 24:351–6.
- Cha J, Choi D, Lee MW, et al. (2009). Radiofrequency ablation zones in ex vivo bovine and in vivo porcine livers: comparison of the use of internally cooled electrodes and internally cooled wet electrodes. Cardiovasc Intervent Radiol 32:1235–40.
- Lee JM, Han JK, Chang JM, et al. (2006). Radiofrequency ablation of the porcine liver in vivo: increased coagulation with an internally cooled perfusion electrode. Acad Radiol 13:343–52.
- Park MH, Cho JS, Shin BS, et al. (2012). Comparison of internally cooled wet electrode and hepatic vascular inflow occlusion method for hepatic radiofrequency ablation. Gut Liver 6:471–5.
- Han JK, Lee JM, Kim SH, et al. (2005). Radiofrequency ablation in the liver using two cooled-wet electrodes in the bipolar mode. Eur Radiol 15:2163–70.
- Romero-Méndez R, Tobajas P, Burdío F, et al. (2012). Electrical-thermal performance of a cooled RF applicator for hepatic ablation with additional distant infusion of hypertonic saline: in vivo study and preliminary computer modeling. Int J Hyperthermia 28:653–62.
- Kim JH, Kim PN, Won HJ, Shin YM. (2012). Percutaneous radiofrequency ablation using internally cooled wet electrodes for the treatment of hepatocellular carcinoma. AJR Am J Roentgenol 198:471–6.
- Kim JW, Kim JH, Shin YM, et al. (2014). Percutaneous radiofrequency ablation with internally cooled wet electrodes versus cluster electrodes for the treatment of single medium-sized hepatocellular carcinoma. Gastrointest Interv 3:98–103.
- Byeongman J, Aksan A. (2010). Prediction of the extent of thermal damage in the cornea during conductive thermokeratoplasty. J Therm Biol 35:167–74.
- Haemmerich D, Chachati L, Wright AS, et al. (2003). Hepatic radiofrequency ablation with internally cooled probes: effect of coolant temperature on lesion size. IEEE Trans Biomed Eng 50:493–500.
- Demazunder D, Mirotznik MS, Schwartzman D. (2001). Biophysics of radiofrequency ablation using an irrigated electrode. J Interv Cardiac Electrophysiol 5:377–89.
- Antunes CL, Almeida TR, Raposeiro N. (2012). Saline-enhanced RF ablation on a cholangiocarcinoma: a numerical simulation. Int J Comput Math Electr Electron Eng 31:1055–66.
- Duck F. (1990). Physical properties of tissue – a comprehensive reference book. New York: Academic Press.
- Pätz T, Kröger T, Preusser T. (2009). Simulation of radiofrequency ablation including water evaporation. IFMBE Proceedings, 25/IV:1287–90.
- Berjano EJ, Burdío F, Navarro AC, et al. (2006). Improved perfusion system for bipolar radiofrequency ablation of liver: preliminary findings from a computer modeling study. Physiol Meas 27:N55–66.
- McGahan JP, Loh S, Boschini FJ, et al. (2010). Maximizing parameters for tissue ablation by using an internally cooled electrode. Radiology 256:397–405.
- Doss JD. (1982). Calculation of electric fields in conductive media. Med Phys 9:566–73.
- Tungjitkusolmun S, Woo EJ, Cao H, et al. (2000). Thermal-electrical finite element modeling for radio frequency cardiac ablation: effects of changes in myocardial properties. Med Biol Eng Comput 38:562–8.
- Hall SK, Ooi EH, Payne SJ. (2015). Cell death, perfusion and electrical parameters are critical in models of hepatic radiofrequency ablation. Int J Hyperthermia 31:538–50.
- Chang IA. (2010). Considerations for thermal injury analysis for RF ablation devices. Open Biomed Eng J 4:3–12.
- Jacques S, Rastegar S, Thomsen S, Motamedi M. (1996). The role of dynamic changes in blood perfusion and optical properties in laser coagulation tissue. IEEE J Sel Top Quantum Electron 2:922–33.
- Trujillo M, Bon J, Rivera MJ, et al. (2016). Computer modeling an impedance-controlled pulsing protocol for RF tumor ablation with a cooled electrode. Int J Hyperthermia 24:1–9.
- Goldberg SN, Stein MC, Gazelle GS, et al. (1999). Percutaneous radiofrequency tissue ablation: optimization of pulsed-radiofrequency technique to increase coagulation necrosis. J Vasc Interv Radiol 10:907–16.
- Trujillo M, Berjano E. (2013). Review of the mathematical functions used to model the temperature dependence of electrical and thermal conductivities of biological tissue in radiofrequency ablation. Int J Hyperthermia 29:590–7.
- Abraham JP, Sparrow EM. (2007). A thermal-ablation bioheat model including liquid-to-vapor phase change, pressure- and necrosis-dependent perfusion, and moisture-dependent properties. Int J Heat Mass Transfer 50:2537–44.
- Yang D, Converse MC, Mahvi DM, Webster JG. (2007). Expanding the bioheat equation to include tissue internal water evaporation during heating. IEEE Trans Biomed Eng 54:1382–8.
- Baxter LT, Jain RK. (1989). Transport of fluid and macromolecules in tumors. I. Role of interstitial pressure and convection. Microvasc Res 37:77–104.
- Burdío F, Berjano E, Millán O, et al. (2012). CT mapping of saline distribution after infusion of saline into the liver in an ex vivo animal model. How much tissue is actually infused in an image-guided procedure? Phys Med 29:188–95.
- Duschenshen N, Maerz T, Rabban P, et al. (2012). The acute effect of bipolar radiofrequency energy thermal chondroplasty on intrinsic biomechanical properties and thickness of chondromalacic human articular cartilage. J Biomech Eng 134:081007-1–7.
- Uthamanthil R, Edwards RB, Lu Y, et al. (2006). In vivo study on the short-term effect of radiofrequency energy on chondromalacic patellar cartilage and its correlation with calcified cartilage pathology in an equine model. J Orthopedic Res 24:716–24.
- Nour SG, Lewin JS, Duerk JL. (2001). Saline injection in ex-vivo liver: monitoring with fast gradient echo sequences At 0.2 T, Glasgow, Scotland. Proceedings of the International Society for Magnetic Resonance in Medicine (ISMRM) 9th Scientific Meeting.
- Shutt DJ, Haemmerich D. (2008). Effects of variation in perfusion rates and of perfusion models in computational models of radio frequency tumor ablation. Med Phys 35:3462–70.
- Myong-Ki Jun KD. (2006). Electrode for radiofrequency tissue ablation. US Patent US 2006/0122593, June 8, 2006.
- Lee JM, Han JK, Kim SH, et al. (2005). Wet radio-frequency ablation using multiple electrodes: comparative study of bipolar versus monopolar modes in the bovine liver. Eur J Radiol 54:408–17.
- Lee JM, Han JK, Lee JY, et al. (2004). Saline-enhanced hepatic radiofrequency ablation using a perfused-cooled electrode: comparison of dual probe bipolar mode with monopolar and single probe bipolar modes. Korean J Radiol 5:121–7.
- Ishikawa T, Kubota T, Horigome R, et al. (2013). Radiofrequency ablation during continuous saline infusion can extend ablation margins. World J Gastroenterol 19:1278–82.