
Abstract
Purpose: This study investigates the feasibility of non-invasively determining thermal diffusivity (α) and the Pennes perfusion parameter (w) from pre-clinical and clinical magnetic resonance-guided focussed ultrasound (MRgFUS) temperature data.
Materials and methods: Pre-clinical MRgFUS experiments were performed in rabbit muscle (N = 3, 28 sonications) using three-dimensional MR thermometry. Eight sonications were made in a clinical QA phantom with two-dimensional thermometry. Retrospective property determination was performed on clinical uterine fibroid (N = 8, 9 sonications) and desmoid tumour (N = 4, 7 sonications) data. The property determination method fits an analytical solution to MRgFUS temperatures in the coronal MR plane, including all temperatures acquired during heating and one cooling image. When possible, additional cooling data were acquired for property determination.
Results: Rabbit α and w from Heating Data (α = 0.164 mm2s−1, w = 7.9 kg m−3 s−1) and Heating and Cooling Data (α = 0.146 mm2s−1, w = 3.3 kg m−3 s−1) were within the range of gold-standard invasive measurements, with >50% reduction in variability by including cooling data. QA phantom property determination with cooling data yielded properties within 3% of expected values (α = 0.144 mm2s−1, w = 0.0 kg m−3 s−1), a difference that was not statistically significant (p = 0.053). Uterine fibroid (Heating Data: α = 0.212 mm2s−1, w = 11.0 kg m−3 s−1) and desmoid tumour (Heating & Cooling Data: α = 0.245 mm2s−1, w = 4.7 kg m−3 s−1) properties are feasible but lack independent verification.
Conclusions: Thermal diffusivity and the Pennes perfusion parameter can be obtained from in vivo data and with clinical MRgFUS protocols. Property values are consistently improved by including cooling data. The utility of this property determination method will increase as clinical protocols implement improved temperature imaging.
Introduction
Thermal models for magnetic resonance-guided focussed ultrasound (MRgFUS) therapies may be used to predict outcomes, improve monitoring and inform real-time controllers that guide treatments [Citation1–3]. When accurate, these models have potential to identify patients that will or will not benefit from MRgFUS and to improve treatment safety, time efficiency and efficacy. However, accurate thermal models require knowledge of patient-specific properties including the tissue thermal diffusivity (α) and the Pennes perfusion parameter (w). These two parameters are the primary factors defining how thermal energy dissipates once deposited in the tissue by focussed ultrasound. Thermal diffusivity characterises how quickly thermal energy spreads spatially away from the focal region. Perfusion draws thermal energy from the focal region by blood flow in a heat sink-like effect. High-thermal diffusivity and high perfusion in the target tissue can make it difficult to generate ablative temperature changes with the end result of longer treatment times and poorer outcomes. The clinical relevance of these properties and the need for better quantification is demonstrated in the literature for several MRgFUS applications as described below.
While the safety and efficacy of MRgFUS treatments for symptomatic uterine fibroids has repeatedly been demonstrated [Citation4], a number of treatment challenges have been observed in relation to elevated fibroid T2-weighted signal intensity on pre-procedure imaging. These include difficulty in heating [Citation5–9], smaller non-perfused volume ratios (NPV) [Citation5–7,Citation10,Citation11], less long-term reduction in fibroid volume [Citation5,Citation7,Citation12] and symptom severity scores [Citation6,Citation12] and increased re-intervention rates for persistent symptoms [Citation6,Citation11,Citation12]. While increased blood perfusion has been cited as a likely explanation [Citation13–15], no study has clearly identified the cause of the increased difficulty in treating these fibroids. Also of note, there is very little data in the literature describing the thermal diffusivity and perfusion of uterine fibroids. One study utilising MRgFUS data from nine patients determined the thermal diffusivity of uterine fibroid tissue to be 0.123 ± 0.018 mm2 s−1, with minimum and maximum measured values of 0.066 to 0.176 mm2 s−1, respectively [Citation16].
MRgFUS is successfully being used in the treatment of extra-abdominal desmoid tumours when the morbidity of surgery is considered unacceptable, when disease continues to progress after other treatment options fail, or when the patient refuses other treatment [Citation17–19]. Results of early studies show reduced tumour volumes and improved pain scores from patients. These studies also reported skin burns in several cases, a complication that has the potential to be predicted or eliminated through effective treatment modelling. However, as with uterine fibroids, the literature contains minimal information regarding the thermal diffusivity and perfusion properties of desmoids.
More generally, even for tissues that are well characterised in the literature, the range of property values can be quite large [Citation20–22], and using mean values alone eliminates the reality of variation between patients and within tissues. Given these observations regarding uterine fibroids, desmoid tumours, and general tissue inhomogeneity, patient- and tissue-specific determination of thermal diffusivity and the Pennes perfusion parameter has great potential for improving thermal modelling of MRgFUS treatments.
Several methods have been developed for using MRgFUS temperature data to non-invasively determine thermal diffusivity [Citation23–28] and the Pennes perfusion parameter [Citation23–26,Citation28–30]. Of these methods, the one presented by Dillon et al. in 2016 [28] is unique in that it simultaneously identifies thermal diffusivity and the Pennes perfusion parameter by fitting an analytical solution to the heating and cooling MR temperature data. The method has previously been evaluated in simulations [Citation28] and ex vivo porcine muscle [Citation31], with a single in vivo demonstration in rabbit back muscle [Citation28]. This study presents an in vivo evaluation of this method using pre-clinical experiments in rabbit muscle and clinical MRgFUS treatments of uterine fibroids and desmoid tumours. Use of the method with clinical protocols was validated in a quality assurance (QA) phantom. The aims of this study are (1) to evaluate whether this method can provide accurate property values in vivo and with a clinical MRgFUS system, (2) to identify property values for uterine fibroids and desmoid tumours to aid in MRgFUS treatment modelling and (3) to identify deficiencies in current clinical protocols that, if altered, could increase the utility and accuracy of this property determination method.
Materials and methods
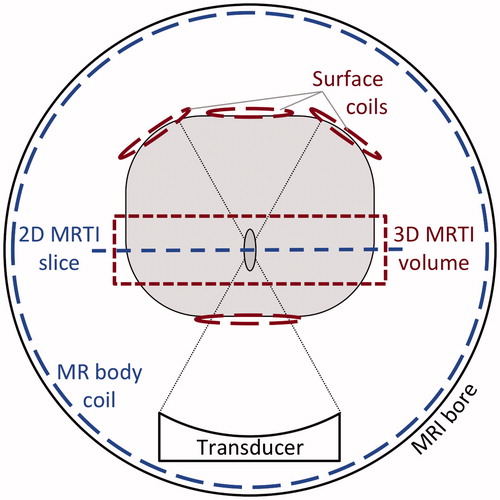
The property determination method utilises MR temperature data acquired in a plane perpendicular to the ultrasound propagation direction, which corresponds to the coronal MR imaging plane for a vertically shooting ultrasound transducer. shows a generic schematic regarding the method’s geometric orientation in MRgFUS and highlights some differences between the preclinical and clinical set-ups. Preclinical in vivo rabbit experiments included three-dimensional (3 D) MR temperature imaging (MRTI) with multiple custom-built radiofrequency (RF) surface coils to provide volumetric coverage of the focal region with spatial and temporal resolution comparable to traditional two-dimensional (2 D) imaging. Pre-clinical temperature data was acquired during both the heating and cooling periods. Clinical MRgFUS protocols at 3 Tesla acquire 2 D MR temperature data using the body coil. A coronal orientation is typically only used in the initial low temperature alignment verification stage of the treatment, because the single coronal slice cannot monitor near- and far-field heating. The clinical system (ExAblate 2100 Type 1.1 UF2 V2 System) used in these studies limited temperature acquisition to the heating period, plus one image during cooling.
Figure 1. Schematic for MRgFUS property determination highlighting distinction between the preclinical (3D MRTI volume, Surface coils) and clinical (2D MRTI slice, MR body coil) setups. MR temperatures are measured in a plane perpendicular to the direction of ultrasound propagation, which is the coronal MR plane for a vertical shooting transducer. The clinical protocol utilises the body coil to monitor temperatures in a single 2 D slice. The pre-clinical setup uses multiple surface coils to enable 3 D temperature imaging with comparable temporal and spatial resolution.
Data acquisition
Pre-clinical in vivo evaluation
MRgFUS experiments were performed on three female New Zealand white rabbits (4–5 kg) with approval of the University of Utah Institutional Animal Care and Use Committee. The rabbits were anaesthetised with intramuscular injections of ketamine (40 mg/kg) and xylazine (5 mg/kg), shaved and depilated at the intended acoustic window, intubated and mechanically ventilated with isoflurane (1–3%) to maintain anaesthesia. After supine positioning on the 256-element phased array LabFUS system (Image Guided Therapy, Pessac, France), sonications were performed at the geometric focus in the back muscle (5 total heating locations, 28 total sonications). A minimum 7-min delay was observed between sonications to enable tissue cooling to steady state.
The focussed ultrasound heating was triggered to coincide with volumetric MR temperature imaging. These experiments used a custom-built single-loop radiofrequency coil positioned under the rabbit and 1–3 two-channel surface coils placed on the rabbit’s abdomen. Proton resonance frequency (PRF) temperatures [Citation32,Citation33] were calculated for 60 s of data (3 – 5 heating + 6 – 8 cooling acquisitions) using a 2 D referenceless technique with fifth-order polynomial [Citation34]. Relevant ultrasound and MR imaging parameters from these experiments are listed in .
Table 1. MRgFUS Ultrasound, imaging and reconstruction parameters for pre-clinical and clinical data.
Immediately following the MRgFUS experiment, the rabbits were euthanised and, in two of the three animals, invasive measurements of thermal diffusivity in the back muscle were made with a commercial thermal property analyser (KD2 Pro, Decagon Devices, Pullman, WA). The property analyser induces a 1–3 °C temperature rise in the tissue over 2 min via a thin-needle that applies uniform power along its 30 mm length. A second needle spaced 6 mm away measures transient temperature changes in the tissue. Fitting the transient temperature data with the analytical temperature solution for an infinite line source with constant power per unit length [Citation35] yields the thermal diffusivity of the tissue. The manufacturer reported accuracy of this device is ±10% for thermal diffusivity between 0.1 and 1.0 mm2 s−1. In total, nine measurements were made at unique locations within the back muscle.
Clinical QA phantom evaluation
To validate the property determination method with clinical protocols, eight sonications (InSightec ExAblate 2100, Haifa, Israel) were performed in multiple locations of a 250-bloom gelatine QA phantom [Citation36] using clinical MRgFUS parameters described in . MR temperature images (GE 3 T Discovery MR750w, Waukesha, WI) were received with the body coil, and temperature data were calculated via a multi-baseline reference reconstruction using the PRF method. For research studies, the clinical MRgFUS software can be adjusted to include additional measurements during the cooling period of each sonication. This was done with the QA phantom to provide 11 acquisitions during cooling for a total heating and cooling time of 60 s. Ten total invasive measurements of thermal diffusivity at six locations of the QA phantom were also made with the commercial thermal property analyser. Measurements were separated by at least seven minutes to ensure thermal equilibrium as an initial condition.
Clinical uterine fibroid treatments
Retrospective analysis was performed on clinical fibroid MRgFUS data from eight patients (9 sonications) with imaging and reconstruction parameters described in . Each data set was acquired during the relatively low power sonications used for focal spot localisation, since coronal MR temperature imaging is generally only performed at this stage of the treatment. The default temperature acquisition scheme used for uterine fibroid treatments acquires a single baseline image, six images during 20 s of heating and one additional image at the beginning of cooling. All patients provided informed consent as approved by the Stanford University Institutional Review Board.
Clinical desmoid treatments
Clinical MRgFUS data from four desmoid tumour treatments (7 sonications) were also analysed, again from low power localisation sonications (). In order to acquire additional data during the cooling period, the MR temperature imaging sequence was repeated immediately after completion of the treatment acquisition. The delay for this manual rescan was quantified to within a few milliseconds from the time stamps generated during the creation of DICOM files. This approach led to 9–12 measurements during the cooling period (∼40 s of data) to be included in property determination. All patients provided informed consent as approved by the UCSF Committee on Human Research.
Property determination procedure
The method proposed by Dillon et al. [Citation28] for determining tissue thermal diffusivity α and the Pennes perfusion parameter w utilises an integral temperature solution for a Gaussian heating pattern with no axial conduction assuming constant, uniform tissue properties [Citation37]. By replacing the solution’s exponential perfusion term with its third-order Taylor series approximation (other studies have assumed perfusion is zero [Citation27,Citation37,Citation38]), the integral can be evaluated to provide a closed-form analytical solution during FUS heating [Citation28]. The corresponding cooling solution is determined via the principle of superposition.
When applying the method, the user must first identify the focal plane and the location of the ultrasound beam axis in that plane (in this study, identified as the central position of two-dimensional Gaussian fits to the experimental MR heating data). The radial position of each voxel is referenced from this beam axis location. The user also defines data inclusion criteria (fitting radius and temporal fitting period described in the next section) that specify which experimental data in space and time to utilise for property determination. A least-squares optimisation (MATLAB function fminsearchbnd) of four parameters in the analytical solution (α: thermal diffusivity, β: Gaussian beam variance, IHR: Initial heating rate and w: Pennes perfusion parameter) to match the specified MR temperature data yields values for α and w. Additional details of the fitting procedure can be found in [Citation28].
Data inclusion criteria
For this study, thermal diffusivity and the Pennes perfusion parameter were determined from MRgFUS temperature data within 6 mm of the ultrasound beam axis (this fitting radius was based on the beam profiles for the LabFUS and ExAblate 2100 systems [Citation31]) and included all temperature images during heating and a single temperature image acquired during cooling, that is the default acquisition scheme used by the clinical MRgFUS system. These property values are labelled as “Heating Data”. When cooling MR temperature data were acquired, properties were also determined using all temperature data within 60 s of the onset of ultrasound heating (∼20 s heating, ∼40 s cooling), labelled “Heating & Cooling Data”.
Quality of temperature data assessment
Temperature measurement noise was quantified for each sonication by computing the standard deviation of temperatures over time in each voxel and then averaging those standard deviation values in a 1 × 1 cm2 region of interest that experienced no MRgFUS heating.
Movement in the tissue from peristalsis or breathing was assessed by following changes in the position of the centre of thermal mass. The centre of thermal mass was defined to include all n voxels within a 6-mm radius of the beam axis as
(1)
where Ttotal is the sum of all temperatures, and Ti and ri are the temperature and coordinates, respectively, of the i-th voxel within the region of interest.
Results
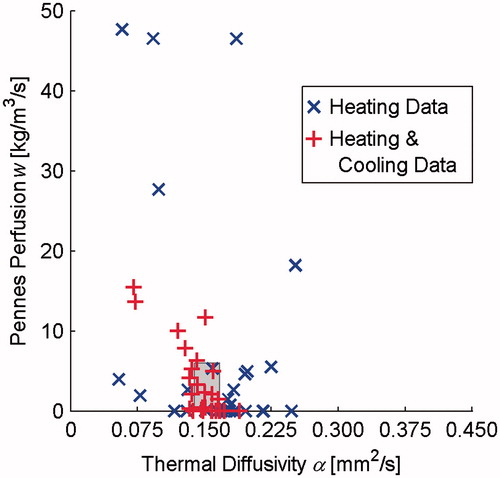
Pre-clinical values of thermal diffusivity and Pennes perfusion in in vivo rabbit back muscle are presented in . Blue × markers indicate Heating Data-determined property values and red + markers represent Heating and Cooling Data-determined properties. The grey-shaded region identifies the range of invasive thermal diffusivity measurements made in the back muscle and a perfusion range that includes the potential for hyperthermia-induced vasodilation [Citation39–42,Citation22].
Figure 2. Thermal diffusivity and Pennes perfusion values determined from in vivo preclinical rabbit muscle MRgFUS temperatures. Properties were determined from heating data (× markers) and from 60 s of heating and cooling data (+ markers). The grey-shaded region represents expected values defined with a horizontal range of invasive thermal diffusivity measurements made in the muscle tissues as well as a vertical range based on the literature that includes the potential for increased perfusion due to hyperthermia-induced vasodilation.
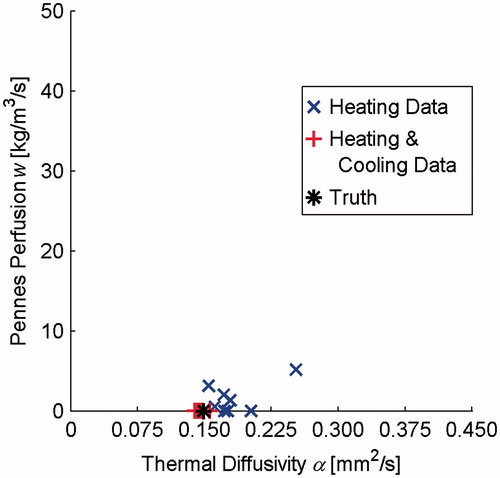
shows thermal diffusivity and Pennes perfusion in a gelatine QA phantom utilising clinical MRgFUS protocols. While using heating data alone (× markers) tends to overpredict thermal diffusivity and Pennes perfusion, property values determined from both heating and cooling data (+ markers) cluster closely around the true value (* marker). Using Welch’s t-test [Citation43], the 3% difference in the mean thermal diffusivity between the Heating and Cooling Data and Truth measurements is not statistically significant (p = 0.053), while the 23% difference between Heating Data and Truth is significant (p = 0.027).
Figure 3. Thermal diffusivity and Pennes perfusion values in a gelatine QA phantom using clinical MRgFUS protocols. Properties were determined from heating data (× markers) and from 60 s of heating and cooling data (+ markers). The * marker identifies the true property values of the phantom.
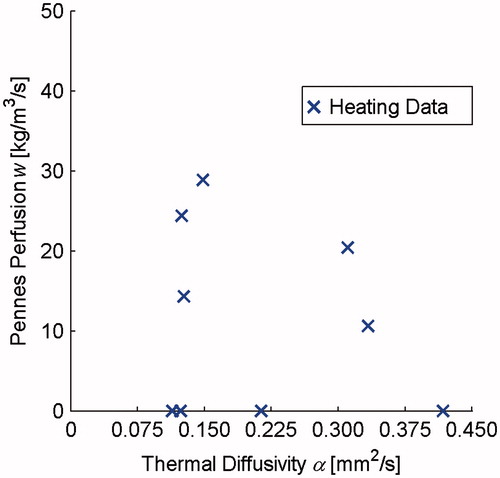
The results of retrospective property determination using clinical uterine fibroid MRgFUS heating data are shown in . Because the clinical imaging protocol restricts temperature acquisition to the heating period and a single image during cooling, only those data are available for property determination (× markers). Additionally, because the true property values are unknown, there is no shaded region/marker to indicate the accuracy of these properties.
Figure 4. Thermal diffusivity and Pennes perfusion determined in retrospective analysis of clinical MRgFUS uterine fibroid treatments. These only included heating data (× markers) since the clinical temperature acquisition scheme does not allow for additional measurements during cooling.
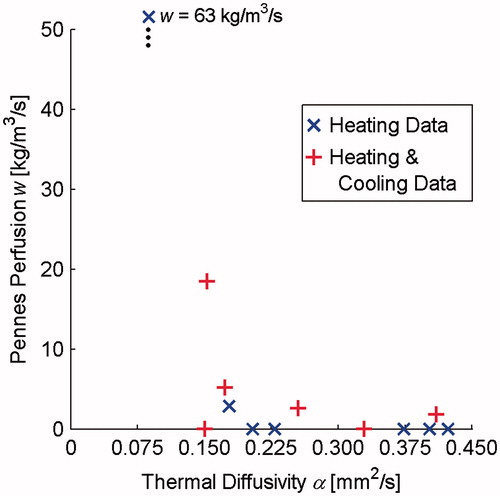
includes property values determined from desmoid tumour MRgFUS treatments. Results from the standard clinical protocol utilising heating data are seen with × markers. By manually rescanning the temperature sequence immediately following the sonication, additional cooling data can also be used for property determination (+ markers).
Figure 5. Thermal diffusivity and Pennes perfusion values from clinical MRgFUS desmoid tumour treatments. Properties were determined from heating data (N = 7, × markers) and from 60 s of heating and cooling data (N = 6, + markers). The heating and cooling results includes one data set less, because for that dataset, large patient motion early in the cooling period confounded subsequent temperature measurements.
A summary of all tissue property values in is provided in , which are presented as the mean value ± one standard deviation. This includes those properties that were measured independently and those available in the literature. Also included in are the maximum temperature changes observed during sonications and the temperature noise for each of the different target tissues (mean ± standard deviation, with the range of values in parentheses).
Table 2. Summary of temperature quality and tissue property determination results.
show temperatures from MR data (× markers) and the analytical solution (coloured lines) in representative cases for the rabbit back muscle (a–c) and the QA phantom (d–f). The left column (a & d) shows temperature versus time curves at the location of maximum heating and includes the property values determined from these data. The middle column (b & e) includes temperature profiles through the focal region at three times during the heating period, and the right column (c & f) displays three temperature profiles during cooling. The times shown on the figure for rabbit and phantom data do not match exactly because the acquisition time for MR measurements varied between these cases.
Figure 6. MR temperature profiles (× markers) and analytical fits (solid lines) used for property determination in rabbit muscle (a–c) and gelatine QA phantom (d–f). The left column (a & d) shows temperature versus time curves at the location of maximum heating as well as providing the property values obtained from these data. The centre column (b & e) shows spatial temperature profiles through the focal region at three times during heating and the right column (c & f) includes three times during cooling.
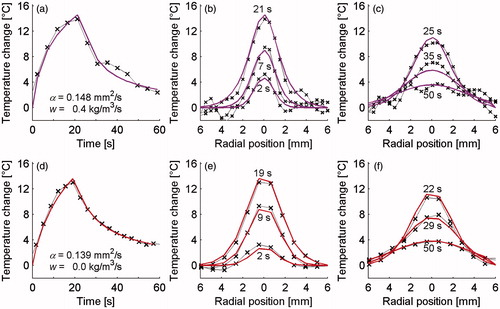
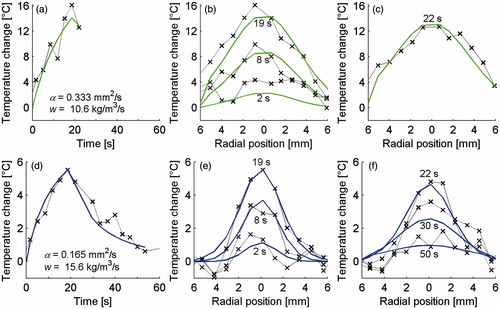
Data presented in are analogous to those in but comes from uterine fibroid (a–c) and desmoid tumour (d–f) sonications. only includes one time frame because no other cooling images were acquired.
Figure 7. MR temperature profiles (× markers) and analytical fits (solid lines) for property determination utilising uterine fibroid (a–c) and desmoid tumour (d–f) MRgFUS data. The left column (a & d) shows temperature versus time curves at the location of maximum heating as well as providing the property values obtained from these data. The centre column (b & e) shows spatial temperature profiles through the focal region at three times during heating and the right column (c & f) includes times during cooling. c includes only one profile since no additional temperature measurements were made in the cooling period of fibroid treatments.
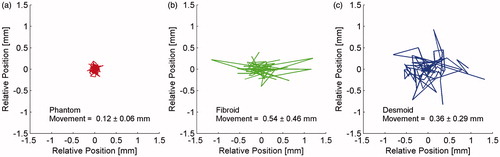
shows the position of the centre of thermal mass relative to the ultrasound axis of beam propagation for all temperature images utilised in property determination for QA phantom (a), uterine fibroid (b), and desmoid tumour (c) sonications. All of those temperature data were acquired with nearly identical clinical imaging protocols (). Each line segment indicates movement between consecutive temperature images and the mean ± standard deviation of those position changes is listed on the figure.
Figure 8. Relative position of the centre of thermal mass during all QA phantom (a), uterine fibroid (b) and desmoid tumour (c) temperature measurements used for determining tissue properties. The movement (mean ± standard deviation) of the centre of thermal mass between consecutive temperature images is also listed on the plot.
Discussion
Accuracy of property determination method
Analysis of preclinical rabbit muscle MRgFUS sonications demonstrates that this method can provide accurate in vivo property values. Mean thermal diffusivity from both Heating Data (0.164 mm2 s−1) and Heating and Cooling Data (0.146 mm2 s−1) were within the range of invasive measurements made in the same tissue. While there were no independent measures of perfusion in this study, based on perfusion values for resting human muscle (0.6 kg m−3 s−1) [Citation22] and potential increases from hyperthermia-induced vasodilation [Citation39–42], mean values for Heating Data (7.9 kg m−3 s−1) and Heating and Cooling Data (3.3 kg m−3 s−1) are conceivable. Undoubtedly, some of the outlying individual property values obtained are unrealistic (human kidney perfusion is only 63 kg m−3 s−1 [Citation22]), but a majority of property values determined from MRgFUS data fall within or near the expected properties identified by the grey-shaded region in . By including both heating and cooling data, the number of outliers is reduced and results cluster more closely around the true tissue properties as demonstrated by the nearly 50% and 70% reduction in standard deviation for thermal diffusivity and perfusion values, respectively.
While those in vivo preclinical data made use of volumetric temperature measurements, custom RF coils, and freedom to adjust all imaging parameters, results from the gelatine QA phantom suggest that the property determination method can also provide reliable values with less flexible clinical MRgFUS protocols. The distinction between properties determined with Heating Data and Heating and Cooling Data is more pronounced with the clinical imaging protocol than was seen in the preclinical results. Using invasive measurements as truth, error in mean thermal diffusivity was reduced from 23% for the Heating Data to 3% for Heating and Cooling Data, with an accompanying reduction in the standard deviation of property values of 80%. Heating and Cooling Data consistently and correctly identified no perfusion, while Heating Data produced a mean value of 1.5 kg m−3 s−1, which in reality would have negligible impact on temperature predictions [Citation31]. Nevertheless, these results demonstrate the positive impact of including cooling data in improving the accuracy and precision of this property determination method. While not shown, analysis of the rabbit and QA phantom cooling data alone provided thermal diffusivity and perfusion values that were less accurate and precise than the combined Heating and Cooling Data, suggesting that temperatures acquired during heating and cooling both contribute useful information to the property determination method.
Uterine fibroid and desmoid tumour properties
Because the tissue is not resected in clinical MRgFUS treatments, it is difficult to independently confirm the accuracy of property values in uterine fibroid and desmoid tumour tissues. In the literature, the only study investigating uterine fibroid thermal properties found a mean thermal diffusivity of 0.123 mm2s−1 with measurements ranging from 0.066 to 0.176 mm2s−1 [Citation16]; perfusion was not quantified. In addition, that study utilised ablative MRgFUS data exceeding 60–80 °C that may have led to irreversible property changes [Citation44,Citation45], complicating direct comparisons with this study. While a different study showed that semiquantitative perfusion MR parameters correlate with fibroid T2-weighted signal intensity [Citation46], this study was unable to find any relation between T2-weighted signal intensity and Pennes perfusion values. Additionally, no relation was found between fibroid post-treatment NPV, which might have been indicative of perfusion levels, and Pennes perfusion values determined in this study. Fibroids are derived from the soft muscle of the uterus; one thermal property database provides uterine thermal diffusivity values ranging from 0.120 to 0.140 mm2 s−1 and Pennes perfusion from 2 to 18 kg m−3 s−1 [Citation22]. The uterine fibroid properties determined in this study have a larger range of values than those cited above in terms of thermal diffusivity (0.114–0.417 mm2 s−1) and Pennes perfusion (0–29 kg m−3 s−1). However, due to the lack of invasive measurements and the scarcity of data in the literature, it is unknown whether the larger spread in these data is a result of real property variability in fibroids or merely the result of poor property determination.
No data were discovered in the literature concerning desmoid tumour thermal properties. These tumours, however, arise from connective tissue that (again citing a database with a limited number of studies) has thermal diffusivity values ranging from 0.100 to 0.326 mm2 s−1 and a single value of connective tissue perfusion at 0.6 kg m−3 s−1 [Citation22]. The desmoid properties found in this study (thermal diffusivity: 0.087–0.423 mm2 s−1; Pennes perfusion: 0–63 kg m−3 s−1) had a larger range than the connective tissue values above. Including cooling data altered property values, however, this did not cause the data to cluster as in rabbit muscle and phantom experiments. As with fibroids, it is difficult to determine whether the observed property spread represents real differences in the tissue or poor property determination.
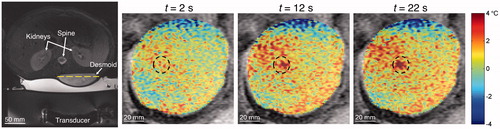
A closer look at MR temperatures and the analytical fits to those data may provide insight. For example, examining data from the outlying desmoid data point with α = 0.087 mm2 s−1 and w = 63 kg m−3 s−1 revealed non-uniform dynamic shifts in the background unheated tissue temperatures of up to 2 °C as shown in . The referenceless reconstruction technique used in this study (for the rabbit data) was unable to correct for these artefacts. The artefacts, which were likely caused by respiratory-induced susceptibility changes, caused poor overall fits to the spatial and temporal temperature data and may explain the unrealistic property values. Adding the cooling data in property determination yielded somewhat more feasible values (α = 0.409 mm2 s−1, w = 2 kg m−3 s−1). These results highlight the need for high quality, robust MR temperature data in property determination.
Figure 9. Example of drift in background MR temperatures that may have confounded property determination. The axial T2-weighted fat-saturated image at left identifies the homogeneous desmoid tumour in the lower back. The dashed line indicates the position of coronal magnitude images at three times (t = 2, 12, 22 s) with the temperatures overlaid on the desmoid tumour. Temperature thresholds at ±4 °C have been applied to emphasise changes in background tissue temperatures. Though tissue outside the sonication region (dashed circle) should be unaffected, measurements in some locations drift to cooler and warmer temperatures. These drift patterns continued even after the ultrasound was turned off (not shown).
Recommendations for improved clinical property determination
The study’s final objective was to identify adjustments to current clinical protocols that could increase the utility and accuracy of this property determination method.
First, the study demonstrates that increasing the number of temperature images acquired as the tissue cools yields more accurate and precise property values. The current protocol acquires one or two images during the cooling period and cannot be further increased due to restrictions in the MRgFUS software. The manual rescan of the temperature sequence performed for desmoid tumour treatments, in this study, is a simple approach to overcoming this limitation but would be more robust if the clinical software allowed a greater number of temperature images during the cooling period. This would also benefit the accuracy of thermal dose calculations during high-temperature ablations since significant dose may accrue during cooling [Citation47] and would not impact overall treatment time because cooling periods are already required between successive sonications to mitigate near field heating.
Determining properties from clinical MRgFUS data would also benefit from implementation of volumetric MRTI and custom RF coils like those utilised in preclinical rabbit experiments. The average temperature noise in the preclinical experiments was less than in fibroid treatments and comparable to desmoid treatments but had much less variability. This manifests itself in the quality of the MR temperatures as demonstrated by the representative datasets of and . Volumetric MRTI also eliminates uncertainty about properties being determined from data in the very centre of the focal region, with additional clinical benefits of real-time monitoring of the entire focal region, as well as near and far fields, in three dimensions. Such monitoring would yield improved focal spot localisation, more accurate volumetric dose assessment, and increased safety monitoring. In addition, more sonications could be monitored in a coronal orientation to provide a greater number of datasets for property determination.
A final area of investigation with potential to improve MRgFUS property determination is peristalsis- or respiratory-induced motion correction. In a truly stationary tissue, which is assumed by the analytical solution, the centre of thermal mass should not move at all. Movement of the centre of thermal mass in the QA phantom () can be attributed to noise or chemical shift distortion [Citation48] in the temperature data. However, the position of the bulk temperatures in vivo () has a greater tendency to shift than in ex vivo phantom measurements. Interestingly, the desmoid dataset with noise (0.4 °C) and centre of thermal mass movement (0.1 mm) comparable to that of the QA phantom was located on the thigh muscle where peristalsis and respiratory motion would be negligible, while other desmoids were in the back or shoulder. Though the magnitude of motion in fibroids and desmoids may not warrant tracking and real-time MRgFUS adjustments seen in other organs [Citation49–53], it is likely the property determination method of this study would benefit from motion-corrected MRTI [Citation54–57].
Study limitations
A primary limitation of this study is the absence of truth measurements against which to compare properties determined from the clinical MRgFUS data. Without such measurements and considering the dearth of thermal property data for uterine fibroids and desmoid tumours in the literature, it is impossible to know if the tissue properties found in this study are accurate. Because invasive measurement of these properties is not practicable, future work could consider other non-invasive property determination methods against which to compare results [Citation23–25,Citation29,Citation58]. The limited number of clinical sonications evaluated in this study also makes it difficult to comment on property consistency. Nevertheless, this feasibility study has demonstrated that in vivo property determination using clinical MRgFUS data is possible and lays the foundation for more extensive tissue property assessment.
Other limitations include the method’s assumptions of uniform and constant tissue properties. Some degree of heterogeneity exists in all tissues and may affect the property determination results. Property mapping techniques may be appropriate [Citation24,Citation25,Citation30]. More significant may be the assumption of constant tissue properties during the heating and cooling periods analysed from each sonication. It is widely recognised that tissue attenuation, perfusion and thermal diffusivity are temperature/dose dependent properties [Citation41,Citation44,Citation59–65]. Assuming constant properties in clinical data where the temperature rise was as large as 30 °C is likely to introduce errors when determining thermal properties. In fact, the two uterine fibroid datasets that most closely matched α values in the literature [Citation16] were those with the lowest temperature rise (9 and 11 °C). The fibroid data also showed a trend of increased thermal diffusivity with increased maximum temperature change. Therefore, future work could evaluate only sonications with low temperature increases where property changes should be minimal or adjust the analytical temperature solution to account for the possibility of dynamic tissue property changes. While the method as currently implemented does not account for the temperature/dose dependence of properties encountered during ablative therapies, if applied appropriately it should provide accurate baseline values to serve as a starting point for dynamic tissue property models utilised in treatment planning [Citation63–65].
Conclusions
We have demonstrated that obtaining thermal diffusivity and the Pennes perfusion parameter from in vivo data and with clinical MRgFUS protocols is possible. Property values were consistently improved when cooling data were included in the optimisation process. Though the accuracy of uterine fibroid and desmoid tumour properties cannot be independently confirmed, thermal diffusivity and perfusion values determined in this study match reasonably with the limited data available in the literature. The utility of this property determination method will increase as clinical protocols move toward acquiring more data during the cooling period, implementing volumetric MRTI with custom RF coils and employing motion correction techniques for robust temperature measurements. As the quality of MR temperature monitoring progresses, there exists great potential for non-invasive determination of tissue thermal parameters that can inform modelling efforts and improve MRgFUS treatment safety, efficacy and efficiency.
Acknowledgements
The authors would like to acknowledge Dr. Lexi Farrer for fabricating the gelatine QA phantom and Dr. Eugene Ozhinsky for assistance in acquiring cooling data and determining the corresponding time vector for desmoid tumour treatments.
Disclosure statement
This work was funded by NIH Grant F32 HD085685, a University of Utah Vice President for Research seed grant, and research support from InSightec and GE Healthcare. No potential conflict of interest was reported by the authors.
Additional information
Funding
References
- Schwenke M, Strehlow J, Haase S, et al. (2015). An integrated model-based software for FUS in moving abdominal organs. Int J Hyperthermia 31:240–50.
- Odéen H, Todd N, Dillon C, et al. (2016). Model predictive filtering MR thermometry: effects of model inaccuracies, k-space reduction factor, and temperature increase rate. Magn Reson Med 75:207–16.
- de Bever J, Todd N, Payne A, et al. (2014). Adaptive model-predictive controller for magnetic resonance guided focused ultrasound therapy. Int J Hyperthermia 30:456–70.
- Gizzo S, Saccardi C, Patrelli TS, et al. (2014). Magnetic resonance-guided focused ultrasound myomectomy: safety, efficacy, subsequent fertility and quality-of-life improvements, a systematic review. Reprod Sci 21:465–76.
- Lénárd ZM, McDannold NJ, Fennessy FM, et al. (2008). Uterine leiomyomas: MR imaging-guided focused ultrasound surgery-imaging predictors of success. Radiology 249:187–94.
- Funaki K, Sawada K, Maeda F, Nagai S. (2007). Subjective effect of magnetic resonance-guided focused ultrasound surgery for uterine fibroids. J Obstet Gynaecol Res 33:834–9.
- Funaki K, Fukunishi H, Funaki T, et al. (2007). Magnetic resonance-guided focused ultrasound surgery for uterine fibroids: relationship between the therapeutic effects and signal intensity of preexisting T2-weighted magnetic resonance images. Am J Obstet Gynecol 196:184.e1–6.
- Gorny KR, Woodrum DA, Brown DL, et al. (2011). Magnetic resonance-guided focused ultrasound of uterine leiomyomas: review of a 12-month outcome of 130 clinical patients. J Vasc Interv Radiol JVIR 22:857–64.
- Kim Y, Keserci B, Partanen A, et al. (2012). Volumetric MR-HIFU ablation of uterine fibroids: role of treatment cell size in the improvement of energy efficiency. Eur J Radiol 81:3652–9.
- LeBlang SD, Hoctor K, Steinberg FL. (2010). Leiomyoma shrinkage after MRI-guided focused ultrasound treatment: report of 80 patients. AJR Am J Roentgenol 194:274–80.
- Machtinger R, Inbar Y, Cohen-Eylon S, et al. (2012). MR-guided focus ultrasound (MRgFUS) for symptomatic uterine fibroids: predictors of treatment success. Hum Reprod Oxf Engl 27:3425–31.
- Funaki K, Fukunishi H, Sawada K. (2009). Clinical outcomes of magnetic resonance-guided focused ultrasound surgery for uterine myomas: 24-month follow-up. Ultrasound Obstet Gynecol off J Int Soc Ultrasound Obstet Gynecol 34:584–9.
- McDannold N, Tempany CM, Fennessy FM, et al. (2006). Uterine leiomyomas: MR imaging-based thermometry and thermal dosimetry during focused ultrasound thermal ablation. Radiology 240:263–72.
- Pilatou MC, Stewart EA, Maier SE, et al. (2009). MRI-based thermal dosimetry and diffusion-weighted imaging of MRI-guided focused ultrasound thermal ablation of uterine fibroids. J Magn Reson Imaging 29:404–11.
- Yoon S-W, Lee C, Kim KA, Kim SH. (2010). Contrast-enhanced dynamic MR imaging of uterine fibroids as a potential predictor of patient eligibility for MR guided focused ultrasound (MRgFUS) treatment for symptomatic uterine fibroids. Obstet Gynecol Int 2010:834275.
- Zhang J, Fischer J, Warner L, et al. (2015). Noninvasive, in vivo determination of uterine fibroid thermal conductivity in MRI-guided high intensity focused ultrasound therapy. J Magn Reson Imaging 41:1654–61.
- Avedian RS, Bitton R, Gold G, et al. (2016). Is MR-guided high-intensity focused ultrasound a feasible treatment modality for desmoid tumors? Clin Orthop Relat Res 474:697–704.
- Ghanouni P, Dobrotwir A, Bazzocchi A, et al. (2017). Magnetic resonance-guided focused ultrasound treatment of extra-abdominal desmoid tumors: a retrospective multicenter study. Eur Radiol 27:732–40.
- Bucknor MD, Rieke V. (2017). MRgFUS for desmoid tumors within the thigh: early clinical experiences. J Ther Ultrasound 5:4
- Mcintosh RL, Anderson V. (2010). A comprehensive tissue properties database provided for the thermal assessment of a human at rest. Biophys Rev Lett 05:129–51.
- Duck FA. (2012) Physical properties of tissue: a comprehensive reference book. York (UK): Institute of Physics and Engineering in Medicine.
- Hasgall PA, Di Gennaro F, Baumgartner C, et al. 2015. IT’IS Database for thermal and electromagnetic parameters of biological tissues [Internet]. Available from: www.itis.ethz.ch/database
- Cheng H-LM, Plewes DB. (2002). Tissue thermal conductivity by magnetic resonance thermometry and focused ultrasound heating. J Magn Reson Imaging 16:598–609.
- Huttunen JMJ, Huttunen T, Malinen M, Kaipio JP. (2006). Determination of heterogeneous thermal parameters using ultrasound induced heating and MR thermal mapping. Phys Med Biol 51:1011–32.
- Alon L, Collins C, Carluccio G, et al. (2013). Tissue thermal property tomography. In: Proc 21st Ann Mtg ISMRM. 2519.
- Appanaboyina S, Partanen A, Haemmerich D. (2013). Non-invasive estimation of thermal tissue properties by high-intensity focused ultrasound. In: Proc SPIE. 85840W.
- Dillon CR, Payne A, Christensen DA, Roemer RB. (2014). The accuracy and precision of two non-invasive, magnetic resonance-guided focused ultrasound-based thermal diffusivity estimation methods. Int J Hyperthermia 30:362–71.
- Dillon CR, Borasi G, Payne A. (2016). Analytical estimation of ultrasound properties, thermal diffusivity, and perfusion using magnetic resonance-guided focused ultrasound temperature data. Phys Med Biol 61:923–36.
- Dragonu I, de Oliveira PL, Laurent C, et al. (2009). Non-invasive determination of tissue thermal parameters from high intensity focused ultrasound treatment monitored by volumetric MRI thermometry. NMR Biomed 22:843–51.
- Dillon C, Roemer R, Payne A. (2015). Magnetic resonance temperature imaging-based quantification of blood flow-related energy losses. NMR Biomed 28:841–51.
- Shi YC, Parker DL, Dillon CR. (2016). Sensitivity of tissue properties derived from MRgFUS temperature data to input errors and data inclusion criteria: ex vivo study in porcine muscle. Phys Med Biol 61:N373–85.
- De Poorter J, De Wagter C, De Deene Y, et al. (1995). Noninvasive MRI thermometry with the proton resonance frequency (PRF) method: in vivo results in human muscle. Magn Reson Med 33:74–81.
- Ishihara Y, Calderon A, Watanabe H, et al. (1995). A precise and fast temperature mapping using water proton chemical shift. Magn Reson Med 34:814–23.
- Rieke V, Vigen KK, Sommer G, et al. (2004). Referenceless PRF shift thermometry. Magn Reson Med 51:1223–31.
- Carslaw HS, Jaeger JC. (1986). Conduction of heat in solids. 2nd ed. Oxford [Oxfordshire]: New York: Clarendon Press; Oxford University Press; 510.
- Farrer AI, Odéen H, de Bever J, et al. (2015). Characterization and evaluation of tissue-mimicking gelatin phantoms for use with MRgFUS. J Ther Ultrasound 3:9.
- Cline HE, Hynynen K, Hardy CJ, et al. (1994). MR temperature mapping of focused ultrasound surgery. Magn Reson Med 31:628–36.
- Dillon CR, Vyas U, Payne A, et al. (2012). An analytical solution for improved HIFU SAR estimation. Phys Med Biol 57:4527–44.
- Sekins KM, Emery AF, Lehmann JF, MacDougall JA. (1982). Determination of perfusion field during local hyperthermia with the aid of finite element thermal models. J Biomech Eng 104:272–9.
- Sekins KM, Lehmann JF, Esselman P, et al. (1984). Local muscle blood flow and temperature responses to 915MHz diathermy as simultaneously measured and numerically predicted. Arch Phys Med Rehabil 65:1–7.
- Lang J, Erdmann B, Seebass M. (1999). Impact of nonlinear heat transfer on temperature control in regional hyperthermia. IEEE Trans Biomed Eng 46:1129–38.
- Laakso I, Hirata A. (2011). Dominant factors affecting temperature rise in simulations of human thermoregulation during RF exposure. Phys Med Biol 56:7449–71.
- Zar JH. (1999) Biostatistical analysis. 4th ed. Upper Saddle River (N.J): Prentice Hall. 929.
- Choi J, Morrissey M, Bischof JC. (2013). Thermal processing of biological tissue at high temperatures: impact of protein denaturation and water loss on the thermal properties of human and porcine liver in the range 25–80 °C. J Heat Transf 135:061302.
- Guntur SR, Lee KI, Paeng DG, et al. (2013). Temperature-dependent thermal properties of ex vivo liver undergoing thermal ablation. Ultrasound Med Biol 39:1771–84.
- Kim YS, Lee JW, Choi CH, et al. (2016). Uterine fibroids: correlation of T2 signal intensity with semiquantitative perfusion MR parameters in patients screened for MR-guided high-intensity focused ultrasound ablation. Radiology 278:925–35.
- Bitton RR, Webb TD, Pauly KB, Ghanouni P. (2016). Improving thermal dose accuracy in magnetic resonance-guided focused ultrasound surgery: long-term thermometry using a prior baseline as a reference: improving thermal dose accuracy in MRgFUS. J Magn Reson Imaging 43:181–9.
- Gaur P, Partanen A, Werner B, et al. (2016). Correcting heat-induced chemical shift distortions in proton resonance frequency-shift thermometry: CS-compensated PRF temperature reconstruction. Magn Reson Med 76:172–82.
- Pernot M, Tanter M, Fink M. (2004). 3-D real-time motion correction in high-intensity focused ultrasound therapy. Ultrasound Med Biol 30:1239–49.
- Tanter M, Pernot M, Aubry JF, et al. (2007). Compensating for bone interfaces and respiratory motion in high-intensity focused ultrasound. Int J Hyperthermia 23:141–51.
- de Senneville BD, Mougenot C, Moonen CTW. (2007). Real-time adaptive methods for treatment of mobile organs by MRI-controlled high-intensity focused ultrasound. Magn Reson Med 57:319–30.
- Ries M, de Senneville BD, Roujol S, et al. (2010). Real-time 3D target tracking in MRI guided focused ultrasound ablations in moving tissues. Magn Reson Med 64:1704–12.
- Quesson B, Laurent C, Maclair G, et al. (2011). Real-time volumetric MRI thermometry of focused ultrasound ablation in vivo: a feasibility study in pig liver and kidney. NMR Biomed 24:145–53.
- Vigen KK, Daniel BL, Pauly JM, Butts K. (2003). Triggered, navigated, multi-baseline method for proton resonance frequency temperature mapping with respiratory motion. Magn Reson Med 50:1003–10.
- Shmatukha AV, Bakker CJG. (2006). Correction of proton resonance frequency shift temperature maps for magnetic field disturbances caused by breathing. Phys Med Biol 51:4689–705.
- Schmitt A, Mougenot C, Chopra R. (2014). Spatiotemporal filtering of MR-temperature artifacts arising from bowel motion during transurethral MR-HIFU. Med Phys 41:113302.
- Svedin BT, Payne A, Parker DL. (2016). Respiration artifact correction in three-dimensional proton resonance frequency MR thermometry using phase navigators. Magn Reson Med 76:206–13.
- Petersen ET, Zimine I, Ho YCL, Golay X. (2006). Non-invasive measurement of perfusion: a critical review of arterial spin labelling techniques. Br J Radiol 79:688–701.
- Valvano JW, Cochran JR, Diller KR. (1985). Thermal conductivity and diffusivity of biomaterials measured with self-heated thermistors. Int J Thermophys 6:301–11.
- Damianou CA, Sanghvi NT, Fry FJ, Maass-Moreno R. (1997). Dependence of ultrasonic attenuation and absorption in dog soft tissues on temperature and thermal dose. J Acoust Soc Am 102:628–34.
- Clarke R, Bush N, Ter Haar G. (2003). The changes in acoustic attenuation due to in vitro heating. Ultrasound Med Biol 29:127–35.
- Bhattacharya A, Mahajan RL. (2003). Temperature dependence of thermal conductivity of biological tissues. Physiol Meas 24:769–83.
- Schutt DJ, Haemmerich D. (2008). Effects of variation in perfusion rates and of perfusion models in computational models of radio frequency tumor ablation. Med Phys 35:3462.
- Prakash P, Diederich CJ. (2012). Considerations for theoretical modelling of thermal ablation with catheter-based ultrasonic sources: implications for treatment planning, monitoring and control. Int J Hyperthermia 28:69–86.
- Huang CW, Sun MK, Chen BT, et al. (2015). Simulation of thermal ablation by high-intensity focused ultrasound with temperature-dependent properties. Ultrason Sonochem 27:456–65.