
Abstract
Aim: The goal of the study was to compare the kinetic responses of heart rate (HR) and pulmonary (V̇O2pulm) and muscular (V̇O2musc) oxygen uptake during dynamic leg exercise across different acute ambient temperature conditions in a climatic chamber.
Methods: Thirteen physically healthy, active, male volunteers demonstrated pseudorandom binary sequence (PRBS) work rate (WR) changes between 30 and 80 W at 15 °C, 25 °C and 35 °C, respectively. HR was measured beat-to-beat using an echocardiogram and V̇O2pulm by breath-by-breath gas exchange; V̇O2musc estimations were assessed by applying a circulatory model and cross-correlation functions.
Results: No significant differences were observed across the various temperature conditions in each case for HR, V̇O2pulm or V̇O2musc kinetics (p > 0.05). Baroreflex regulation based on HR kinetics does not seem to be influenced between ambient temperatures of 15 °C and 35 °C during dynamic exercise.
Conclusions: The results imply that ambient temperatures of 15 °C, 25 °C and 35 °C have no effect on HR, V̇O2pulm or V̇O2musc kinetics during dynamic moderate exercise. The applied approach may be of interest for assessments of the cardio-pulmonary and respiratory health statuses of individuals working or performing sports in extreme temperature environments. Furthermore, differentiation between systemic (e.g. cardio-dynamic: HR) and specific (e.g. exercising tissues: V̇O2musc) determinants of the relevant physiological systems may improve the evaluation of an individual’s health status.
Introduction
At different ambient temperature conditions (e.g. warm or hot environments), the rapid delivery and extraction of oxygen (O2) to and within the exercising skeletal musculature are essential for endurance sports (e.g. skating, bicycling, skiing and running) and specific occupations (e.g. firefighters and Special Forces). The quality of the regulatory processes of oxygen delivery and extraction can be described via oxygen uptake (V̇O2) kinetics. It is well-known that improved exercise capacity (V̇O2max) is accompanied by faster V̇O2 kinetics, which is an indicator of exercise performance [Citation1,Citation2].
Alterations in thermoregulatory responses – e.g. based on ambient temperature conditions – are associated with changes in cardiac output (Q̇) redistribution, which impacts the skin, visceral and skeletal muscle blood flow and mean arterial blood pressure [Citation3]. The thermoregulatory interplay becomes more complex with the combination of thermal and dynamic exercise stress. In this case, the redistribution of Q̇ to the skin for heat reduction and to the exercising skeletal muscles for the maintenance of aerobic metabolism can create a conflict in the Q̇.
Owing to the impacts of redistribution on the cardiovascular system during dynamic exercise in the heat, V̇O2 kinetics could be slowed because O2 delivery may be limited at the muscle site [Citation4,Citation5], improved by higher muscle temperature [Citation6,Citation7], or possibly unchanged as a net effect of counterbalancing the positive and negative impacts as aforementioned.
Only limited information is available on V̇O2 kinetics across different acute ambient temperature exposures during dynamic exercise. If ambient temperature affects muscle temperature, then aerobic metabolism could be influenced. For instance, higher temperatures induce faster reactions of the aerobic enzymes, resulting in faster muscle V̇O2 kinetics. Based on previous experiments, muscle or core hyperthermia at moderate [Citation8] or intense exercise intensity [Citation9] did not influence V̇O2 kinetics. The reason for this lack of information is caused by two issues: first, the appropriate equipment (e.g. climatic chambers) is rare and hardly accessible. Second, applied cooling or heating devices (e.g. jackets, suits) only establish a locally restricted temperature environment on or within body segments [Citation8–12]. These locally restricted temperature environments can lead to altered interactions of centrally (e.g. the hypothalamic area) and peripherally (e.g. leg, thorax skin) affected thermoreceptor responses in contrast to all-encompassing ambient conditions. For instance, a real integrated temperature environment should consider both peripheral (skin) and central (hypothalamus) receptors for thermoregulatory temperature control. Therefore, it is important to strive for this environment to establish real ambient conditions, which can be achieved by applying a climatic chamber.
From a sophisticated point of view, V̇O2 kinetics must be subdivided into the measurement at the mouth (pulmonary oxygen uptake [V̇O2pulm]) and the oxygen consumption across the exercising skeletal muscles (muscular oxygen uptake [V̇O2musc]). This differentiation is important during work rate (WR) transitions because V̇O2pulm is – in contrast to V̇O2musc – non-linearly time-delayed and distorted because of venous return and Q̇ dynamics [Citation13,Citation14]. Therefore, appropriate models are required to account for these deformations and for the proper estimation of V̇O2musc kinetics, which is the parameter of interest [Citation13,Citation15–20]. The differentiation between the pulmonary and the muscle levels is of general relevance because hyperthermia-induced alterations in Q̇ – based on heart rate (HR) responses – result in the redistribution of Q̇ and can lead to altered venous muscle-to-lung transit times, impacting V̇O2pulm kinetics.
In this regard, HR is an indicator of baroreflex sensitivity by means of blood pressure regulation and can subsequently impact Q̇, as well. There is evidence that the baroreflex response is not impaired by passive heat strain [Citation3], but there is no information available to suggest that HR kinetics may be impacted as a result of different ambient temperature conditions during dynamic exercise.
Typically, V̇O2 is non-invasively measured at the mouth by the application of repeated step responses in WR and is analysed with multiple exponential mathematical equations and fitting procedures [Citation15,Citation21]. In this regard, multi-exponential approaches cannot be applied for fast changes in WR by definition [Citation22–25]. Alternatively, the application of pseudorandom binary sequence (PRBS) WR protocols with a time-series analysis (e.g. auto- correlation function [ACF] and cross-correlation function [CCF]) allows a practical evaluation of the parameters of interest in the transient WR phases in a single test run [Citation13,Citation26,Citation27].
The novelty of the presented study is the combined application of the sophisticated analysis of V̇O2musc and V̇O2pulm kinetics with a climatic chamber. Here, we are interested in the acute effects of different ambient temperature conditions on cardio-pulmonary and respiratory parameters during moderate dynamic leg exercise.
We intended to investigate whether the application of a PRBS WR protocol combined with a time-series analysis and the utilisation of a climatic chamber provided comparable results with previous studies that applied locally restricted temperature environments. The following hypothesis was tested: HR, V̇O2pulm and V̇O2musc kinetics are not different across ambient temperatures of 15 °C, 25 °C and 35 °C.
Methods
Subjects
Thirteen physically healthy, active, male volunteers (age: 36 ± 10 years; height: 180 ± 6 cm; body mass: 82 ± 10 kg; body mass index: 25 ± 3 kg/m2 [mean ± standard deviation]) participated in the study and gave their written informed consent, which was in accordance with the 1964 Declaration of Helsinki and its later amendments or comparable ethical standards. Informed consent was approved by the Ethics Committee of the German Sport University Cologne.
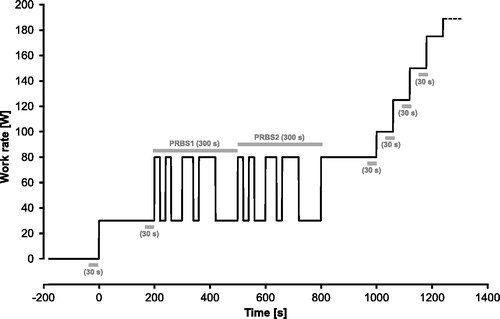
Figure 1. Work rate protocol for exercise testing for the three different ambient temperatures. Gray horizontal bars indicate time periods for mean value calculations during rest (30 s), at low and high constant phases (30 s), during the PRBS phases (300 s) and at the end of the WR steps of 100, 125 and 150 W (30 s each). PRBS: pseudorandom binary sequence.
Exercise protocol and climatic chamber
Each subject performed three identical exercise tests, each at different ambient temperatures (15 °C, 25 °C and 35 °C) on a semi-recumbent (seat back at 45° to ground level) cycle ergometer (ergometrics er900L, Schiller AG, Baar, Switzerland) with a cadence of 60 rpm. The exercise protocol includes two parts (). In the first part (time: 0–1000 s), PRBS WR changes between 30 and 80 W were applied for the kinetics analysis with constant low and high phases before (30 W; 200 s) and after (80 W; 200 s) the PRBS.
In the second part (time >1000 s), a step increase in WR (25 W·min−1) was applied until the subjects reached their symptom-limited maximums. For each participant, at least 24- to 48-h recoveries were prescribed between the tests.
A climatic chamber (NEMA NCZ3036N(S), WTD 61, Manching, Germany) was used to control the ambient conditions (see ).
Table 1. Ambient conditions in the climatic chamber during the exercise tests (mean ± SD).
Test procedure
Before each exercise test, the ambient temperature and the relative humidity in the climatic chamber were verified to be within the expected range.
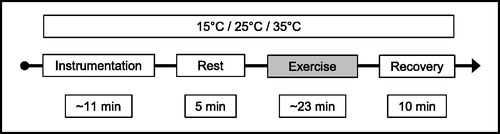
The subjects were prepared outside the climatic chamber at a room temperature of ∼20 °C. The instrumentation of the subjects was then performed in the climatic chamber followed by a resting phase for acute acclimatisation and baseline measurements. Next, the exercise test was performed either at 15 °C, 25 °C or 35 °C in a randomised order (). In the climatic chamber, all subjects wore only shorts, socks and sports shoes.
Figure 2. Test procedure time line. See text for details.
Heart rate, oxygen uptake and core body temperature measurements
HR was measured beat-to-beat using an ECG (Schiller AT-104 PC EKG, Schiller Medizintechnik GmbH, Feldkirchen, Germany), and V̇O2pulm was measured breath-by-breath (ZAN 680, ZAN Messgeräte GmbH, Oberthulba, Germany) by applying the algorithms of Beaver et al. [Citation28] for true alveolar gas exchange.
To determine core body temperature (CBT), a heat flux sensor labelled “Double Sensor” (DS) was used. The DS was fixed above each subject’s left eye, below the hairline on a nearly flat surface/area (regio frontalis). A description of the sensor design, precision, accuracy and validity is given elsewhere [Citation29–32]. During the 15 °C temperature condition, the DS was insulated on its exterior with a textile pad for CBT correction because the sensor is physically disturbed by cold environmental conditions below 20 °C.
Stroke volume and gas exchange threshold estimations
Stroke volume (SV) was estimated for the constant phases before and after the PRBS intervals for 30 and 80 W by applying Equation (Equation1(1) ), which was taken and adapted from Geigy Scientific Tables [Citation33,Citation34].
(1)
The gas exchange threshold was calculated by applying the V-slope method [Citation35] across the different temperature conditions.
Data processing
All measured breath-by-breath, beat-to-beat and CBT data were time-aligned and interpolated into 1-s intervals for further analysis.
Kinetics analysis
The kinetics analyses of HR and V̇O2pulm and the estimation of V̇O2musc were assessed according to the approach of Hoffmann et al. [Citation13]. The CCF of the WR and the parameter of interest (e.g. HR, V̇O2pulm or V̇O2musc) were applied to estimate the maximum (CCFmax) of the CCF and the related lag (CCFlag) as surrogates of the kinetics responses. Higher CCFmax-values indicate faster system responses, and higher CCFlag-values indicate delayed system responses.
Statistical analysis
All data were analysed for normal distribution (ND) by applying a Kolmogorov–Smirnov test with Lilliefors significance correction.
For comparisons of peak responses, the gas exchange threshold, exercise time, model parameters and the CCFmax- and CCFlag-values, a repeated-measures analysis of variance (ANOVA) with Temperature as factor was applied if ND was given. Otherwise, the Friedman test with post hoc pairwise Wilcoxon signed-rank test comparisons with alpha error accumulation correction was utilised.
In addition, for the influence of ambient temperature on thermoregulatory parameters, a two-way repeated-measures ANVOA was performed for HR and CBT with Temperature and Work rate as factors during low (30 W), high (80 W) and dynamic WR changes (PRBS1&2; 53.3 W) and also during the following WR steps (100, 125 and 150 W) as long as all 13 participants were able to continue exercising on the leg ergometer.
For the dynamic kinetics analysis, a two-way ANOVA with Temperature and Lag as factors was performed for HR, V̇O2pulm and V̇O2musc at specific lag times (−20 to 120 s; stepwise: 10 s) to account for comparisons between the CCF time course and temperature.
In case of significant factors or interactions, post hoc pairwise comparisons (Bonferroni) were performed.
Relationships between the parameters were detected using the Pearson product–moment correlation coefficient in the case of ND. Otherwise, the Spearman rank correlation coefficient was applied. Statistical significance was set to 0.05 at the alpha level.
Results
Peak responses
summarises the peak responses of power output, V̇O2, HR, CBT and the values of the gas exchange threshold and exercise time.
Table 2. Peak responses (mean ± SD) during exercise for 15 °C, 25 °C and 35 °C ambient temperatures.
Basic thermoregulatory responses
illustrates the absolute values of HR as a function of WR as grouped mean data for the different ambient temperature conditions. According to the two-way repeated-measures ANOVA with factors Work rate and Temperature, the factors Work rate (p < 0.001) and Temperature (p < 0.01) were significant, but no significant interactions (p > 0.05) could be observed. For Temperature, pairwise post hoc comparisons (Bonferroni) revealed that the conditions 15 °C and 35 °C (p < 0.01) were significantly different. For Work rate, the HR values were significantly different for all pairwise comparisons (Bonferroni; p < 0.001).
Figure 3. (a,b) Absolute values of HR (mean ± SE, 3a) and CBT (mean ± SE, 3b) as function of WR across the ambient temperatures (15 °C, 25 °C and 35 °C). CBT: core body temperature; HR: heart rate; SE: standard error of the mean; WR: work rate.
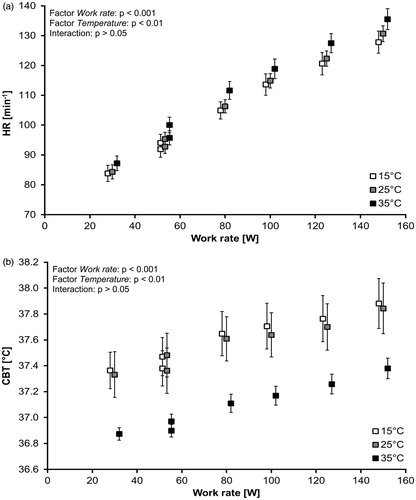
illustrates the absolute values of CBT as function of WR as grouped mean data for the different ambient temperature conditions. According to the two-way repeated-measures ANOVA with factors Work rate and Temperature, the factors Work rate (p < 0.001) and Temperature (p < 0.01) were significant, but no significant interactions (p > 0.05) could be observed. For Temperature, pairwise post hoc comparisons (Bonferroni) revealed that the conditions 15 °C and 35 °C (p < 0.01) and 25 °C and 35 °C (p < 0.05) were significantly different. For Work rate, the CBT values were significantly different for all pairwise comparisons (Bonferroni; at least p < 0.05) without a comparison of 30 W and PRBS1 (53.3 W; p > 0.05).
To establish comparable conditions for further analysis during exercise, we calculated the relative changes (Δ; based on resting values) as averages of HR and CBT for 30 W, PRBS1&2 (53.3 W), 80, 100, 125 and 150 W as functions of WR (). The relative changes for HR and CBT and for the ΔHR–WR and ΔCBT–WR relationships show only a significant influence of Work rate (p < 0.001). Neither Temperature nor the interactions illustrate significant effects (p > 0.05) expressed as relative changes.
Figure 4. (a–c) Relative changes of HR (ΔHR, mean ± SE, 4a), CBT (ΔCBT; mean ± SE, 4b) and PSI (mean ± SE, 4c) based on the resting values as function of work rate across the ambient temperatures. CBT: core body temperature; HR: heart rate; PSI: physiological strain index; SE: standard error of the mean.
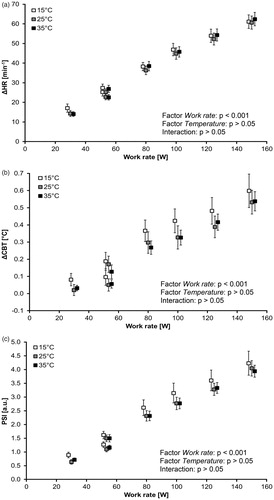
The physiological strain index (PSI) [Citation36] is a common measure to evaluate heat stress. Accordingly, we calculated the PSI as the PSI–WR relationship () for each of the three temperature conditions. According to a two-way repeated-measures ANOVA with Work rate and Temperature as factors, Work rate was significant (p < 0.001), but Temperature and the interactions were not significant (p > 0.05). For Work rate, the PSI values were significantly different for all pairwise comparisons (Bonferroni; at least p < 0.01).
Kinetics analysis – time-series analysis
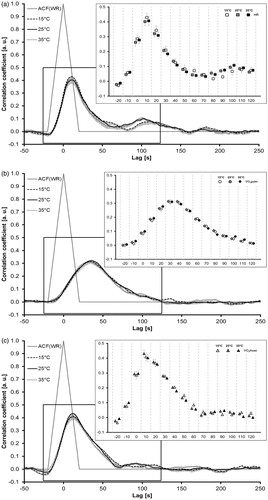
A two-way repeated-measures ANOVA revealed a significant effect of factor Lag (p < 0.001), but not factor Temperature or the interactions (p > 0.05) in each case for HR, V̇O2pulm and V̇O2musc kinetics (). Post hoc comparisons for Lag are not displayed because potential differences between lags are natural and were not of interest in the current investigation. Nevertheless, HR, V̇O2pulm and V̇O2musc differ in their relative CCF courses, demonstrating different kinetics over the entire responses.
Figure 5. (a–c) Means (±SE) of the cross-correlation functions (CCF) of WR with HR (5a), pulmonary (V̇O2pulm 5 b) and muscular (V̇O2musc, 5c) oxygen uptake, respectively, for the different ambient temperatures. The grey triangle displays the ACF of WR. The upper right enhanced graphs display the mean values (± SE) at specific lag times (−20, −10, 0, 10, 20, 30, 40, 50, 60, 70, 80, 90, 100, 110 and 120 s) for a comparison applying a two-way ANOVA with factors Lag and Posture. Significant differences for factor Lag are not displayed graphically to avoid overloading the figure. See text for further explanation. ACF: auto-correlation function; ANOVA: analysis of variance; HR: heart rate; SE: standard error of the mean; WR: work rate.
The maxima of the CCF courses and their corresponding lags allow visualisation of the kinetics responses of HR, V̇O2pulm and V̇O2musc in a compressed manner as grouped mean data (). This allows an easy and direct comparison of the kinetics responses across the temperature conditions. No significant differences in CCFmax or in CCFlag were found for HR, V̇O2pulm and V̇O2musc across the temperature conditions (see also ). The CCFmax-values of HR and V̇O2musc are located close to or on the descending part of the ACF (WR). This result presents indicative – though insufficient – information that these parameters may be in line with the assumption of first-order system properties. In contrast, the CCFmax-values of V̇O2pulm, located at lags between 30 and 40 s, indicate that this parameter is substantially inconsistent with first-order system properties.
Figure 6. Mean (±SE) of the CCF [maxima and lags (CCFmax, CCFlag)] of work rate with HR, pulmonary (V̇O2pulm) and muscular (V̇O2musc) oxygen uptake, respectively, for 15 °C, 25 °C and 35 °C ambient temperatures. The grey line illustrates the auto-correlation function of WR (in part). Data points that are close to or on this line represent therefore possible assumptions of a linear first-order response of the physiological system or parameter behind the computational rational. CCF: cross-correlation function; HR: heart rate; SE: standard error of the mean.
![Figure 6. Mean (±SE) of the CCF [maxima and lags (CCFmax, CCFlag)] of work rate with HR, pulmonary (V̇O2pulm) and muscular (V̇O2musc) oxygen uptake, respectively, for 15 °C, 25 °C and 35 °C ambient temperatures. The grey line illustrates the auto-correlation function of WR (in part). Data points that are close to or on this line represent therefore possible assumptions of a linear first-order response of the physiological system or parameter behind the computational rational. CCF: cross-correlation function; HR: heart rate; SE: standard error of the mean.](/cms/asset/077be2e3-71d0-44cc-9c34-a769d3350acf/ihyt_a_1354402_f0006_b.jpg)
Table 3. Means and SD of model parameter estimates and time-series analysis between HR, muscular (V̇O2musc) and pulmonary (V̇O2pulm) oxygen uptake for 15 °C, 25 °C and 35 °C ambient temperatures.
The model parameter estimates, the CCFmax- and the CCFlag-values for HR, V̇O2pulm and V̇O2musc are summarised in . For differences in venous blood volume (Vv), a trend was observed (0.10 > p > 0.05). With increasing ambient temperature, Vv decreases (15 °C–25 °C: −3.6%; 15 °C–35 °C: −14.0%). At the same time, the perfusion of non-exercising tissues (Q̇rem) increases (15 °C–25 °C: +7.0%; 15 °C–35 °C: +23.0%).
Kinetics analysis – first-order system properties
To verify the CCF courses of HR, V̇O2pulm and V̇O2musc for the first-order system properties (), we conducted the following steps:
Averaging of the three temperature conditions to obtain a single CCF course for each parameter (HR, V̇O2pulm and V̇O2musc).
Computation of the error bars as 95% confidence intervals for all data points for each parameter.
Determination of the CCFmax of the averaged single CCF course to estimate the corresponding time constant (τ) for each parameter (HR, V̇O2pulm and V̇O2musc).
Using the estimated τ, we simulated CCF courses equivalent to the first-order system properties in the respective figures for a one-to-one comparison.
Calculation of the residuals between the averaged single CCF course from the estimated (V̇O2musc) and measured (HR, V̇O2pulm) data and the simulated CCF course of a first-order system.
Generally, we assume that a first-order system responds without a time delay (TD). The comparisons between predefined and estimated system responses are illustrated in . However, V̇O2pulm is delayed and distorted because of cardio dynamic influences and venous return, so a TD or an equivalent approach is obviously necessary for an analysis of the kinetics responses. Therefore, we shifted the simulated CCF course (τ = 43.8 s) and the ACF (WR) in to the right side (+20 s; lag-correction) to account for the delayed response and specifically for an improved fitting procedure as applied for the phase II analysis of V̇O2pulm.
Figure 7. (a–d) Averages (±95% confidence intervals) of the CCF of WR with HR (7a), muscular (V̇O2musc, 7 b) and pulmonary oxygen uptake without (V̇O2pulm, 7c) and with lag-correction (+20 s, 7d). The grey dotted lines illustrate the simulated CCF course of first-order system derived from the CCFmax of the corresponding parameter in each panel. The grey triangle illustrates the ACF of WR. The lower panels show the residuals between the measured or estimated parameters and the simulated CCF course with τ as the first-order system in each case. ACF: auto-correlation function; CCF: cross-correlation function; HR: heart rate; WR: work rate.


Next, we calculated the magnitude of the aberrations between the first-order system responses and a particular parameter from the residuals in as the sum of deviation squares (SDS; see ).
Figure 8. SDS of HR, muscular (V̇O2musc) and pulmonary oxygen uptake kinetics [V̇O2pulm, without and with lag-correction (+20 s)]. The deviance is calculated between simulated CCF courses derived from the corresponding CCFmax value and the measured or estimated parameter (from lags −20 to 180 s, see ). Smaller values indicate better agreements with first-order system properties. CCF: cross-correlation function; HR: heart rate; SDS: sum of deviation squares.
![Figure 8. SDS of HR, muscular (V̇O2musc) and pulmonary oxygen uptake kinetics [V̇O2pulm, without and with lag-correction (+20 s)]. The deviance is calculated between simulated CCF courses derived from the corresponding CCFmax value and the measured or estimated parameter (from lags −20 to 180 s, see Figure 7). Smaller values indicate better agreements with first-order system properties. CCF: cross-correlation function; HR: heart rate; SDS: sum of deviation squares.](/cms/asset/3f0877ea-1169-4a47-8f7c-435ccf3fd654/ihyt_a_1354402_f0008_b.jpg)
The SDS values are high for V̇O2pulm both with and without lag-correction. In contrast, HR shows minor deviations, but V̇O2musc shows the best agreement with the first-order system properties.
Significant correlations were found between the CCFmax-values of V̇O2pulm and V̇O2musc at 15 °C (r = 0.732, p < 0.01), 25 °C (r = 0.688, p < 0.01) and 35 °C (r = 0.744, p < 0.01). For the relationship between the absolute peak V̇O2 and the CCFmax of HR, a significant correlation was found at 35 °C (r = 0.708, p < 0.01), but not at 15 °C (r = 0.208, p > 0.05) or 25 °C (r = 0.512, p > 0.05). A significant correlation was found between the absolute peak V̇O2 and the CCFmax of V̇O2musc at 35 °C (r = 0.712, p < 0.01), but not at 15 °C (r = 0.160, p > 0.05) or 25 °C (r = 0.093, p > 0.05). The relative peak power output showed a significant correlation with the CCFmax of V̇O2musc at 35 °C (r = 0.666, p < 0.01), but not at 15 °C (r = 0.145, p > 0.05) or 25 °C (r = 0.049, p > 0.05). Between the peak CBT and the relative peak power output, a correlation was observed at 35 °C (r = 0.681, p < 0.05), but not at 15 °C (r = 0.142, p > 0.05) or 25 °C (r = 0.388, p > 0.05).
Discussion
To the best of our knowledge, this study is the first to investigate the impact of different acute ambient temperature exposures on cardio-pulmonary and respiratory kinetics during moderate leg exercise using a climatic chamber. In particular, the discrimination between the pulmonary and the muscle responses in V̇O2 kinetics provides sophisticated insights into the thermoregulatory interactions between the involved physiological systems. The most significant findings can be summarised as the following:
During dynamic moderate exercise, in each case, no significant differences in HR, V̇O2pulm or V̇O2musc kinetics could be identified across the different temperature exposures in a climatic chamber.
Baroreflex regulation based on HR kinetics does not appear to be influenced by different temperature conditions.
HR and especially V̇O2pulm kinetics show significant deviations from the first-order system properties.
V̇O2musc kinetics show the smallest deviations from the first-order system properties.
Virtual Vv shows a tendency for an effect of temperature.
Absolute CBT is reduced at 35 °C in contrast to 15 °C and 25 °C during moderate exercise.
Peak values
The estimated peak values must be reviewed with caution because the subjects were indeed stressed to the submaximal intensity domain but were not ultimately exhausted. This was due to aborted procedures because of reaching symptom-limited criteria (e.g. predicted maximal HR) or subjects’ request for recovery. Therefore, we chose not to compare our absolute peak data with the literature.
Thermoregulatory responses
HR showed significantly higher values at 35 °C in contrast to the 15 °C ambient temperature condition. This is due to the hyperthermia-induced tachycardia, which is basically described in the literature [Citation37,Citation38]. However, between 25 °C and 35 °C, there were no significant differences in HR between the two conditions, illustrating that thermoregulatory responses by means of increased HR become apparent with higher increasing ambient temperatures. With increasing ambient temperatures, CBT also increases due to the accumulation of heat from the exercising tissues. To prevent heat strain, Q̇ is redistributed from the exercising body compartments and the central circulation to non-exercising tissues (e.g. cutaneous vascular beds) to reduce CBT. This results in hyperthermia-induced tachycardia to sustain a sufficient Q̇ during exercise.
In this context, CBT showed significantly lower absolute values at 35 °C compared with 15 °C and 25 °C, respectively. This may be a compensatory effect based on blood flow redistribution towards the external vascular beds, resulting in cooling of the body and a decreased CBT in the higher ambient temperature condition during dynamic moderate exercise.
To establish comparable conditions of HR and CBT, we calculated the relative changes of these parameters as functions of WR. Here, ΔHR and ΔCBT showed no significant differences relative to ambient temperature effects. Additionally, PSI – an estimate for the physiological strain index based on HR and CBT measurements – revealed no systematic differences between the three ambient temperature conditions. In summary, the thermoregulatory responses showed similar influences at the three different ambient temperatures on PSI at moderate exercise intensities up to 150 W. Additionally, there are indications that heat stress has no effect on motor and cognitive functions [Citation39], so motor control can be assumed to be equal during dynamic exercise across the different temperature conditions.
Kinetics analysis
The kinetics analysis, which included CCFmax, CCFlag and the entire CCF course, revealed no significant differences between the ambient temperature conditions for HR, V̇O2pulm or for V̇O2musc in each case. However, it can be recognised that the relative CCF courses of HR, V̇O2pulm and V̇O2musc are different. HR and V̇O2musc seem to be relatively similar, but they are indeed different.
The reduced kinetics responses as reflected by CCFmax- and CCFlag-values must be seen as simplifications that are accompanied by losses in the kinetics information. Then, the CCFmax- and the CCFlag-values have only descriptive characteristics, without sufficient significance for the entire kinetics responses. Therefore, it is more valuable to evaluate the entire CCF course as demonstrated in the following.
It was hypothesised that HR kinetics would not be altered at different ambient temperatures, but absolute HR values would be different in the time domain based on Q̇ redistributions. So, absolute HR values and HR kinetics do not seem to be coupled and can therefore be altered independently. It is known that heat stress does not affect the baroreflex regulation of HR in non-exercise conditions [Citation40–42]. Yamazaki and Sone [Citation43] showed that baroreflex sensitivity increased during cooling, but no alterations were observed relative to heating. Assuming that baroreflex regulation would not be altered with the combination of heat and dynamic exercise, HR control would not be influenced either and then HR kinetics would be similar. We have shown this in the present study, but only in the temperature range of 15 °C–35 °C. Therefore, we hypothesise that HR kinetics can serve as a proxy for baroreflex sensitivity in normothermia and in hyperthermia, especially in the range of 15 °C–35 °C.
For V̇O2pulm, we also hypothesised that there is no Temperature effect between the conditions, which was derived from the literature. The kinetics analysis by Nybo et al. [Citation9] demonstrated that marked hyperthermia does not alter V̇O2 on-kinetics. Koga et al. [Citation8] showed that increased muscle temperature had no effect on V̇O2-kinetics, both in moderate and in heavy exercise domains. Alternatively, it could be argued that the redistribution of Q̇ and an increased HR at higher ambient temperatures resulted in faster or slower V̇O2pulm kinetics. The literature and our data suggest that this is not the case, but these alterations may exist. However, their impacts on the V̇O2pulm measurement could be too small to identify.
One significant novelty of the present study in the field of kinetics analyses is the non-invasive discrimination between V̇O2pulm and V̇O2musc kinetics using a climatic chamber. Here, we were able to “remove” the dynamic distortive effects of Q̇ and venous blood transit times on V̇O2pulm to obtain a clear and non-sluggish V̇O2musc response. The results imply that V̇O2musc kinetics showed no significant differences across the acute temperature conditions. This assumption is based on the fact that the exercising leg muscles are equally demanded (e.g. the same recruitment patterns of muscle fibers), resulting in similar metabolic rates and also in the same kinetics responses. It can also be assumed that muscle temperature is not influenced, but if it is affected, there are no significant alterations in V̇O2musc kinetics. Additionally, we ensured that all participants were tested within 2 weeks and that no training procedures were performed, which could speed V̇O2 kinetics. This is supported by the gas exchange threshold (GET) values, which are not significantly different, implying that the aerobic fitness level was not influenced or altered in each subject.
In the literature, it is currently unclear whether V̇O2musc kinetics behave as a pure first-order system with or without a TD as we will show below. Di Prampero and Margaria [Citation44] demonstrated – consistent with our data – a mono-exponential time course of oxygen consumption (gastrocnemius muscle) during exercise and in recovery without a TD in anaesthetised dogs. In this regard, Behnke et al. [Citation45] illustrated an increased muscle V̇O2 without a noticeable TD in rats. Mahler [Citation46] described a good approximation of first-order system properties for muscle oxygen consumption in frog sartorius muscles. In contrast, Grassi et al. [Citation19] demonstrated a TD in V̇O2 during leg exercise in humans. Additionally, Grassi et al. [Citation47,Citation48] showed sluggish V̇O2 on-kinetics in isolated in situ canine muscles, illustrating deviations from mono-exponential system properties.
In sum, and show that V̇O2musc kinetics show the best approximation of first-order system properties. For HR, greater deviations have been estimated, followed by V̇O2pulm, which shows major aberrations from a first-order system.
General discussion
Stroke volume estimation
As demonstrated by Drescher [Citation49], variations in Q̇ (i.e. based on SV estimations) show negligible effects on the assessment of V̇O2musc kinetics but have effects on Vv and muscular arteriovenous oxygen content difference estimations. Because we applied this procedure in all subjects and across all three ambient temperature conditions, the tests are therefore standardised and should be comparable among each other in the present study. However, one issue must be considered. Although the relative SV estimations among the temperature conditions are reasonable, the absolute SV values and, therefore, the absolute Vv data may not be adequate because SV is used for the estimation of Vv.
Venous blood volume (Vv) and the perfusion of the non-exercising compartments (Q̇rem)
With elevated ambient temperatures, a tendency towards decreased Vv was observed (15 °C–25 °C: −3.6%; 15 °C–35 °C: −14.0%). At the same time, Q̇rem showed an increase that was not significant. Both circumstances can be attributed to thermoregulatory adaptations. With increasing ambient temperature, CBT also increases over time. This has an impact on the redistribution of Q̇ to more external body segments, transferring heat from the core to remote body areas and increasing Q̇rem. Simultaneously, the overall Vv is redistributed to cell interstitials owing to the initial mechanisms of sweating. Additionally, sweating causes fluid loss, which reduces the overall Vv. It must be noted that Vv represents the amount of venous blood volume between the exercising muscles and the lungs only. Therefore, it is a virtual value that cannot be measured practically and serves as more of a vague estimation to illustrate trends or drifts.
Comparisons with women
There is evidence that the thermoregulatory responses of women to combined heat and exercise strain are comparable with those of men [Citation50–53]. However, in women, luteal and pre- and postmenopausal phases must be taken into account because CBT thresholds are altered during these periods [Citation54] and could have an effect on cardio-pulmonary and respiratory responses. Therefore, in these phases, the kinetics responses of HR, V̇O2pulm and V̇O2musc may be different in women compared with those of men.
Conclusions
The results imply that (a) ambient temperature (range: 15 °C–35 °C) has no effect on HR, V̇O2pulm or V̇O2musc kinetics at moderate exercise intensities (30–80 W) during dynamic exercise, (b) baroreflex regulation based on HR kinetics does not seem to be influenced by different temperature conditions, (c) V̇O2musc kinetics show good agreement with first-order system properties in contrast to HR and V̇O2pulm kinetics, which show greater deviations and (d) the application of the non-invasive method presented here may allow a rough estimation of Vv alterations based on trends.
For practical application, the applied approach may be of interest for assessments of the cardio-pulmonary and respiratory health statuses of individuals working or performing sports in extreme temperature environments. Furthermore, differentiation between systemic (e.g. cardio-dynamic: HR) and peripheral (e.g. exercising tissues: V̇O2musc) determinants of the involved physiological systems may improve the evaluation of an individual’s health status. This could be beneficial for improved cardio-pulmonary and respiratory fitness via therapeutic interventions for participants suffering from chronic diseases (e.g. diabetes mellitus) or after injuries and surgeries because potential prolonged bed rest phases could result in common fitness losses.
Furthermore, for exercise or work in warm and hot environments, the cardiodynamic and metabolic responses at the muscular level do not seem to be influenced by ambient temperature at moderate exercise intensity if hydration status can be controlled with appropriate water intake and if sweating is not negatively influenced by clothing or equipment.
Acknowledgements
The authors thank Stephan Klatt for support during the exercise tests and Michael Voigt for data preparation. The authors would also like to thank all the participating subjects from the military services and employees of the German Federal Armed Forces.
Disclosure statement
The authors declare that they have no conflict of interest.
Additional information
Funding
References
- Chilibeck PD, Paterson DH, Petrella RJ, et al. (1996). The influence of age and cardiorespiratory fitness on kinetics of oxygen uptake. Can J Appl Physiol 21:185–96.
- Burnley M, Jones AM. (2007). Oxygen uptake kinetics as a determinant of sports performance. Eur J Sports Sci 7:63–79.
- Crandall CG, González-Alonso J. (2010). Cardiovascular function in the heat-stressed human. Acta Physiol (Oxf) 99:407–23.
- Rowell LB. (1974). Human cardiovascular adjustments to exercise and thermal stress. Physiol Rev 54:75–159.
- Sawka MN, Wenger CB, Pandolf KB. (2011). Thermoregulatory responses to acute exercise‐heat stress and heat acclimation. Comprehens Physiol 157–185.
- Brooks GA, Hittelman KJ, Faulkner JA, et al. (1971). Temperature, skeletal muscle mitochondrial functions, and oxygen debt. Am J Physiol 220:1053–9.
- Willis WT, Jackman MR. (1994). Mitochondrial function during heavy exercise. Med Sci Sports Exerc 26:1347–53.
- Koga S, Shiojiri T, Kondo N, et al. (1997). Effect of increased muscle temperature on oxygen uptake kinetics during exercise. J Appl Physiol 83:1333–8.
- Nybo L, Jensen T, Nielsen B, et al. (2001). Effects of marked hyperthermia with and without dehydration on V̇O2 kinetics during intense exercise. J Appl Physiol 90:1057–64.
- González-Alonso J, Teller C, Andersen SL, et al. (1999). Influence of body temperature on the development of fatigue during prolonged exercise in the heat. J Appl Physiol 86:1032–9.
- Burnley M, Doust JH, Jones AM. (2002). Effects of prior heavy exercise, prior sprint exercise and passive warming on oxygen uptake kinetics during heavy exercise in humans. Eur J Appl Physiol 87:424–32.
- Brothers RM, Bhella PS, Shibata S, et al. (2009). Cardiac systolic and diastolic function during whole body heat stress. Am J Physiol Heart Circul Physiol 296:H1150–6.
- Hoffmann U, Drescher U, Benson AP, et al. (2013). Skeletal muscle VO2 kinetics from cardio-pulmonary measurements: assessing distortions through O2-transport by means of stochastic work-rate signals and circulatory modelling. Eur J Appl Physiol 113:1745–54.
- Lador F, Kenfack MA, Moia C, et al. (2006). Simultaneous determination of the kinetics of cardiac output, systemic O2 delivery, and lung O2 uptake at exercise onset in men. Am J Physiol Regul, Integ Comp Physiol 290:R1071–9.
- Barstow TJ, Mole PA. (1987). Simulation of pulmonary O2 uptake during exercise transients in humans. J Appl Physiol 63:2253–61.
- Barstow TJ, Lamarra N, Whipp BJ. (1990). Modulation of muscle and pulmonary O2 uptakes by circulatory dynamics during exercise. J Appl Physiol 68:979–89.
- Eβfeld D, Hoffmann U, Stegemann J. (1991). A model for studying the distortion of muscle oxygen uptake patterns by circulation parameters. Eur J Appl Physiol Occup Physiol 62:83–90.
- Cochrane JE, Hughson RL. (1992). Computer simulation of O2 transport and utilization mechanisms at the onset of exercise. J Appl Physiol 73:2382–8.
- Grassi B, Poole DC, Richardson RS, et al. (1996). Muscle O2 uptake kinetics in humans: implications for metabolic control. J Appl Physiol 80:988–98.
- Benson AP, Grassi B, Rossiter HB. (2013). A validated model of oxygen uptake and circulatory dynamic interactions at exercise onset in humans. J Appl Physiol 115:743–55.
- Barstow TJ, Molé PA. (1991). Linear and nonlinear characteristics of oxygen uptake kinetics during heavy exercise. J Appl Physiol 71:2099–106.
- Roman MA, Porszasz J, Cao R, et al. (2012). An efficient new method for determining oxygen uptake kinetics during exercise: the Chirp waveform. Am Thorac Soc 185:A2394.
- O'Connor SM, Wong JD, Donelan JM. (2016). A generalized method for controlling end-tidal respiratory gases during nonsteady physiological conditions. J Appl Physiol 121:1363–78.
- Casaburi R, Whipp BJ, Wasserman K, et al. (1977). Ventilatory and gas exchange dynamics in response to sinusoidal work. J Appl Physiol Respir Environ Exerc Physiol 42:300–1.
- Fukuoka Y, Iihoshi M, Nazunin JT, et al. (2017). Dynamic characteristics of ventilatory and gas exchange during sinusoidal walking in humans. PloS One 12:e0168517. doi:10.1371/journal.pone.0168517
- Hughson RL, Cuervo LA, Patla AE, et al. (1991). Time domain analysis of oxygen uptake during pseudorandom binary sequence exercise tests. J Appl Physiol 71:1620–1626.
- Edwards A, Claxton D, Fysh M. (2003). A comparison of two time-domain analysis procedures in the determination of VO2 kinetics by pseudorandom binary sequence exercise testing. Eur J Appl Physiol 88:411–16.
- Beaver WL, Lamarra N, Wasserman K. (1998). Breath-by-breath measurement of true alveolar gas exchange. J Appl Physiol Respir Environ Exerc Physiol 51:1662–75.
- Gunga HC, Sandsund M, Reinertsen RE, et al. (2008). A non-invasive device to continuously determine heat strain in humans. J Thermal Biol 33:297–307.
- Gunga HC, Werner A, Stahn A, et al. (2009). The double sensor – a non-invasive device to continuously monitor core temperature in humans on earth and in space. J Resp Neurol Physiol 169:S63–S8. S:
- Kimberger O, Thell R, Schuh M, et al. (2009). Accuracy and precision of a novel non-invasive core thermometer. Br J Anaesth 103:226–31.
- Opatz O, Trippel T, Lochner A, et al. (2013). Temporal and spatial dispersion of human body temperature during deep hypothermia. Br J Anaesth 111:768–75.
- Geigy Scientific T. (1990). Heart and circulation. Basel, Switzerland: elBA-GEIGY Limited.
- Rühle K, Fischer J, Matthys H. (1983). Norm values in spiroergometry. Atemwegs Und Lungenkrankheiten 9:157–73.
- Beaver WL, Wasserman K, Whipp BJ. (1986). A new method for detecting anaerobic threshold by gas exchange. J Appl Physiol 60:2020–7.
- Moran DS, Shitzer A, Pandolf KBA. (1998). Physiological index to evaluate heat stress. Regul Integr Comp Physiol 275:R129–34.
- Rowell LB, Blackmon JR, Martin RH. (1965). Hepatic clearance of indocyanine green in man under thermal and exercise stresses. J Appl Physiol 20:384–94.
- Rowell LB, Marx HJ, Bruce RA, et al. (1966). Reductions in cardiac output, central blood volume, and stroke volume with thermal stress in normal men during exercise. J Clin Invest 45:1801–16.
- Brazaitis M, Eimantas N, Daniuseviciute L, et al. (2015). Two strategies for the acute response to cold exposure but one strategy for the response to heat stress. Int J Hyperthermia 31:325–35.
- Crandall CG. (2000). Carotid baroreflex responsiveness in heat-stressed humans. Am. J. Physiol Heart Circ Physiol 279:H1955–62.
- Wilson TE, Cui J, Crandall CG. (2001). Absence of arterial baroreflex modulation of skin sympathetic activity and sweat rate during whole-body heating in humans. J Physiol (Lond) 536:615–23.
- Cui J, Wilson TE, Crandall CG. (2002). Baroreflex modulation of sympathetic nerve activity to muscle in heat-stressed humans. Am J Physiol Regul Integ Comp Physiol 282:R252–8.
- Yamazaki F, Sone R. (2000). Modulation of arterial baroreflex control of heart rate by skin cooling and heating in humans. J Appl Physiol 88:393–400.
- Di Prampero PE, Margaria R. (1968). Relationship between O2 consumption, high energy phosphates and the kinetics of the O2 debt in exercise. Pflugers Arch 304:11–19.
- Behnke BJ, Barstow TJ, Kindig CA, et al. (2002). Dynamics of oxygen uptake following exercise onset in rat skeletal muscle. Respir Physiol Neurobiol 133:229–39.
- Mahler M. (1985). First-order kinetics of muscle oxygen consumption, and an equivalent proportionality between QO2 and phosphorylcreatine level: implications for the control of respiration. J Physiol 86:135–65.
- Grassi B, Gladden LB, Samaja M, et al. (1998). Faster adjustments of O2 delivery does not affect VO2 on-kinetics in isolated in situ canine muscle. J Appl Physiol 85:1394–403.
- Grassi B, Gladden LB, Stary CM, et al. (1998). Peripheral O2 diffusion does not affect V(O2)on-kinetics in isolated in situ canine muscle. J Appl Physiol 85:1404–12.
- Drescher U. (2012). Entwicklung und Anwendung eines nichtinvasiven Verfahrens zur Abschätzung der muskulären Sauerstoffaufnahmekinetik im moderaten Belastungsbereich [Development and application of a non-invasive approach for estimation of muscle oxygen uptake kinetics at moderate exercise intensities] [dissertation]. Cologne: German Sport University Cologne, Germany.
- Davies CT. (1997). Thermoregulation during exercise in relation to sex and age. Eur J Appl Physiol Occup Physiol 42:71–9.
- Shapiro Y, Pandolf KB, Avellini BA, et al. (1980). Physiological responses of men and women to humid and dry heat. J Appl Physiol Respir Environ Exerc Physiol 49:1–8.
- Fisher M, Paolone V, Rosene J, et al. (1999). The effect of submaximal exercise on recovery hemodynamics and thermoregulation in men and women. Res Q Exercise Sport 70:361–8.
- Kaciuba-Uscilko H, Grucza R. (2001). Gender differences in thermoregulation. Curr Opin Clin Nutr Metab Care 4:533–6.
- Stephenson LA, Kolka MA. (1993). Thermoregulation in women. Exerc Sport Sci Rev 21:231–62.