
Abstract
Purpose: To retrospectively investigate the role of a contrast enhanced MRI (ceMRI) performed 24 h after a microwave ablation (MWA) of the lung, in predicting local tumour progression (LTP) and detecting complications compared to an unenhanced CT.
Material and methods: Forty-nine patients who underwent MWA of 77 lung metastases between 2008 and 2015 were included. All patients received an unenhanced chest CT and a ceMRI (including T2 and ceT1) 24 h after MWA. The conspicuities of the peripheral rim and the ablated tumour were scored using 1–3 scales and compared between examinations. The safety margin was measured directly (both scores ≥2) and indirectly using a subtraction method. The ability of each imaging modality to predict LTP based on safety margin width was analysed using receiver operating characteristic curves. The MRI ability to detect a pneumothorax was compared to CT.
Results: The peripheral rim was best visualised on T2 followed by T1 and CT. The tumour was best visualised on CT, followed by T1 and T2. Direct safety margin measurement was possible on CT, ceT1 and T2 in 68.8%, 64.9% and 27.3% of cases, respectively. Direct CT (AUC = 0.77) and ceT1 (AUC = 0.76) measurements had better diagnostic performance than indirect CT (AUC = 0.72), ceT1 (AUC = 0.70) and T2 (AUC = 0.69) measurements. The MRI sensitivity and specificity for pneumothorax were 60.8% and 87.0%, respectively. Only one pneumothorax >1 cm was missed.
Conclusions: A ceMRI performed 24 h after MWA of lung tumours has a similar ability to predict LTP and detect important complications as a CT has.
Introduction
Image-guided ablation techniques, most notably radiofrequency (RFA) and microwave ablations (MWA), are becoming a common therapeutic option for primary and metastatic lung disease. The local tumour progression (LTP) rate following ablative treatment can exceed 30%; therefore, these patients should be identified as early as possible as they might benefit from a repeated ablation [Citation1–3].
Besides the proximity to a blood vessel, the tumour size is considered to be the most important predictive factor for ablation success; therefore, most authors recommend the ablation of lesions smaller than 3–3.5 cm in diameter [Citation4–6]. However, Anderson et al. have demonstrated that not the tumour size itself but the ability to create a sufficiently large ablation zone to encompass the tumour and a rim of apparently normal lung tissue (safety margin) are required for a successful ablation [Citation7]. The size of the safety margin mainly depends on three factors [Citation7–9]: the size of the tumour, the extent of the ablation zone and the location of the tumour relative to the edge of the ablation zone. The post-ablation imaging follow-up usually consists of an early chest CT performed within the first week after treatment, followed by further CT examinations at regular intervals with additional PET/PET-CTs if required [Citation10,Citation11]. The early post-ablation CT can detect delayed complications and has the potential to identify incomplete ablations by evaluating the safety margin [Citation7].
While the post-treatment CT characteristics of the ablation zone are well known, the role of MRI has been subject to fewer investigations [Citation10]. Some studies describing the MR aspect of the ablation zone in animal models appeared in the early 2000s, but, because of the lower image quality and higher costs compared to CT, MR follow-up has not entered the clinical routine [Citation12–14]. However, due to technological progress and optimised lung protocols, experience in lung MRI has accumulated in the meantime allowing reliable lung imaging and interpretation [Citation15]. At our institution, an unenhanced CT and a contrast enhanced MRI were part of the early (24 h) evaluation of the lung ablation zone for more than seven years allowing a comparison between the two techniques. Therefore, the purpose of the present study was to investigate the role of a contrast enhanced MRI performed the day following a microwave ablation of the lung in predicting LTP and detecting complications using an unenhanced CT as a comparison.
Material and methods
Procedure details
The present single-centre retrospective study was approved by the local Ethics Committee and all patients gave informed written consent for the microwave ablation, the subsequent examinations and the anonymous use of their data in research purposes.
The decision to use microwave ablation for the treatment of lung metastases is taken at our institution after the consultation of a multidisciplinary tumour board. Patients with a successfully treated primary tumour that are considered inoperable due to insufficient cardiopulmonary reserves, other comorbidities and/or refusal of surgical resection are selected. The patients must have less than five pulmonary metastases and no chest wall, mediastinal, extrathoracic or lymphatic spread. An adequate platelet count and coagulation profile as well as the cessation of anticoagulant or antiplatelet medication according to intervention guidelines are required [Citation16].
The procedures were performed under CT guidance (Somatom Sensation 64; Siemens, Erlangen, Germany) and conscious sedation (15 mg Piritramide +5 mg Diazepam) by a radiologist with over 20 years of experience in thoracic interventions. A low frequency (LF), 915 MHz system (Covidien Evident, Boulder, CO) with a maximum power of 45 W (13 G cooled antenna with 12/17/22 cm shaft length) and a high frequency (HF), 2450 MHz system (Covidien Emprint, Boulder, CO) with a maximum power of 100 W (13 G cooled antenna with 15/20/30 cm shaft length) were used. The power settings and ablation times were adjusted according to the manufacturer's protocols while taking tumour size and location into consideration. All treatments consisted of single ablations with a constant position of the antenna. No overlapping ablations were part of the present study. The LF system was used between January 2008 and May 2015. The HF system was introduced in January 2014 and has been used until the present day.
Imaging protocol
Immediately prior to the intervention all patients received an unenhanced planning-CT of the chest (Somatom Sensation 64; Siemens, Erlangen, Germany: 5-mm collimation, 30 mAs, 120 kV). The post-interventional examination protocol was carried out in the day following the ablation and included an unenhanced chest CT (same parameters) and a contrast-enhanced chest MRI. The post-interventional MRIs were performed on different systems of the same manufacturer (Siemens Healthcare, Erlangen, Germany): Espree (1.5 T, 01/2008 – today), Avanto (1.5 T, 01/2008 – 03/2013), AvantoFit (1.5 T, 04/2013 – today), Trio (3 T, 01/2008 – 10/2013), PrismaFit (3 T, 11/2013 – today). The post-interventional MRI was part of the daily routine and therefore, the assignment to a certain scanner was based on workflow reasons. All examinations included the following sequences: breathhold pre- and postcontrast axial T1-weighted fast low angle shot (FLASH, slice thickness (ST): 5 mm; field-of-view (FOV): 325 × 400 mm2; acquisition matrix: 256 × 208), breathhold axial T2-weighted half-Fourier acquisition single-shot turbo spin-echo (HASTE, ST: 5 mm; FOV: 310 × 400 mm2; acquisition matrix: 320 × 186) with fat saturation, breathhold coronal T2-weighted HASTE (ST: 5 mm; FOV: 430 × 430 mm2; acquisition matrix: 256 × 256). All other pulse sequence parameters (echo time, repetition time, flip angle, etc.) were adapted for every examination and varied between the scanner types.
Contrast injection of macrocyclic contrast agents Gadobutrol (Gadovist, Bayer Healthcare, Leverkusen, Germany) or Gadoterate (Dotarem, Guerbet, Villepinte, France) adapted to the patient’s weight was performed using a power injector (Accutron MR, Medtron, Saarbrücken, Germany) at a rate of 2 ml/s, followed by the application of 20 ml saline at a rate of 2 ml/s.
Follow-up CTs were performed at 3, 6, 9 and 12 months after MWA, and then at 6 months intervals. LTP was considered when any new growth of the ablation zone was detected.
Inclusion criteria and patients
The inclusion criteria for the present study were as follows: (1) lung metastases ablated with one of the two aforementioned MWA system, (2) index tumour size <3.5 cm, (3) imaging follow-up >12 months for patients with no clear signs of local progression, (4) both an unenhanced chest CT and a MRI including T2 and contrast enhanced T1 (ceT1) sequences performed within 24 h after the ablation ().
Figure 1. Flow diagram depicting patient selection. p = number of patients; n = number of metastases.
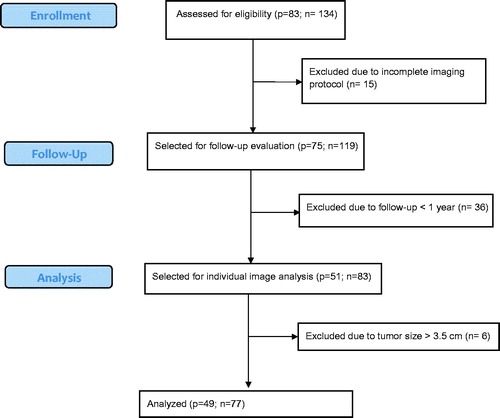
Forty-nine consecutive patients (24 male and 25 female) with an average age of 57.7 years (SD = 11.7; range 34–82) treated between September 2008 and July 2015 met the inclusion criteria. A total of 77 lung metastases (mean diameter = 1.2 cm; SD = 0.5; range: 0.3–2.6) were ablated: 31 colorectal, 10 bronchial, 10 breast, eight hepatocellular carcinoma, five adenoid cystic, three cervix, three head and neck, two endometrial, two cholangiocarcinoma and one kidney, oesophagus and thyroid carcinoma each. Sixteen (20.7%) ablations were performed with the HF system and 61 (79.3%) ablations were performed with the LF system. The median follow-up was 22.5 months (range 12–93). Thirty metastases (38.9%) showed local progression (LP) with a median time to progression of 12.5 months (range 3–41 months).
Analysis of the ablation zone
All ablation zone measurements were performed by two independent readers with 3 and 4 years of experience in thoracic imaging and the final results were averaged. The CT and MR examinations were evaluated at an interval of three weeks, with the readers being blinded to the identity of the patient and to the occurrence of LTP. A third reader, with 12 years of experience in thermal ablations who was blinded to the ablation zone measurements investigated the presence of LTP on the follow-up CTs.
Conspicuity of the ablation zone
The ablation zone has been shown to have a central area with complete tissue necrosis and a peripheral rim (PR) containing viable tissue [Citation17]. The PR appears on unenhanced CT as hyperdense, on T2 sequences as strongly hyperintense and on ceT1 sequences as an enhancing ring. In order to be able to measure the safety margin, both the tumour and the PR of the ablation zone must be visible at the examinations performed 24 h after treatment. The ability of unenhanced CT (lung window) and MRI (T2 and ceT1) sequences to depict these two elements was scored using a 3-point scale (1 = hardly visible, 2 = partially visible, 3 = clearly visible).
The overall image quality (MRI artefact score) was assessed with a 3-point scale, where 3 represented the absence of quality degrading artefacts and 1 represented severe breathing or pulsation artefacts.
The conspicuity scores of the PR and of the tumour as evaluated on each examination (lung window CT, ceT1 and T2) were compared to each other using the Friedman test. Spearman’s test was used to determine the existence of a correlation between the conspicuity scores and the MRI artefact scores. The same test was used to determine the correlation between the tumour size as measured before the ablation and the post-ablation tumour conspicuity score.
Safety margin
If the conspicuity of the PR and of the tumour were satisfactory (both conspicuity scores ≥2), the safety margin was directly measured as the shortest distance between the edge of the tumour and the inner contour of the PR (). This measurement method was chosen because the inner contour is clearly visible in most cases and it corresponds to the limit between necrotic and viable tissue [Citation12,Citation17]. The direct measurement method was used, where possible, for CT and ceT1 sequences, but not for T2 sequences because, in the vast majority of cases, the tumour could not be distinguished within the ablation zone.
Figure 2. Schematic depiction of the ablation zone and of the measurement methods. The safety margin was measured as the shortest distance (thin line) between the tumour (dark grey) and the peripheral rim (light grey). The short-axis diameter used for the indirect measurements is shown as the thick line.
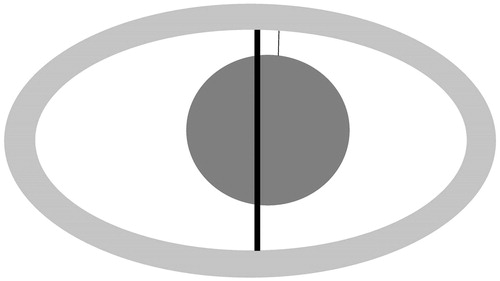
An alternative method of measuring the safety margin was used irrespective of the lesion and PR conspicuity: based on the assumption of an antenna placed in the middle of the tumour, the safety margin was calculated as the difference between the maximum diameter of the tumour as measured on the pre-interventional CT and the short-axis diameter of the ellipsoidal ablation zone which was then divided by two (). The alternative measurement method was used for all three groups.
The direct and indirect measured safety margins were compared to each other using the Friedman test (indirect measurement) and Mann–Whitney tests (direct measurement) as the direct measurement was not possible in all cases impeding general intra-individual comparison.
Diagnostic performance
The ability to predict LTP based on the width of the safety margin was investigated using receiver operating characteristic (ROC) curves. The area under the curve (AUC) was calculated for both the direct and indirect measurements of the safety margin with the purpose of quantifying the accuracy of each test. The ROC analysis allowed the selection of safety margin cut-off values that can predict the occurrence of LTP. Larger sensitivity values were chosen (>80%), as the detection of a higher number of local progressions is the priority of the follow-up.
Complications
The following typical complications were evaluated independently on both CT and MR sequences: pneumothorax, pleural effusion and haemorrhage. On MRI, a pneumothorax was considered when a completely signal-free area was noticed on the periphery of the lung on all sequences. Fisher’s exact test was used to determine the sensitivity and specificity of MRI in detecting a pneumothorax by using the post-interventional CT as the gold standard. Post-interventional pleural effusions were recorded on CT or T2 sequences if they were larger than 0.5 cm. Soft tissue damage was assessed only on T2 sequences and was considered if any signal increase was noticed in the area surrounding the puncture tract. Depending on its extent, soft tissue damage was scored as absent, minimal, medium or severe.
Statistical analysis
The statistical analysis was performed using GraphPad Prism version 6 (GraphPad Software, La Jolla, CA). The statistical tests that were used have been described with each subsection. The results were considered statistically significant for p < 0.05.
Results
Aspect of the ablation zone
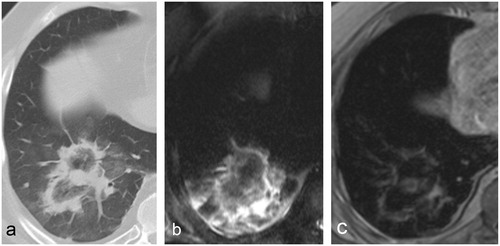
MRI revealed a peripheral ring-like enhancement pattern on ceT1 images whereas the inner zone was isointense and showed no enhancement. In some cases, on precontrast T1 images a patchy hyperintense area could be seen inside and/or surrounding the ablation zone most likely corresponding to ablation-related haemorrhage. The tumour usually had the same size and shape as on the pre-ablation CT and had the same intensity on both unenhanced and enhanced T1 sequences. Larger tumours were generally easier to distinguish within the ablation zone. No contrast enhancement was noticed within the ablated tumour, even when in close contact to the PR. The predominant finding in T2 images was an inner zone with inhomogeneous intensity surrounded by a strongly hyperintense outer rim. In the case of larger ablations, the inner zone consisted of a succession of hypo- and hyper-intense rings with a target-like pattern. In most cases, the tumour could not be identified within the ablation zone on this sequence ().
Figure 3. Typical 24-h post-MWA aspect of a colorectal cancer metastasis in a 60-year-old patient on (a) CT, (b) T2 and (c) ceT1. The treated tumour is clearly visible within the ablation zone both on CT and ceT1 images but not on T2. In this case, the tumour appears in direct contact with the peripheral rim on CT, but a wider safety rim can be noticed on ceT1. No local tumour progression was recorded.
Conspicuity of the ablation zone
The PR could be well visualised on all three imaging modalities, with a low percentage of scores less than 2 (CT: 15.5%; ceT1: 9%; T2: 5.2%). The CT PR conspicuity was worse than ceT1 and T2 but only the difference between T2 and CT was statistically significant. The T2 conspicuity was slightly better than ceT1, but the difference was not statistically significant ().
Table 1. Mean scores and comparisons for margin and tumour conspicuity for CT, T1 and T2.
The visualisation of the tumour within the ablation zone was more problematic on all imaging techniques () with a higher percentage of scores less than 2 (CT: 22.0%; ceT1: 35.0%; T2: 72.7%). The conspicuity of the tumour was significantly worse on T2 compared to ceT1 or CT. The tumour conspicuity score on CT was higher than on ceT1, but the difference was not statistically significant ().
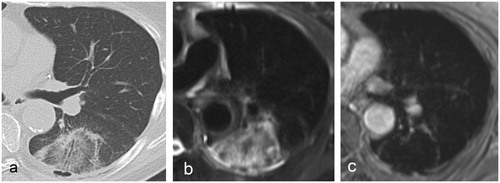
Figure 4. 24-h post-MWA aspect of a colorectal cancer metastasis in a 64-year-old patient on (a) CT, (b) T2 and (c) ceT1. The peripheral rim is visible on both CT an MR images. The ablated tumour cannot be visualised on either image, most likely due to its small size. No local tumour progression was recorded.
Smaller tumour sizes significantly correlated with lower T1 conspicuity scores (r = 0.2; p = 0.04), whereas no significant correlation between the tumour size and the CT conspicuity score was determined (p = 0.13).
Breathing artefacts were recorded on 17 (22.0%) examinations, with 13 (16.8%) being moderate and four (5.1%) being severe. Pulsation artefacts were recorded on five (6.4%) examinations, with two (2.5%) being moderate and three (3.8%) being severe.
There was a statistically significant correlation between the artefact severity and both the ceT1 PR conspicuity (r = 0.55; p < 0.0001) and ceT1 lesion conspicuity (r = 0.22; p = 0.045).
Safety margin
The safety margin could not be directly measured on 24 (31.1%) CT examinations due to the low conspicuity (score <2) of PR in six cases (7.7%), of tumour in 13 cases (16.8%), or both in five cases (6.4%). The safety margin could not be directly measured on 27 (35.0%) ceT1 examinations due to the low conspicuity of the tumour in 20 patients (25.9%) and both tumour and PR in seven patients (9.1%).
The safety margins obtained using the direct and indirect measurement methods are shown in . When directly measured, the CT safety margin was not significantly different from the ceT1 safety margin (p = 0.7). When the indirect method was used, there was no significant difference (p = 0.2) between the safety margins as measured on CT, ceT1 and T2.
Table 2. The average widths of the safety margin as directly measured or calculated using the indirect method.
The difference between the directly measured and the subtracted margin was not statistically significant neither for CT (p = 0.1), nor for ceT1 (p = 0.3). In all cases the safety margin in patients with no LTP was significantly larger than in those with local progression (p < 0.005) ().
Diagnostic performance
The ability to predict LTP was similar among the investigated methods with an improvement when the safety margin could be directly measured (). The AUC had a higher value when the safety margin was directly measured on CT images than when the indirect method was used. Similarly, the direct measurement of the safety margin on ceT1 sequences resulted in a higher AUC value than by using the indirect method for both ceT1 and T2 sequences. The direct measurement of the safety margin on ceT1 sequences has a slightly worse diagnostic performance than the direct measurement on CT acquisitions. The individual AUC values and the proposed cut-off values with their sensitivities and specificities are shown in .
Figure 5. ROC curves depicting diagnostic accuracy for CT and MR. (a) Comparison between direct measurements; (b) comparison between direct and indirect CT measurements; (c) comparison between direct and indirect MR measurements.
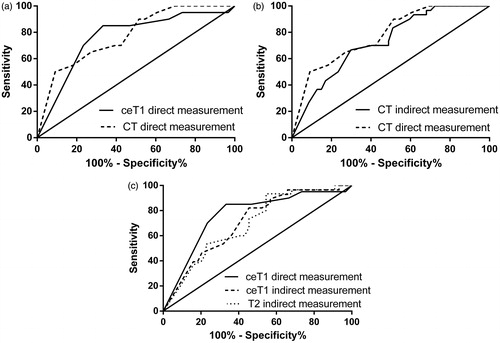
Table 3. The performance of the imaging modalities using direct and indirect measurement methods in predicting LTP.
Complications
On CT, a pneumothorax was detected after 23 (29.8%) ablations, seven (9.0%) being larger than 1 cm. The sensitivity and specificity of MR in detecting a pneumothorax were 60.8% and 87.0%, respectively. All instances of pneumothorax >1cm were correctly diagnosed on MR, with one exception (1.3 cm).
Twenty-five (32.4%) ablations were followed by pleural effusions that were all identified on both CT and MR acquisitions. Following 27 (35.0%) ablations, hyperintense patches surrounding the ablation zone were noticed on unenhanced T1 sequences, corresponding to haemorrhages that had taken place during the ablation. Following 46 (59.7%) ablations, T2 hyperintense areas in the soft tissues adjacent to the ablation area were noticed. In four (5.19%) cases these changes were extensive.
Discussion
In a study analysing the histological and CT changes after lung RFA, Yamamoto et al. described the ablation zone as comprising of three layers within the first week after ablation [Citation17]. The two innermost layers consisted of complete necrosis and corresponded to the relatively hypodense inner ground-glass area seen on CT. The outermost “hemorrhagic” layer corresponded to the hyperdense PR on CT and contained viable tissue [Citation17]. In a similar study, Oyama et al. correlated the T2 and ceT1 hypointense inner area with necrosis and the hyerpintense/enhancing PR with congestive tissue [Citation12]. As the CT and MR appearance described in these studies is very similar to ours, we considered the inner circumference of the PR as the limit between necrotic and viable tissue. Choosing the outer circumference as the demarcation point would have made measurements imprecise when the tumour overlapped with the hyperdense/hyperintense/enhancing PR.
The use of conspicuity scores has shown that for possible reasons such as the small size or complete destruction of the tumour, local haemorrhage, periablational infiltrative reaction or artefacts (the last for MRI only), the direct measurement was possible in 68.8% of cases on CT and 64.9% of cases on ceT1. The conspicuity of the lesion within the ablation zone was the main impediment for direct measurements on both CT and MR images. The tumour could rarely be identified on T2 sequences within the heterogeneous ablation zone; therefore, this sequence has little use in predicting ablation success. On both enhanced and unenhanced T1 sequences, with the exception of the PR which is hyperintense and takes up contrast, the ablation zone has the same signal intensity as the normal lung which enables a good tumour conspicuity, which, together with the enhancing PR made ceT1 the sequence of choice for evaluating the safety margin.
In some cases, ceT1 offered a more precise delineation of the demarcation point compared to CT but generally the safety margins were similar in width between CT and ceT1 when directly measured and for this reason, the performance of the two methods in predicting LTP was also very similar. In the study of Anderson et al. [Citation7] performed on 36 ablations (with 13 cases of LTP), the AUC was 0.868 and a CT cut-off value of 0.45 cm for the safety margin offered a specificity of 100% (no sensitivity value was provided) in predicting LTP. The larger cut-off value proposed is most likely a consequence of the fact that that the safety margin included the whole width of the PR. However, the high AUC value and specificity they calculated do not reflect the findings in our study.
The indirect method is an alternative for estimating the safety margin when the direct measurement is not possible. Although its accuracy relies on the correct placement of the antenna during ablation, this can be easily verified by reviewing the intervention images. The values calculated through this method were larger than those directly measured for both CT and ceT1, but the differences were not statistically significant. As expected, the AUC values for the indirect method were slightly lower, and the required safety margins for equivalent sensitivities, larger. The values obtained through the indirect method should always be interpreted with regard of the antenna location relative to the tumour.
It is worth noting that irrespective of the diagnostic (CT or MRI) or measurement method (direct or indirect) used, tumours with larger safety margins had significantly lower LTP rates. This confirms the importance of careful patient selection (smaller tumours) and adherence to ablation protocols in order to obtain large enough ablation zones.
MRI has a good ability to detect early complications. Large pleural effusions requiring drainage can be easily detected. The relatively low sensitivity in detecting pneumothoraces was caused by their small size as, with one exception, all pneumothoraces larger than 1 cm were correctly identified.
Several limitations of the present study have to be considered. Post-interventional imaging was performed on a daily routine over a period of seven years and both MR scanners and scanning protocols were optimised during that time which might have led to better image quality on later examinations. However, we considered that the variability in image quality was accounted for by using conspicuity scores. As opposed to the T1 sequences, the post-ablation CT examinations were unenhanced; therefore, the full performance of CT remained unexplored. LTP was determined based only on imaging characteristics with no histological confirmation. Despite the minimum follow-up being 12 months, the possibility remains that in some cases LTP could have occurred after this point.
As most of the patients that undergo MWA of lung tumours are treated with a curative intent, the CT follow-up represents a significant radiation burden. The replacement of one or more of these CTs with MRI could represent a significant reduction cumulative dose reduction for these patients. A 24-h MRI seems to have a similar ability as CT to detect complications with the exception of small pneumothoraces where an additional radiography could help. The ability of CT and ceT1 to predict LTP based on the extent of the safety margin is also very similar. Therefore, we consider that when the higher time and resource consumption can be afforded and a reduction in radiation burden is intended, or the patient demands it, a 24 h post-ablation CT can be replaced by an MR examination including ceT1 sequences. A MRI could also be performed in addition to the CT, when it is inconclusive due to the low conspicuity of the ablation zone. Our experience shows that with recent advances in MR technology, prospective studies investigating the predictive performance of post-ablation lung MRI or even a MR follow-up of lung MWA might be feasible.
Disclosure statement
No potential conflict of interest was reported by the authors.
References
- Han X, Yang X, Ye X, et al. (2015). Computed tomography-guided percutaneous microwave ablation of patients 75 years of age and older with early-stage nonsmall cell lung cancer. Indian J Cancer 52:e56–60.
- Vogl TJ, Worst TS, Naguib NNN, et al. (2013). Factors influencing local tumor control in patients with neoplastic pulmonary nodules treated with microwave ablation: a risk-factor analysis. Am J Roentgenol 200:665–72.
- Sun YH, Song PY, Guo Y, et al. (2015). Computed tomography-guided percutaneous microwave ablation therapy for lung cancer. Genet Mol Res 14:4858–64.
- Pereira PL, Masala S, Salvatore M, et al. (2012). Standards of practice: guidelines for thermal ablation of primary and secondary lung tumors. Cardiovasc Intervent Radiol 35:247–54.
- Liu B-D, Zhi X-Y. (2015). Expert consensus on image-guided radiofrequency ablation of pulmonary tumors-2015 edition. Trans Lung Cancer Res 4:310–21.
- Smith SL, Jennings PE. (2015). Lung radiofrequency and microwave ablation: a review of indications, techniques and post-procedural imaging appearances. Br J Radiol. 88:20140598.
- Anderson EM, Lees WR, Gillams AR. (2009). Early indicators of treatment success after percutaneous radiofrequency of pulmonary tumors. Cardiovasc Intervent Radiol 32:478–83.
- Lee JM, Jin GY, Goldberg SN, et al. (2004). Percutaneous radiofrequency ablation for inoperable non-small cell lung cancer and metastases: preliminary report. Radiology 230:125–34.
- Baère T, de, Palussière J, Aupérin A, et al. (2006). Midterm local efficacy and survival after radiofrequency ablation of lung tumors with minimum follow-up of 1 year: prospective evaluation 1. Radiology 240:587–96.
- Abtin FG, Eradat J, Gutierrez AJ, et al. (2012). Radiofrequency ablation of lung tumors: imaging features of the postablation zone. Radiographics 32:947–69.
- Chheang S, Abtin F, Guteirrez A, et al. (2013). Imaging features following thermal ablation of lung malignancies. Semin Intervent Radiol 30:157–68.
- Oyama Y, Nakamura K, Matsuoka T, et al. (2005). Radiofrequency ablated lesion in the normal porcine lung: long-term follow-up with MRI and pathology. Cardiovasc Intervent Radiol 28:346–53.
- Wacker FK, Nour SG, Eisenberg R, et al. (2004). MRI-guided radiofrequency thermal ablation of normal lung tissue: in vivo study in a rabbit model. Am J Roentgenol 183:599–603.
- Miao Y, Ni Y, Bosmans H, et al. (2001). Radiofrequency ablation for eradication of pulmonary tumor in rabbits. J Surg Res 99:265–71.
- Biederer J, Ohno Y, Hatabu H, et al. (2017). Screening for lung cancer: does MRI have a role? Eur J Radiol 86:353–60.
- Patel IJ, Davidson JC, Nikolic B, et al. (2012). Consensus guidelines for periprocedural management of coagulation status and hemostasis risk in percutaneous image-guided interventions. J Vasc Interv Radiol 23:727–36.
- Yamamoto A, Nakamura K, Matsuoka T, et al. (2005). Radiofrequency ablation in a porcine lung model: correlation between CT and histopathologic findings. Am J Roentgenol. 185:1299–306.