
Abstract
Purpose: Current release assays have inadequate temporal resolution ( ∼ 10 s) to characterise temperature sensitive liposomes (TSL) designed for intravascular triggered drug release, where release within the first few seconds is relevant for drug delivery.
Materials and methods: We developed a novel release assay based on a millifluidic device. A 500 µm capillary tube was heated by a temperature-controlled Peltier element. A TSL solution encapsulating a fluorescent compound was pumped through the tube, producing a fluorescence gradient along the tube due to TSL release. Release kinetics were measured by analysing fluorescence images of the tube. We measured three TSL formulations: traditional TSL (DPPC:DSPC:DSPE-PEF2000,80:15:5), MSPC-LTSL (DPPC:MSPC:DSPE-PEG2000,85:10:5) and MPPC-LTSL (DPPC:MMPC:PEF2000,86:10:4). TSL were loaded with either carboxyfluorescein (CF), Calcein, tetramethylrhodamine (TMR) or doxorubicin (Dox). TSL were diluted in one of the four buffers: phosphate buffered saline (PBS), 10% bovine serum albumin (BSA) solution, foetal bovine serum (FBS) or human plasma. Release was measured between 37–45 °C.
Results: The millifluidic device allowed measurement of release kinetics within the first few seconds at ∼5 ms temporal resolution. Dox had the fastest release and highest release %, followed by CF, Calcein and TMR. Of the four buffers, release was fastest in human plasma, followed by FBS, BSA and PBS.
Conclusions: The millifluidic device allows measurement of TSL release at unprecedented temporal resolution, thus allowing adequate characterisation of TSL release at time scales relevant for intravascular triggered drug release. The type of buffer and encapsulated compound significantly affect release kinetics and need to be considered when designing and evaluating novel TSL-drug combinations.
Introduction
Temperature sensitive liposomes (TSL) are a promising drug delivery system for enhancing delivery of chemotherapy to solid tumours. When exposed to temperatures at or above the lipid solid-to-liquid phase transition temperature (typically above 40 °C), pores are thought to form in the lipid membrane triggering release of the encapsulated drug [Citation1–5]. As such, administration of TSL in combination with applied mild hyperthermia to the tumour results in tumour- localised drug delivery. This treatment strategy has been shown to result in substantial reductions in tumour volume compared to conventional chemotherapy or non-thermally sensitive liposomes [Citation3,Citation6–8]. TSL encapsulating the chemotherapy agent doxorubicin (Dox) are currently being investigated in a Phase III clinical trial in combination with radiofrequency ablation for treatment of hepatocellular carcinoma (HCC) [Citation9].
Recent studies demonstrate that intravascular triggered drug release is the dominant delivery mechanism for recent fast-release TSL formulations [Citation5,Citation10–12]. In this paradigm, TSL release the contained drug during transit through the microvasculature of the heated region. This intravascular triggered release mechanism is most effective if the majority of the drug is released from TSL during transit of the heated target region (transit time) where release and drug uptake takes place. Since mean transit times for most tumours are in the range of a few seconds, comprehensive evaluation of drug release from TSL formulations requires measurements at much shorter heating times than reported in prior studies [Citation5,Citation13–16]. In addition, the influence of buffer, temperature, flow rate, drug loading and liposomal formulation on drug release has never been extensively studied on very short time scales.
The objective of this study was to develop a novel millifluidics-based release assay to quantify content release of liposomes triggered by mild HT at very high temporal resolution ( ≪1 s). Using this assay the effects of buffer solution, flow rate, carrier and lipid composition were quantified.
Materials and methods
Liposome preparation and characterisation
Liposome fabrication: The three formulations used in this study were traditional TSL (DPPC: DSPC: DSPE-PEF2000, 80:15:5), MSPC-LTSL (DPPC:MSPC:DSPE-PEG2000, 85:10:5), and MPPC-LTSL (DPPC:MMPC:PEF2000, 86:10:4), all in mole ratio. All formulations were fabricated into liposomes by lipid film hydration and extrusion at 55 °C as described previously [Citation15]. Quenched carboxyfluorescein (CF, 100 mM), Calcein (100 mM) or tetramethylrhodamine (TMR, 100 mM) at pH 7.4 was encapsulated in the aqueous phase. Unencapsulated dye was removed by gel filtration through PD-10 columns (GE Healthcare, Buckinghamshire, UK). Dox was actively loaded into liposomes using a pH gradient [Citation15]. Size and polydispersity index (PDI) were determined by dynamic light scattering using a Zetasizer Nano ZS (Malvern Instruments, Worcestershire, UK).
Millifluidics heating device
A custom microcopy stage to encase the millifluidics heating device was designed in AutoCAD and fabricated using a 3 D printer (uPrint Plus, Stratasys inc., Minneapolis, MN). The device () consisted of a quartz capillary tube (inner and outer diameters were 500 and 520 μm, respectively) anchored on top of two Peltier heating elements (Velleman, Peltier Thermo-Electric Cooling Module 6 Amp, Springboro, OH) and attached via tubing to an automated precision syringe pump (PhD Ultra, Harvard Apparatus, Holliston, MA). Temperature control was achieved via feedback based on thermocouple temperature readings (HYP0–33-1-T-G-60-SMP-M, Omega, Norwalk, CT, accuracy ±0.5 °C) and a programmable power supply (E3648A 100 W Dual Output Power Supply, Agilent Technologies, Palo Alto, CA). A temperature control algo-rithm was implemented using LabView software (National Instruments, Austin, TX) that regulated power output to the Peltier elements to keep them at the desired target temperature. The first Peltier element maintained the temperature of a water reservoir at 36.5 ± 0.5 °C (mean ± standard deviation (SD)), measured point-by-point at multiple locations within the reservoir via a thermocouple (same type as above). The reservoir preheated the buffer-liposome solution. A thin copper layer (6 mm) was secured on top of the second Peltier element to ensure uniform surface temperature. Point measurements made throughout the surface of the second element demonstrated ± 2 °C variability without copper layer compared to ±0.5 °C with copper layer. The second Peltier element for heating the capillary tube was set to between 37.0–45.0 ± 0.1 °C (mean ± SD, confirmed by measurements at 20 locations along the capillary tube with a thermocouple inserted into the tube). In addition, a small water reservoir filled with degassed deionised water and sealed with a glass cover slip was positioned on top of the second Peltier element to further ensure a uniform temperature distribution. Feedback needle thermocouples were positioned in the water reservoir and inside of the quartz tube 8 mm from the outflow. Temperature accuracy of the thermocouples was quantified by direct comparison to a spirit-filled thermometer having ± 0.5 °C accuracy (Thermco Precision, Thermco Products, Lafayette, NJ). Both thermocouple and thermometer were placed in proximity in a heated water bath and allowed to equilibrate at a stable temperature in the range of 37–46 °C. Thermocouple temperature was measured over 20 s (three samples/s) and temperature deviation from the spirit-filled thermometer temperature, averaged over all examined temperatures (38, 39, 40, 42, 44 and 46 °C) was 0.58 ± 0.05 °C (range 0.18 – 0.83 °C).
Liposomes loaded with either DOX, CF, Calcein or TMR diluted in buffer (phosphate buffered saline (PBS), 10% bovine serum albumin (BSA) solution, foetal bovine serum (FBS) or human plasma) were infused through the above described millifluidics system at a flow rate of 117.5 , 29.4 or 11.8 µl/min via a precision pump resulting in flow velocities of 10, 2.5 and 1 mm/s through the capillary tube, respectively. Flow velocities were calculated from pump flow rates (pump accuracy is ±0.25%) and capillary diameter. These flow velocities correspond to laminar flow within the tube (Reynolds numbers between 0.05 @ v = 1 mm/s and 0.5 @ v = 10 mm/s).
Fluorescence microscopy
Fluorescence microscopy was performed using an upright microscope (Zeiss, Axio Imager.M1, Thornwood, NY) equipped with a colour CCD camera, motorised stage, and stitching software (Axiovision, Zeiss).
The millifluidics device was placed on the microscope stage and the microscope lens was lowered onto the cover slip sealing the heating chamber containing the capillary tube submerged in degassed water. Fluorescence imaging was performed using a 5x objective lens with appropriate excitation light (ex), emission filters (em) and exposure time (t): DOX (ex: 650 nm, em: 673 nm, t = 1600 ms), CF (ex:500 nm, em:520 nm, t = 56 ms), Calcein (ex:495 nm, em:519 nm, t = 28 ms) or TMR (ex:558 nm, em:575 nm, t = 190 ms). We confirmed a uniform illumination profile indicated by the absence of a longitudinal fluorescence intensity gradient along the capillary tube filled with unencapsulated dye in the absence of flow.
Millifluidics release assay
As TSL solution flows through the capillary tube at a constant velocity, the TSL start releasing their content (fluorescent dye or drug) once the solution reaches the threshold temperature for release. Since fluorescence is quenched when the dye/drug is encapsulated by the liposome, release could be detected by an increase in fluorescence along the tube length. Drug release from TSL was determined using images captured of the capillary tube and evaluating the fluorescence intensity with respect to distance from entry into the heated region. A calibration was performed in order to account for the time to reach equilibrium temperature in the heated chamber. Briefly, the temperature along the length of the capillary tube was determined via point measurements with a needle thermocouple as well as with the temperature-sensitive fluorescent dye Sulforhodamine B (SRB, 50 mM), similar to prior studies demonstrating temperature measurements in microchannels with this dye [Citation17]. For point measurements a third thermocouple was inserted inside the quartz tube at the influx. Under flow, the thermocouple was moved sequentially along the axis of the heated tube in a stepwise manner. At each position the capillary tube was imaged and the thermocouple sampling position was determined. The temperature at each position was averaged over 20 s. SRB fluorescence was used for validation of thermocouple temperature measurements. Calibration curves relating temperature to SRB fluorescence intensity were determined under conditions of feedback controlled heating (25–50 °C) without flow.
Liposomal formulations were diluted in four different release buffers: phosphate buffered saline (PBS), 10% bovine serum albumin (BSA) solution, foetal bovine serum (FBS) or human plasma. Percent release was calculated by assuming 100% release based on fluorescence of free (unencapsulated) dye/drug solution and 0% release based on TSL at 25 °C in the selected buffer. Calculations as well as fitting of the data to a single exponential model was performed using EquationEquation (1)(1) to obtain rate constant (k) estimates, as reported previously [Citation15].
(1)
where Maxrel(%) is the maximum release, and k (s− 1) is the release rate constant.
All data are presented as the mean (n = 3). Images of the capillary tube at various flow rates and target temperatures were acquired and fluorescence intensity along the length of the tube, averaged across the tube diameter, was converted to % release. Based on the known flow velocity, the distance along the tube was converted to time and data plotted as % release vs. time.
Since we assumed constant flow velocity in our analysis, variation of velocity across the tube diameter may increase systemic error. To ensure that velocity variation across the diameter does not cause errors, we performed an additional experiment, examining any radial variations in arrival time. We placed the device inside a fluorescence imaging system (Maestro, Caliper Life Sciences, Los Angeles, CA) and pumped unencapsulated SRB dye in PBS buffer at 2.5 mm/s through the capillary tube. We obtained an image with 455 nm excitation light, 500 nm emission filter and 16 ms exposure time after the fluid reached the last quarter of the tube (i.e. with fully developed flow). demonstrates negligible difference in arrival time across the tube diameter, confirming that averaging across the diameter is appropriate
Figure 1. Schematics of experimental setup for millifluidic release assay. A TSL solution (TSL + buffer) is pumped through a capillary tube. The tube is heated to the desired temperature by a temperature controlled Peltier element. Once the TSL solution enters the heated region, TSL release the fluorescent drug/dye, resulting in a fluorescence gradient along the tube (upper graph). The Peltier temperature is measured by a thermocouple and a control algorithm regulates the power applied to the Peltier element to control temperature.
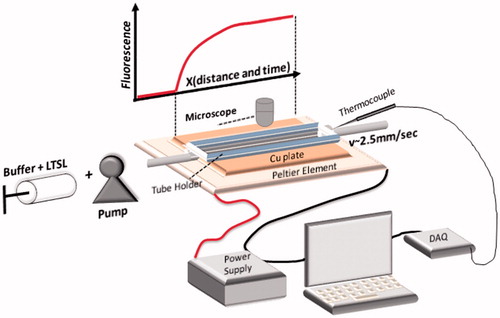
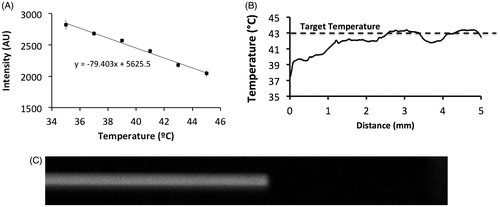
Figure 2. Calibration plot for converting SRB fluorescence intensity to temperature (A). Unencapsulated dye was pumped through the capillary tube which was heated to 43 °C. Temperature along the tube distance was calculated based on the calibration plot (B). Fluid entering the capillary tube reached the target temperature within ∼3 mm, corresponding to ∼0.3 s (flow velocity =10 mm/s). Fluorescence image of SRB pumped through the tube at 2.5 mm/s @ 16 ms exposure time, demonstrating no detectable variation in arrival time across the tube diameter (C).
Photobleaching is another possible error source, but typically requires exposure of many minutes [Citation17]; for comparison, we had single exposures of each sample between 28–1600 ms. We confirmed absence of photobleaching by pumping unencapsulated Dox (having the largest exposure duration of 1600 ms) into the tube, turning off the pump and imaging 20 times at 1600 ms exposure time. We did not observe any reduction in fluorescence, demonstrating absence of photobleaching.
Comparison to traditional release assay
In addition to the millifluidics assay analyses, drug release was measured using the traditional release assay [Citation15] (referred to subsequently as “cuvette method”), whereby a Cary Eclipse spectro-fluorimeter equipped with an Eclipse multicell Peltier temperature controller was employed. A cuvette with 2 ml of buffer solution was heated to the desired target temperature (37–45 °C). Subsequently, 30 µL of TSL stock solution was added to the cuvette while stirring and measuring fluorescence every 7.4 s. Release % was calculated from change in fluorescence intensity as described above. The measurements with the traditional assay were performed on the same day as those with the millifluidics based assay, with the same plasma/buffer and the same liposome preparations.
Statistical analysis
Drug release from TSL in each buffer was calculated at six temperatures: 37, 39, 41, 42, 43 and 45 °C, in three replicates. For each replicate, temperature was ramped up and down after the measurement. Then, the device was flushed with buffer before the next repetition. The percent release was calculated and averaged over the three trials. In addition, we calculated the coefficient of variation (CV = SD/mean) among the three trials; CV averaged over the data of each individual dataset was in the range of 0.9 to 6.4%.
Results
Temperature calibration of flowing solution
For system calibration, Sulforhoadamine B (SRB) dye fluorescence intensity was correlated with temperature by heating capillary tubes containing SRB over a range of temperatures (25–45 °C). Normalised SRB fluorescence intensity was plotted as a function of temperature in . While prior studies used higher-order polynomials [Citation17], due to our narrow temperature range a first-order approximation was adequate (see equation in ). These calibration data were used to determine the temperature along the length of the capillary tube under flow to validate that heating of the fluid occurred sufficiently quickly. In addition, these results were compared to temperature measurements acquired by passing a needle thermocouple step-wise through the capillary tube.
The thermal equilibrium time (i.e. time it takes for buffer to equilibrate with the Peltier element temperature after entering the heated capillary tube region) for the quartz capillary tube with inner and outer diameter of 500 and 520 µm was calculated at ∼0.3 s at a flow rate of 117.5 µl/min ( ≅ 10 mm/s) ().
Effect of flow rate on release dynamics
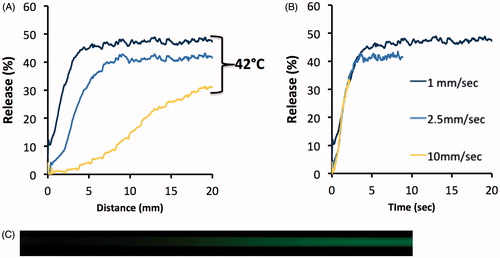
To confirm that the assay produced equivalent results independent of flow rate, we performed experiments at varying flow velocities of 1, 2.5 and 10 mm/s while passing CF-loaded TSL through the tube at 42 °C. shows % release as a function of distance along the tube, and as a function of time (after conversion of distance to time). As expected, the measured liposomal release rate was independent of flow rate through the capillary tube. Thus, altering the flow velocity allows for modification of the temporal resolution and measurement duration of the release assay.
Figure 3. Release of CF from TSL along tube distance, for three different flow velocities (A). Percent release vs. time is independent of flow velocity (B). A sample microscope image demonstrating the fluorescence gradient along the tube resulting from TSL releasing CF (C).
Comparison of millifluidic assay to traditional assay
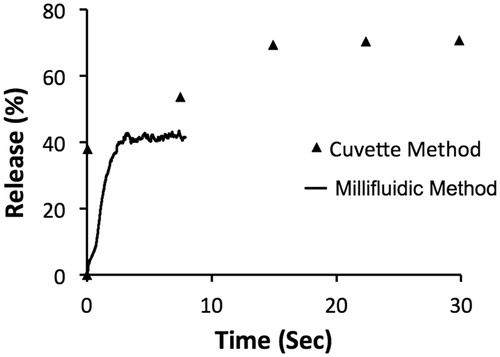
Differences in temporal resolution between the traditional “cuvette method” and the novel “millifluidic method” release assays are demonstrated in . MSPC-LTSL loaded with CF were heated to 42 °C while measuring release using each assay.
Figure 4. Release of CF from MSPC-LTSL at 42 °C. Percent CF release over 30 s is plotted comparing the traditional cuvette method – whereby a single data point is acquired every 8 s – to the novel millifluidic method whereby release data is acquired continuously. Data plots represent the mean of three experiments.
Effect of loaded drug/dye on release from TSL
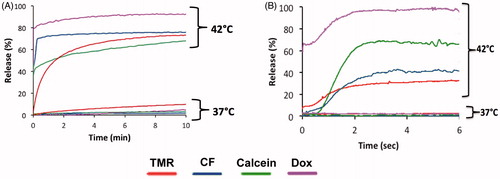
Four different drugs/dyes including TMR, CF, Calcein, and DOX were loaded in MSPC-LTSL in order to evaluate the influence of the encapsulated agent on the rate of release. The rate of release was determined at 42 °C using the millifluidic and conventional cuvette methods described above. Release rates were fastest for Dox, followed in order by Calcein, CF and TMR. Nearly 100% of Dox was released from TSL, the most of all the compounds. Release after 6 s measured using the millifluidic method was highest for Dox, followed by Calcein, CF and TMR. After 10 min (measured with the cuvette method), release was highest for Dox, followed by CF, TMR and Calcein. Thus, maximum release at long time scales was not predictive of TSL release at short duration. For example, while Calcein had greater release initially compared to CF (), CF was released at a higher percentage over longer duration (). Average SD at 37 °C was 1.0%(TMR), 0.1%(CF), 0.7%(Calcein) and 0.3%(Dox); average SD at 42 °C was 1.2%(TMR), 1.8%(CF), 1.8%(Calcein) and 3.7%(Dox).
Figure 5. Release of four compounds from MSPC-LTSL at 37 and 42 °C was measured with the traditional cuvette method over 10 min (A) and with our millifluidic device over 6 s (B).
Effect of buffer on release
This experiment was performed to demonstrate the effect of different buffer solutions on the release of CF from MSPC-LTSL. shows the complete release data for all temperatures for each of the buffers. Average SD at 37 °C was 0.1%(PBS), 0.5%(BSA), 0.2%(FBS) and 0.1%(Plasma); average SD at 45 °C was 0.1%(PBS), 0.9%(BSA), 0.6%(FBS) and 1.5%(Plasma). shows compiled release data at 42 °C to allow direct comparison of the effect of the buffers. Results for both the traditional cuvette and millifluidic methods are shown. In addition, in we report parameter values of fitting these data to an exponential equation using EquationEquation (1)(1)
Figure 6. Release of carboxyfluorescein from MSPC-LTSL at various temperatures in different buffers: PBS, 10% BSA solution, FBS or human plasma.
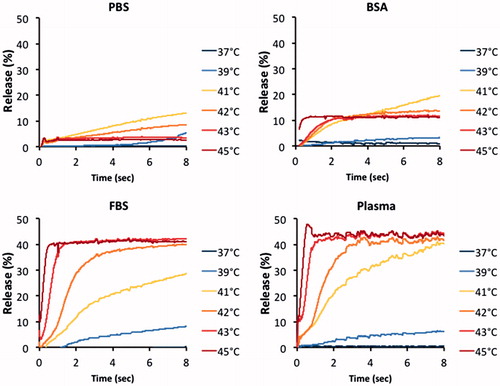
Figure 7. Release of CF from MSPC-LTSL at 42 °C in different buffers: PBS, 10% BSA solution, FBS or human plasma. Results are shown for measurements using the traditional cuvette method over 10 min (A) and using the millifluidic method over 6 s (B).
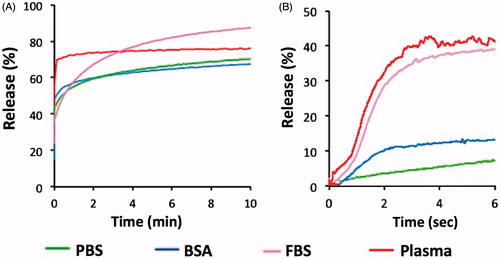
Table 1. Release of carboxyfluorescein from MSPC-LTSL at various temperatures in different buffers (data from ) was fitted to an exponential model. Fitted parameter values are reported in the table. Fitting was not performed for any data at 37 °C or for BSA/PBS at 39 °C, due to inadequate fit (R^2 < 0.3). Fitting was performed based on mean of data in .
Effect of liposomal formulation on release
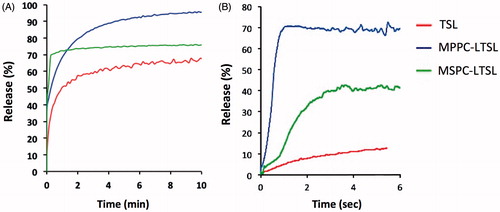
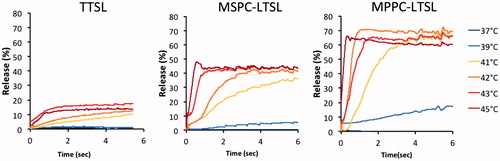
To determine the effects of the liposomal formulation, release was measured for three known TSL formulations loaded with CF using both the traditional cuvette method (over 10 min duration) and the millifluidic method (over 6 s duration), respectively (). The three liposomal formulations were traditional TSL (TTSL), MPPC-LTSL and MSPC-LTSL. Using both measurement methods, the MPPC-LTSL demonstrated the greatest and fastest release overall followed by MSPC-LTSL and TSL. However, the cuvette method suggested that MSPC-LTSL had the greatest initial release while the millifluidic method revealed that release over the first 6 s was fastest from MPPC-LTSL, rather than MSPC-LTSL.
Figure 8. Release of CF at 42 °C from three TSL formulations. Results are shown for measurements using the traditional cuvette method over 10 min (A) and using the millifluidic method over 6 s (B).
Discussion
Various formulations for TSL have been proposed in the past largely with the goal of increasing stability to prolong plasma circulation times [Citation1,Citation2,Citation18–23]. In recent years, new types of TSL were formulated that improved tumour drug delivery, releasing their contents in seconds [Citation6,Citation11,Citation13,Citation14,Citation24]. It has also been established that these newer formulations follow an intravascular drug release paradigm, whereby release from TSL is triggered within the blood during transit of the microvasculature of the heated target region [Citation5,Citation10–12]. Following release, drug extravasates and is taken up by tissue, in contrast to the more traditional drug delivery paradigm of liposome extravasation prior to drug release. Since transit time (i.e. the time it takes for blood to transit the microvasculature of a tissue segment) is in the range of a few seconds for many tumours, characterisation of TSL drug release within the first few seconds of heating is of primary relevance. For example, mean tumour transit times are 1.7 s for primary liver cancer [Citation25], 2.9 s for prostate tumours [Citation26], 3.3 s for head and neck cancer [Citation27], 7.1 s for kidney cancer [Citation28] and 24.7 s for metastatic liver cancer [Citation25]. These values represent tumour means, and transit times often also vary spatially within a tumour [Citation26–29].
TSL release assays described in the literature generally include warming a cuvette filled with buffer (typically ∼1–3 ml) to the desired temperature where release is measured ( ∼ 37–45 °C) and subsequent addition of a small volume ( ∼ 50 µL) of TSL solution under stirring [Citation5,Citation6,Citation13,Citation15,Citation30,Citation31]. Fluorescence of the sample is then measured using a spectrophotometer, and since drug/dye fluorescence is quenched while inside the TSL, release is observed as increasing fluorescence intensity. This approach precludes measurement within the first few seconds because of the time required for complete mixing of the solution after adding of TSL to the cuvette. Thus, the first reported measurement is usually between 8–20 s [Citation5,Citation13–16], which is insufficient to characterise intravascular triggered drug release in vivo, considering the short duration of tumour transit time. In the present work we describe a novel release assay that allows measurement of TSL release kinetics at higher temporal resolution than prior methods, allowing accurate measurement within the first few seconds. The method is based on a millifluidic device comprised of a capillary tube that is heated by a Peltier element (). The TSL solution is pumped through the tube and drug/dye is released resulting in a gradient of fluorescence that is measured using a fluorescence microscope (). By varying the flow velocity inside the tube, the temporal resolution of the resulting data can be adjusted (). This approach achieved a temporal resolution of up to ∼5 ms, an improvement by several orders of magnitude when compared to traditional methods that have temporal resolution of ∼10 s ().
Release kinetics vary depending on the compound encapsulated in a specific TSL, as the encapsulated molecules have varying properties that affect release (e.g. size, molecular weight, charge, hydrophilicity/lipophilicity, etc). We examined and compared the release kinetics (both using a traditional method and the millifluidic device) of four different compounds: Calcein, CF, TMR and Dox. Dox released the fastest from TSL and also had the largest percentage released (). While the traditional method was preferable to monitor the slow leakage at body temperature that happens over minutes, the millifluidic method allowed characterisation of release within the first few seconds.
While TSL drug release is often measured in various buffers (e.g. PBS and FBS), most clinically relevant is the release in human plasma. Importantly, the release profiles differed for each of the four buffers we examined. In particular, release in PBS and BSA was slower and less complete compared to release in FBS and human plasma (). Release was fastest in human plasma, but FBS had roughly similar release kinetics and may thus serve as surrogate for human plasma. Release in serum and plasma are likely higher because of the presence of serum constituents that can affect liposomal release, such as lipoproteins [Citation32].
The optimal release temperature was above ∼41–42 °C for all three TSL formulations (). TTSL only released ∼15% of the contained dye within the first few seconds and are thus not well suited for intravascular triggered delivery, as also suggested by a prior computer modelling study [Citation10]. The release rate in all TSL formulations was very sensitive to small changes in temperature, suggesting accurate control of target region temperature is necessary to obtain optimal results when using these TSL combined with local hyperthermia in vivo. Ideally, temperature should be above 41–42 °C for optimal release. However, maximum temperature should be limited to ∼43–44 °C since reduction in tumour perfusion can occur in tumours at higher temperatures [Citation33], which would limit drug delivery.
Figure 9. Release of (CF at various temperatures from three TSL formulations, measured using the millifluidic method.
In summary, we demonstrated a novel release assay based on a millifluidic device that allows measurement of TSL release at temporal resolution not possible with traditional methods. This approach allows adequate characterisation of TSL release on short time scales that better reflect tumour transit times in vivo. Using the millifluidic device, we demonstrated that the type of buffer (release media) and properties of the encapsulated compound significantly affect release kinetics. These findings could be used to better design and evaluate novel TSL-drug combinations. The millifluidic method may with slight modification also be used to assess other triggered drug delivery systems based on different external stimuli such as ultrasound or alternating magnetic fields. Further, it may be possible to create a microfluidic device that closely mimics tumour microvasculature, while also implementing pulsatile flow conditions to quantify the release kinetics in conditions more accurately representing the in vivo environment.
Disclosure statement
No potential conflict of interest was reported by the authors.
Additional information
Funding
Related Research Data
References
- Yatvin MB, Weinstein JN, Dennis WH, Blumenthal R. (1978). Design of liposomes for enhanced local release of drugs by hyperthermia. Science 202:1290–3.
- Gaber MH, Hong K, Huang SK, Papahadjopoulos D. (1995). Thermosensitive sterically stabilized liposomes: formulation and in vitro studies on mechanism of doxorubicin release by bovine serum and human plasma. Pharm Res12:1407–16.
- Kong G, Anyarambhatla G, Petros WP, et al. (2000). Efficacy of liposomes and hyperthermia in a human tumor xenograft model: importance of triggered drug release. Cancer research 60:6950–7.
- Needham D, Dewhirst MW. (2001). The development and testing of a new temperature-sensitive drug delivery system for the treatment of solid tumors. Adv Drug Deliv Rev 53:285–305.
- Li L, ten Hagen TL, Schipper D, et al. (2010). Triggered content release from optimized stealth thermosensitive liposomes using mild hyperthermia. J Control Release143:274–9.
- Needham D, Anyarambhatla G, Kong G, Dewhirst MW. (2000). A new temperature-sensitive liposome for use with mild hyperthermia: characterization and testing in a human tumor xenograft model. Cancer research 60:1197–201.
- Yarmolenko PS, Zhao Y, Landon C, et al. (2010). Comparative effects of thermosensitive doxorubicin-containing liposomes and hyperthermia in human and murine tumours. Int J Hyperthermia 26:485–98.
- Chelvi TP, Jain SK, Ralhan R. (1995). Hyperthermia-mediated targeted delivery of thermosensitive liposome-encapsulated melphalan in murine tumors. Oncol Res 7:393–8.
- ClinicalTrials.gov Identifier: NCT02112656.(2017). Study of thermo dox with standardized radiofrequency ablation (RFA) for treatment of hepatocellular carcinoma (HCC) (OPTIMA). Available from: https://clinicaltrials.gov/ct2/show/NCT02112656. [cited 2017 August 10]
- Gasselhuber A, Dreher MR, Rattay F, et al. (2012). Comparison of conventional chemotherapy, stealth liposomes and temperature-sensitive liposomes in a mathematical model. PloS one 7:e47453.
- Li L, Ten Hagen TL, Hossann M, et al. (2013). Mild hyperthermia triggered doxorubicin release from optimized stealth thermosensitive liposomes improves intratumoral drug delivery and efficacy. J Control Release 168:142–50.
- Manzoor AA, Lindner LH, Landon CD, et al. (2012). Overcoming limitations in nanoparticle drug delivery: triggered, intravascular release to improve drug penetration into tumors. Cancer Res 72:5566–75.
- Lindner LH, Hossann M, Vogeser M, et al. (2008). Dual role of hexadecylphosphocholine (miltefosine) in thermosensitive liposomes: active ingredient and mediator of drug release. J Control Release 125:112–20.
- Lindner LH, Eichhorn ME, Eibl H, et al. (2004). Novel temperature-sensitive liposomes with prolonged circulation time. Clin Cancer Res 10:2168–78.
- Negussie AH, Yarmolenko PS, Partanen A, et al. (2011). Formulation and characterisation of magnetic resonance imageable thermally sensitive liposomes for use with magnetic resonance-guided high intensity focused ultrasound. Int J Hyperthermia 27:140–55.
- Viglianti BL, Abraham SA, Michelich CR, et al. (2004). In vivo monitoring of tissue pharmacokinetics of liposome/drug using MRI: illustration of targeted delivery. Magn Reson Med 51:1153–62.
- Ross D, Gaitan M, Locascio LE. (2001). Temperature measurement in microfluidic systems using a temperature-dependent fluorescent dye. Anal Chem 73:4117–23.
- Iga K, Hamaguchi N, Igari Y, et al. (1991). Increased tumor cisplatin levels in heated tumors in mice after administration of thermosensitive, large unilamellar vesicles encapsulating cisplatin. J Pharm Sci 80:522–5.
- Maruyama K, Unezaki S, Takahashi N, Iwatsuru M. (1993). Enhanced delivery of doxorubicin to tumor by long-circulating thermosensitive liposomes and local hyperthermia. Biochim Biophys Acta 1149:209–16.
- Merlin JL. (1991). Encapsulation of doxorubicin in thermosensitive small unilamellar vesicle liposomes. Eur J Cancer 27:1026–30.
- Papahadjopoulos D, Jacobson K, Nir S, Isac T. (1973). Phase transitions in phospholipid vesicles. Fluorescence polarization and permeability measurements concerning the effect of temperature and cholesterol. Biochim Biophys Acta 311:330–48.
- Weinstein JN, Magin RL, Yatvin MB, Zaharko DS. (1979). Liposomes and local hyperthermia: selective delivery of methotrexate to heated tumors. Science 204:188–91.
- Unezaki S, Maruyama K, Takahashi N, et al. (1994). Enhanced delivery and antitumor activity of doxorubicin using long-circulating thermosensitive liposomes containing amphipathic polyethylene glycol in combination with local hyperthermia. Pharm Res 11:1180–5.
- Kneidl B, Peller M, Winter G, et al. (2014). Thermosensitive liposomal drug delivery systems: state of the art review. Int J Nanomedicine 9:4387–98.
- Abdullah SS, Pialat JB, Wiart M, et al. (2008). Characterization of hepatocellular carcinoma and colorectal liver metastasis by means of perfusion MRI. J Magn Reson Imaging 28:390–5.
- Ludemann L, Prochnow D, Rohlfing T, et al. (2009). Simultaneous quantification of perfusion and permeability in the prostate using dynamic contrast-enhanced magnetic resonance imaging with an inversion-prepared dual-contrast sequence. Ann Biomed Eng 37:749–62.
- Rumboldt Z, Al-Okaili R, Deveikis JP. (2005). Perfusion CT for head and neck tumors: pilot study. Am J Neuroradiol 26:1178–85.
- Chen Y, Zhang J, Dai J, et al. (2010). Angiogenesis of renal cell carcinoma: perfusion CT findings. Abdom Imaging 35:622–8.
- Tsushima Y, Funabasama S, Aoki J, et al. (2004). Quantitative perfusion map of malignant liver tumors, created from dynamic computed tomography data. Acad Radiol 11:215–23.
- de Smet M, Heijman E, Langereis S, et al. (2011). Magnetic resonance imaging of high intensity focused ultrasound mediated drug delivery from temperature-sensitive liposomes: an in vivo proof-of-concept study. J Control Release 150:102–10.
- Hossann M, Wiggenhorn M, Schwerdt A, et al. (2007). In vitro stability and content release properties of phosphatidylglyceroglycerol containing thermosensitive liposomes. Biochim Biophys Acta 1768:2491–9.
- Allen TM. (1981). A study of phospholipid interactions between high-density lipoproteins and small unilamellar vesicles. Biochim Biophys Acta 640:385–97.
- Rossmann C, Haemmerich D. (2014). Review of temperature dependence of thermal properties, dielectric properties, and perfusion of biological tissues at hyperthermic and ablation temperatures. Crit Rev Biomed Eng 42:467–92.