
Abstract
Purpose: Since mild hyperthermia therapy (MHT) requires maintaining the temperature within a narrow window (e.g. 40–43 °C) for an extended duration (up to 1 h), accurate and precise temperature measurements are essential for ensuring safe and effective treatment. This study evaluated the precision and accuracy of MR thermometry in healthy volunteers at different anatomical sites for long scan times.
Methods: A proton resonance frequency shift method was used for MR thermometry. Eight volunteers were subjected to a 5-min scanning protocol, targeting chest wall, bladder wall, and leg muscles. Six volunteers were subjected to a 30-min scanning protocol and three volunteers were subjected to a 60-min scanning protocol, both targeting the leg muscles. The precision and accuracy of the MR thermometry were quantified. Both the mean precision and accuracy <1 °C were used as criteria for acceptable thermometry.
Results: Drift-corrected MR thermometry measurements based on 5-min scans of the chest wall, bladder wall, and leg muscles had accuracies of 1.41 ± 0.65, 1.86 ± 1.20, and 0.34 ± 0.44 °C, and precisions of 2.30 ± 1.21, 1.64 ± 0.56, and 0.48 ± 0.05 °C, respectively. Measurements based on 30-min scans of the leg muscles had accuracy and precision of 0.56 ± 0.05 °C and 0.42 ± 0.50 °C, respectively, while the 60-min scans had accuracy and precision of 0.49 ± 0.03 °C and 0.56 ± 0.05 °C, respectively.
Conclusions: Respiration, cardiac, and digestive-related motion pose challenges to MR thermometry of the chest wall and bladder wall. The leg muscles had satisfactory temperature accuracy and precision per the chosen criteria. These results indicate that extremity locations may be preferable targets for MR-guided MHT using the existing MR thermometry technique.
Introduction
Mild hyperthermia therapy (MHT) can selectively heat up tumours to, e.g. 40–43 °C, and maintain the temperature for an extended period of time (up to 1 h) [Citation1,Citation2]. Thermal ablation rapidly heats up cancerous tissue to temperatures (>60 °C) sufficient for coagulative necrosis [Citation3]. In contrast, MHT is not intended to directly produce substantial cell death [Citation4]. Instead, MHT induces vascular effects (e.g. increased blood flow, increased vascular permeability, and enhanced reoxygenation) and cellular effects (e.g. inhibition of DNA repair, cell-cycle blockage, and inhibition of tumour vascular endothelial growth factor) to produce therapeutic synergy with radiotherapy and/or chemotherapy [Citation5]. MHT has been used in the clinic as an effective adjuvant for radiotherapy and chemotherapy of a wide range of cancers, such as cancers of the head and neck, breast, bladder, cervix, rectum, and soft-tissue sarcomas [Citation6,Citation7]. Several MHT technologies have been developed in the past few decades based on a number of energy delivery techniques, including microwave, radiofrequency, laser, and ultrasound [Citation5]. Recently, magnetic resonance imaging-guided high-intensity focussed ultrasound (MR-HIFU), used primarily as a thermal ablation technique, has demonstrated the potential for local, targeted MHT [Citation4]. MR-HIFU employs focussed ultrasound for non-invasive, localised heating of tumours to a predefined temperature range under the guidance of MR thermometry.
MHT is often integrated with real-time temperature monitoring technique to ensure safe and effective treatment. Traditionally, MHT has been performed under the guidance of temperature measurements using implanted thermometers. The limitations of invasive thermometry techniques have been well recognised: (i) temperatures can only be measured at the thermometer tips; (ii) prohibiting precise estimation of spatial temperature distribution in an entire tumour volume with heterogeneous blood flow and energy absorption [Citation8]; (iii) the invasive thermometry has a low-tolerance rate in patients as well as low-adoption rate for physicians, due to possible complications such as haemorrhage and infections [Citation9]. Several non-invasive, real-time temperature imaging techniques have been developed, including ultrasound [Citation8], photoacoustic [Citation10], CT [Citation11], and MRI [Citation12]. However, MR thermometry is currently the only clinically available technique for non-invasive, non-ionizing, real-time, volumetric, and quantitative temperature measurements [Citation12]. The most reliable and commonly used MR thermometry method is based on temperature sensitive proton resonance frequency shift (PRFS) [Citation13]. This method has been implemented in MRI for the construction of temperature maps using a gradient echo sequence by measuring the phase differences of images acquired during heating relative to reference images obtained before heating [Citation14]. This temperature monitoring technique enables dynamic spatiotemporal feedback for controlling MHT heating devices to improve heating uniformity and patient safety. This technique also provides volumetric thermal dosimetry for subsequent correlation with clinical response [Citation15,Citation16]. Since MHT requires maintaining the temperature at an elevated level within a narrow window for a long duration, accurate and precise thermometry is one of the critical technical challenges for providing feedback control of the treatment and ensuring safe and effective treatment. For MHT within the narrow temperature window of 40–43 °C, the desired temperature accuracy and precision are considered to be <1 °C [Citation17,Citation18]. It is worth noting that these criteria are application-specific, depending on the target hyperthermia temperature range and how MHT is intended to be used.
The accuracy and precision of MR thermometry have been evaluated in the past in a limited manner. The accuracy of MR thermometry has been evaluated with direct temperature measurements using MRI compatible fibre-optic thermometers in phantom, as well as in ex vivo and in vivo tissue [Citation19]. However, no previous study has reported MR thermometry performance comparison at different anatomic sites for long-scan durations (up to 1 h) relevant to MHT. Recently, Chu et al. [Citation2] assessed the precision and stability of MR thermometry without HIFU heating in volunteers with recurrent rectal cancer for scan times ranging from 5.3 to 29 min. They found the MR thermometry precision and stability to be 7.8 ± 7.8 °C and 2.3 ± 2.0 °C without rectal filling by saline, but reduced to 1.1 ± 0.4 °C and 0.7 ± 2.0 °C when the rectum was filled with saline to minimise motion artefacts.
The objective of this study was to evaluate the precision and accuracy of MR thermometry in healthy volunteers at three representative anatomical sites (chest wall, bladder wall, and leg muscles) for different scanning durations (5 min, 30 min, and 60 min) and to identify challenges associated with MR thermometry for MHT monitoring. These three sites were selected to represent distinct parts of the human body. Moreover, MHT has been used in the clinic as an effective adjuvant for the treatment of diseases at these sites [Citation7]. The selection of the three anatomical sites was not intended to be inclusive. MR thermometry accuracy and precision were quantified, and anatomical sites with both mean temperature accuracy and precision <1 °C were identified as preferable for MR-guided MHT [Citation17].
Materials and methods
Volunteer selection
The assessment of MR thermometry on healthy volunteers was conducted with the approval of the Washington University in Saint Louis Institutional Review Board. In total, 17 volunteers (11 males and 6 females, aged 20–50 y) participated in the study. Volunteer information is provided in .
Table 1. A summary of volunteer information, anatomical sites selected for MR thermometry (number of scans at each site in brackets), and thermometry duration.
MR-HIFU system and volunteer positioning
A clinical MR-HIFU system (Sonalleve V2, Profound Medical Inc., Mississauga, Canada) was used for real-time MR thermometry without HIFU sonication. The HIFU transducer and other hardware were deactivated throughout this study. The patient table with an integrated two-channel RF receive coil was locked into the bore of a clinical MRI scanner (Ingenia 1.5 T, Philips, Best, the Netherlands).
The volunteers were positioned on the HIFU tabletop in the prone position for chest wall and bladder wall scans and in the supine position for leg muscle scans. The targeted anatomy was centred above the tabletop acoustic window, and a three-channel pelvis RF receive coil was secured over the targeted anatomy. Blankets were placed over the volunteers’ bodies to keep the volunteers comfortable.
MR thermometry image acquisition
All volunteers received an MR exam for planning and MR thermometry for thermal mapping.
For planning, T2-weighted MR images were acquired with the following parameters: echo time =130 ms, repetition time =1300 ms, number of signal averages =1, number of slices =160, field of view =250 × 259 mm2, acquisition matrix =224 × 217, acquired voxel size =1.12 × 1.19 × 2.50 mm3, flip angle =90°. The images were transferred to the MR-HIFU therapy planning console to plan MR thermometry imaging slices.
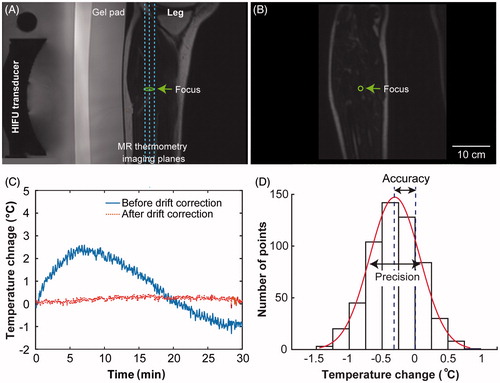
Temperature mapping was performed on six slices (i.e. five coronal slices and one sagittal slice). As illustrated in , the dotted lines illustrate the three coronal imaging slices that were centred at the nominal HIFU focal region, with the middle slice shown in . MR thermometry images acquired at these three locations were processed later for the quantification of MR thermometry accuracy and precision. Another two coronal slices were placed in the near field and far field of the nominal HIFU focus, respectively, and one sagittal slice was centred at the focal region.
Figure 1. (A) Illustration of the locations of the MR thermometry slices. A sagittal T2-weighted MR image of the leg muscle is shown along with an illustration of the nominal location of the HIFU focus. The three vertical dashed lines indicate the temperature monitoring slices in the coronal plane with the middle one shown in (B). (C) Temperature evolution of a voxel at the focus before (solid line) and after (dotted line) drift correction. (D) Histogram of the drift-corrected temperature curve shown in (C) to demonstrate the calculation of temperature accuracy and precision for each voxel. The precision was quantified by the standard deviation of the measured temperature change over all dynamics. The accuracy of thermometry was evaluated by the relative temperature change measured directly by MR thermometry throughout the whole scan, indicating the degree of closeness of the measured temperature change to the true temperature change value (i.e. 0 °C as no heating was applied).
For temperature mapping, a dynamic, RF-spoiled, fast-field-echo echo-planar imaging (FFE-EPI) sequence was utilised to acquire magnitude and phase images in order to generate temperature maps based on the PRFS method. The following parameters were used: echo time =19 ms, repetition time =36 ms, flip angle =20°, number of signal averages =1, EPI factor =11, number of slices =6, field of view =400 × 400 mm2, acquisition matrix =160 × 160, acquired voxel size =2.5 × 2.5 × 7 mm3, and temporal resolution of 3.7 s.
Prior to performing MR thermometry scans on volunteers, the MR thermometry sequence was run on an MR-HIFU quality assurance phantom (Philips, Vantaa, Finland) for 5–10 min with the intention to bring the magnet hardware to a thermal steady state [Citation18]. Then, seven volunteers were subjected to a 5-min MR thermometry scanning of the chest wall, bladder wall, and leg muscles to compare MR thermometry accuracy and precision at these representative sites. For the 5-min scans, each volunteer was subjected to scans at multiple anatomical sites (). A total of six MR thermometry scans were acquired of the bladder wall, ten scans of the leg muscles, and five scans of the chest wall. Nine more volunteers were subjected to 30-min or 60-min MR thermometry scans of leg muscles (including calf and thigh muscles) for comparing the accuracy and precision of MR thermometry at different scan durations. The volunteers’ legs were restrained using sandbags placed on both sides of the legs and the MR coil secured on top of the legs to reduce gross leg motion. The acquired MR thermometry data without any drift correction was exported and processed using the following method.
MR thermometry image processing
The acquired FFE-EPI images were processed offline using a custom software package for IDL 6.1 (ITT Visual Information Solutions, Boulder, CO, USA). The package implemented a magnetic field drift-correction algorithm described by Bing et al. [Citation18] and the performance of this algorithm was carefully evaluated in that paper. The reconstructed phase and magnitude image data were imported into the software, and MR thermometry maps were calculated using the PRFS technique [Citation20] with α = 0.0094 ppm/°C. The average of the first two phase images was used as the phase reference. For each MR temperature map, voxels with low SNR corresponding to a temperature standard deviation >3 °C were masked out to prevent the noisy data from affecting the drift correction algorithm performance [Citation21,Citation22]. Drift-corrected MR thermometry was performed with a 2 D quadratic spatial-temporal correction across all SNR-masked slices (including voxels in the HIFU “targeted” tissue as no heating was applied) [Citation23].
Finally, drift-corrected MR thermometry data were exported for further analysis in Matlab. represents temperature evolution of one voxel over time both with and without drift correction, demonstrating that drift correction greatly improved the temperature measurement accuracy.
The drift-corrected temperature maps were characterised in Matlab using two statistical parameters: precision and accuracy. For each scan, the precision of MR thermometry for each voxel was determined by the temporal standard deviation of the measured temperatures for that voxel over all dynamics. MR thermometry precision informs the repeatability and reproducibility of the measurements. The accuracy of thermometry for each voxel was evaluated by the mean relative temperature changes (absolute change) measured directly by MR thermometry throughout each scan, indicating the degree of closeness of the measured temperature change to the true temperature change (i.e. 0 °C as no heating was applied). illustrates the precision and accuracy calculation method based on the drift-corrected temperature curve shown in .
The mean precision and accuracy for each scan were calculated by the mean of the precision and accuracy of all voxels within a defined region of interest (ROI), respectively. As illustrated in , ROIs were selected in the chest wall, bladder wall, and thigh/calf muscle. The ROIs were positioned away from: (i) skin to avoid air-induced susceptibility artefacts [Citation24], (ii) bone as the PRF shift thermometry does not work for bone due to the high-fat content in the bone marrow [Citation25] and low water content in cortical bone [Citation26], and (iii) blood vessels to avoid blood flow associated motion artefacts [Citation13].
Figure 2. Representative MR temperature maps (coronal plane) of the chest wall, bladder wall, and leg muscle shown next to the corresponding magnitude images. The solid lines indicate the perimeter of the region of interest (ROI). In Figure 2 C, the voxels with high-signal intensity observed on the left side the bladder (indicated by an arrow) showcase urine filling to the bladder.
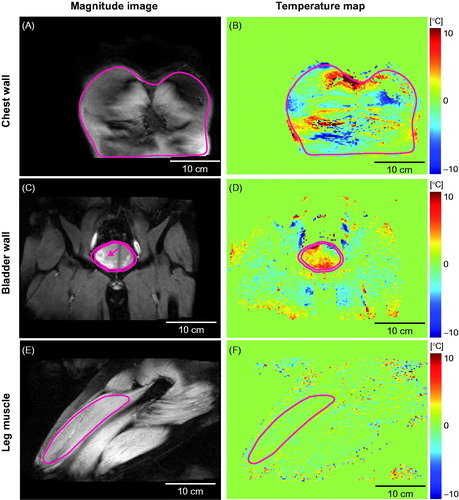
The mean bladder wall thickness for healthy men and women ranges from 0.7 to 7.6 mm in thickness [Citation27] and can be difficult to identify on T2-weighted MRI. In contrast, urine appears very bright on T2-weighted MRI. Therefore, a ring of 5 mm in thickness was selected as the bladder wall ROI encasing the urine inside the bladder.
Mean precision and accuracy lower than 1 °C were used as criteria for acceptable thermometry for each anatomical location at each scan duration. The percentage of voxels within the ROIs with both precision and accuracy <1 °C was calculated.
Statistical analysis
The precision and accuracy measurements for each targeted location and each scan duration were described as mean ± standard deviation. The precision and accuracy obtained at different anatomical sites (chest wall, bladder wall, and leg muscles) were compared using one-way ANOVA analysis followed by a post hoc Tukey’s test to examine difference among the anatomical sites in GraphPad Prism (Version 6.04, La Jolla, CA, USA). The same analysis was applied to the comparison of leg muscle MR thermometry at different scan times of 5 min, 30 min, and 60 min. A p-value of <0.05 was considered to be statically significant.
Results
Representative temperature maps acquired at different anatomical sites (chest wall, bladder wall, and leg muscle) at 5 min are shown in , along with the corresponding magnitude images. No temperature change from the baseline temperature was expected as HIFU output was disabled during MR thermometry. However, the MR temperature maps indicated apparent temperature changes in the chest wall () and bladder wall () as well as in the leg muscles (), albeit at a lower level. The ROI locations for the three representative cases are illustrated in , and the average number of voxels within the ROI at the chest wall, bladder wall, and leg muscle are given in . shows the corresponding accuracy and precision maps calculated based on the MR thermometry maps represented in . Chest wall and bladder wall temperature accuracy and precision were worse than in the leg muscle ().
Figure 3. Temperature accuracy and precision maps for the chest wall, bladder wall, and leg muscle based on the MR temperature maps shown in .
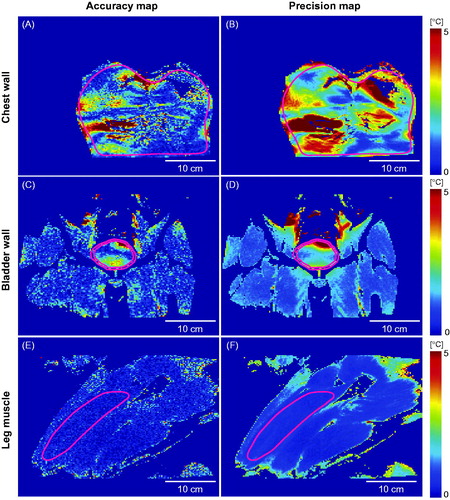
Table 2. Mean and standard deviation of temperature accuracy and precision of all MR thermometry scans at each anatomical location and scan time.
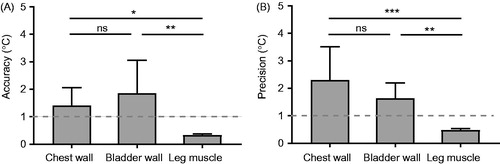
Quantification of temperature accuracy and precision within the ROIs for all chest wall, bladder wall, and leg muscle scans is presented in , and the values are summarised in . The MR thermometry accuracy of the leg muscles was significantly higher than that of the chest wall and that of the bladder wall, while the chest wall and bladder wall were not significantly different. The MR thermometry precision of the leg muscles was significantly higher than that of the chest wall and that of the bladder wall, while the chest wall and bladder wall were not significantly different. Among these three investigated anatomical locations, the leg muscles were indicated as a preferable site for MR-guided MHT as the MR thermometry mean accuracy and precision were less than 1 °C. summarises the percentage of voxels within the ROIs that had both temperature precision and accuracy less than 1 °C.
Figure 4. Quantification of MR thermometry (A) accuracy and (B) precision for the chest wall, bladder wall, and leg muscles. Precision and accuracy <1 °C (indicated by the dash lines) were used as criteria for acceptable thermometry. * denotes p < 0.05, ** denotes p < 0.01, *** denotes p < 0.001, and ns denotes p > 0.05.
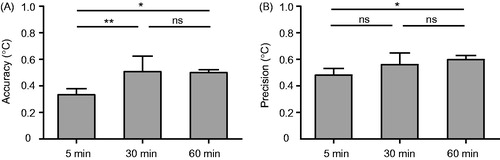
We also compared the accuracy and precision of the 5-min, 30-min, and 60-min MR thermometry scans in leg muscles. Quantitative comparison between the three groups is presented in . The MR thermometry accuracy of both the 30-min and the 60-min scans was significantly different from that of the 5-min scans, while no significant difference was found between the 30-min and 60-min scans. The precision of the 60-min scans was significantly different from that of the 5-min scans, but there were no significant differences between 5-min and 30-min scans or with 30 min and 60 min scans. Nevertheless, the 30-min and 60-min MR thermometry scans still met the criterion that both the mean precision and accuracy were less than 1 °C.
Figure 5. Comparison of MR thermometry (A) accuracy and (B) precision of 5-min, 30-min, and 60-min scans of leg muscles. * denotes p < 0.05, ** denotes p < 0.01, and ns denotes p > 0.05.
Discussion
This study evaluated the accuracy and precision of MR thermometry at three anatomical sites for different scan times in healthy volunteers. Among the three sites (chest wall, bladder wall, and leg muscles), only the leg muscles had temperature precision and accuracy <1 °C – the selected criteria for acceptable thermometry for MR-guided MHT within the temperature window of 40–43 °C.
The accuracy of MR thermometry has been evaluated in phantom, ex vivo, and in vivo. In phantom, the accuracy of PRFS-based MR thermometry was reported to be 0.2 °C when using hot water to heat up the phantom [Citation19]. Temperature distribution around a diffusing laser fibre inserted into ex vivo porcine liver during irradiation and subsequent cooling found the uncertainties of MR thermometry ranging from 0.3 °C to 1.4 °C (one standard deviation) within a 40 s scan time [Citation28]. In vivo, Craciunescu et al. [Citation17] compared MR thermometry with invasive temperature measurements in patients with extremity sarcomas during hyperthermia treatment by an RF applicator and found an excellent correlation of MR thermometry and invasive measurement. Gellermann et al. [Citation16] performed MR thermometry during regional hyperthermia treatment by a multiantenna RF applicator in patients with soft tissue sarcomas of the lower extremities and pelvis and found a good correlation between MR thermometry and direct temperature measurements (R2 = 0.96). Moreover, Lam et al. [Citation26] evaluated the performance of PRFS-based MR thermometry used for monitoring MR-HIFU ablation treatment (duration up to 2 min) of patients with bone metastases in the upper body, pelvis, and extremity. They found the average temperature variation for the MR thermometry was higher in the upper body as compared to the pelvis and dataset in the lower extremity region were excluded because of the presence of metal fixation material. The current study is the first study that evaluated the performance of MR thermometry at different anatomic sites for long-scan times relevant to MHT.
The most prevalent challenge for the PRFS-based MR thermometry is motion-induced phase artefacts. This motion includes physiological motion (e.g. respiration, cardiac, and digestive-related motion) and bulk tissue motion. The finding that acceptable MR thermometry was achieved in the leg muscles was associated with the observation that the leg muscles have the lowest motion-induced artefacts in MR thermometry when compared with the chest wall and bladder wall.
For the chest wall, respiration, and cardiac motion-induced time-varying field inhomogeneity artefacts, affecting MR thermometry performance. As shown in , MR thermometry indicated apparent temperature changes at different regions of the chest wall. The chest wall temperature accuracy and precision maps show relatively high error and uncertainty (); a consistent observation within the whole group ( and ). The mean temperature accuracy and precision were greater than 1 °C. Although it is well known that respiration and cardiac motion can induce artefacts on MR thermometry [Citation29], we quantified their implications in the context of MHT. The findings from this study serve as benchmarks for MR thermometry precision and accuracy to be used in future development of new MR thermometry techniques that can mitigate respiratory/cardiac motion-induced artefacts [Citation12].
In the lower abdomen, digestive motion, such as bladder filling, bowel movement, and peristaltic motion can produce errors in MR thermometry. We observed sudden temperature changes related to motion, such as bladder filling-induced motion and a nearby bowel movement. An example of the apparent temperature change due to bladder filling is shown in . The voxels with high-signal intensity on the left side of the bladder on the T2-weighted MR image () captured urine filling to the bladder. The corresponding temperature map () shows apparent temperature change associated with the bladder filling. For the bladder wall MR thermometry, motion artefacts led to the mean precision of 1.64 ± 0.56 °C and accuracy of 1.86 ± 1.20 °C (). MR thermometry has been successfully applied in MR-HIFU thermal ablation of uterine fibroids located in the lower abdomen. In contrast to thermal ablation, which rapidly heats tissue to above 60 °C to induce thermal coagulation [Citation30], MHT requires temperature maintenance within a narrow window (e.g. 40–43 °C) for up to 1 h in order to serve as an effective, adjuvant therapy modality to radio- and/or chemotherapy. The narrow temperature window of MHT requires thermometry accuracy and precision to be <1 °C [Citation17,Citation18], while 1–2 °C precision is considered sufficient for thermal ablation [Citation26]. A previous report evaluated MR thermometry temperature variations in the upper body, pelvis, and extremities during MR-HIFU thermal ablation [Citation26]. It was found that the average temperature variations for the upper body (1.7 ± 0.2 °C) and pelvis (1.4 ± 0.9 °C) met the MR thermometry requirement for thermal ablation. However, they did not meet the criteria selected herein for MHT (accuracy and precision <1 °C). In a previous report evaluating MR thermometry for HIFU-mediated MHT of rectal cancer, Chu et al. found that the MR thermometry spatial uncertainty and precision were not preferable for MHT (precision 7.8 ± 7.8 °C, spatial uncertainty 2.6 ± 1.6 °C). However, after saline rectal filling reduced the effect of peristaltic motion, the precision (1.1 ± 0.4 °C) and spatial uncertainty (0.6 ± 0.3 °C) of MR thermometry were close to 1 °C. Consistent with those previous findings, our study suggests that sites in the lower abdomen, although feasible for HIFU thermal ablation, may not be suitable treatment targets for MHT without strategies to minimise motion. One example of such strategies for the treatment of patients with bladder cancer is continuous bladder irrigation using a catheter (e.g. a three-way Foley catheter) to mitigate the bladder wall motion. This approach can be considered in patients, but not to be used in healthy volunteers.
The leg muscles were not affected by the physiological motion (i.e. respiration, cardiac, or digestive system-related motion), and as such were the only anatomical site assessed in this study that met the criteria (i.e. MR thermometry accuracy and precision <1 °C) for MR-HIFU MHT within the temperature window of 40–43 °C. As shown in and , the leg muscles had the best temperature accuracy and precision among the three studied anatomical sites (). At longer scan durations of 30 min and 60 min, the leg muscles still hold acceptable criteria for reliable MR thermometry for MHT. Future study will focus on evaluating the feasibility of MR-HIFU MHT to treat extremity tumours, such as soft-tissue sarcoma, granular cell tumours, and fibroblastic tumours.
In this study, we applied a second order drift correction algorithm for mitigating the effects of magnetic field drift. This drift correction algorithm was adequate in the leg muscles as indicated by the high-thermometry accuracy and precision for the long-scan durations. Without drift correction, MR thermometry accuracy for the 5-min, 30-min, and 60-min scans was 0.82 ± 0.34 °C, 7.42 ± 1.92 °C, and 13.96 ± 3.45 °C, respectively. Similarly, without drift correction, MR thermometry precision was 0.85 ± 0.27 °C, 4.89 ± 1.22 °C, and 9.8 ± 2.29 °C for the 5-min, 30-min, and 60-min scans, respectively. Compared with the values reported in with drift correction applied, it is clear that a drift correction algorithm is essential for reliable temperature measurements, especially at long-scan times.
In addition, although volunteers were given the instruction to stay still during the scans, infrequent toe/foot movement was observed on the MRI suite monitor in four of the volunteers during the 30-min and 60-min scans. This movement was associated with a transient increase of the measured apparent temperature at several voxels within the ROI, but the overall MR thermometry accuracy and precision still met the selected criteria. Data from these volunteers were included in our group statistical analysis.
This study has limitations as discussed below. First, only three representative sites were selected on the upper body, lower abdomen, and lower extremities to represent the potential MR-guided MHT targets. Other targets, such as liver, uterus, prostate, head and neck, and upper extremities, were not included in this study. However, the results from this study suggest that muscles of the extremities are preferable MHT sites based on MR thermometry performance. Second, several techniques have been developed for managing motion, such as respiratory gating, multibaseline acquisition [Citation31], and referenceless phase correction [Citation12,Citation32]. Future work is needed to implement the available techniques into the clinical MR-HIFU workflow to counter motion-related MR thermometry errors. Third, we evaluated MR thermometry in the absence of heating. Heating can change tissue perfusion, which can generate perfusion-based phase changes unrelated to temperature changes and lead to errors in temperature mapping. Future clinical studies are needed to evaluate the performance of MR thermometry during MR-HIFU MHT.
Conclusions
This study constitutes the evaluation of MR thermometry precision and accuracy at different anatomical locations at different scan times. The chest wall and bladder wall had mean temperature accuracy and precision above 1 °C. The degradation of MR thermometry performance at the chest wall and bladder wall was associated with respiratory, cardiac, and digestive system-related motion. MR thermometry accuracy and precision in the leg muscles at different scan times (5 min, 30 min, and 60 min) were lower than 1 °C, thus meeting the selected criteria for MHT within the target temperature range of 40–43 °C. These results indicate that extremity locations may be preferable targets for MR-guided MHT using the existing MR thermometry technique.
Acknowledgements
Authors would like to thank Stacie Mackey for her valuable suggestions on volunteer positioning for MR thermometry scanning.
Disclosure statement
Ari Partanen is a paid employee of Philips. Other authors have nothing to declare.
Additional information
Funding
References
- Wust P, Hildebrandt B, Sreenivasa G, et al. (2002). Hyperthermia in combined treatment of cancer. Lancet Oncol 3:487–97.
- Chu W, Staruch RM, Pichardo S, et al. (2016). Magnetic resonance-guided high-intensity focused ultrasound hyperthermia for recurrent rectal cancer: MR thermometry evaluation and preclinical validation. Int J Radiat Oncol Biol Phys 95:1259–67.
- Chu KF, Dupuy DE. (2014). Thermal ablation of tumours: biological mechanisms and advances in therapy. Nat Rev Cancer 14:199–208.
- Partanen A, Yarmolenko PS, Viitala A, et al. (2012). Mild hyperthermia with magnetic resonance-guided high-intensity focused ultrasound for applications in drug delivery. Int J Hyperth 28:320–36.
- Rao W, Deng ZS, Liu J. (2010). A review of hyperthermia combined with radiotherapy/chemotherapy on malignant tumors. Crit Rev Biomed Eng 38:101–16.
- Mallory M, Gogineni E, Jones GC, et al. (2016). Therapeutic hyperthermia: the old, the new, and the upcoming. Crit Rev Oncol Hematol 97:56–64.
- Datta NR, Ordez SG, Gaipl US, et al. (2015). Local hyperthermia combined with radiotherapy and-/or chemotherapy: recent advances and promises for the future. Cancer Treat Rev 41:742–53.
- Lewis MA, Staruch RM, Chopra R. (2015). Thermometry and ablation monitoring with ultrasound. Int J Hyperth 31:163–81.
- Van Der Zee J, Peer-Valstar JN, Rietveld PJM, et al. (1998). Practical limitations of interstitial thermometry during deep hyperthermia. Int J Radiat Oncol Biol Phys 40:1205–12.
- Yao J, Ke H, Tai S, et al. (2013). Absolute photoacoustic thermometry in deep tissue. Opt Lett 38:5228–31.
- Fani F, Schena E, Saccomandi P, et al. (2014). CT-based thermometry: an overview. Int J Hyperth 30:219–27.
- Rieke V, Butts Pauly K. (2008). MR thermometry. J Magn Reson Imaging 27:376–90.
- Winter L, Oberacker E, Paul K, et al. (2015). Magnetic resonance thermometry: methodology, pitfalls and practical solutions. Int J Hyperth 6736:1–13.
- Rivens I, Shaw A, Civale J, et al. (2007). Treatment monitoring and thermometry for therapeutic focused ultrasound. Int J Hyperth 23:121–39.
- Tillander M, Hokland S, Koskela J, et al. (2016). High-intensity focused ultrasound induced in vivo large volume hyperthermia under 3D MRI temperature control. Med Phys 43:1539.
- Gellermann J, Hildebrandt B, Issels R, et al. (2006). Noninvasive magnetic resonance thermography of soft tissue sarcomas during regional hyperthermia: correlation with response and direct thermometry. Cancer 107:1373–82.
- Craciunescu OI, Stauffer PR, Soher BJ, et al. (2009). Accuracy of real time noninvasive temperature measurements using magnetic resonance thermal imaging in patients treated for high grade extremity soft tissue sarcomas. Med Phys 36:4848–58.
- Bing C, Staruch RM, Tillander M, et al. (2016). Drift correction for accurate PRF-shift MR thermometry during mild hyperthermia treatments with MR-HIFU. Int J Hyperth 32:673–87.
- Poorter JD, Wagter CD, Deene YD, et al. (1995). Noninvasive MRI thermometry with the proton resonance frequency method: Study of susceptibility effects. Magn Reson Med 34:359–67.
- Ishihara Y, Calderon A, Watanabe H, et al. (1995). A precise and fast temperature mapping using water proton chemical shift. Magn Reson Med 34:814–23.
- Salomir R, Palussire J, Vimeux FC, et al. (2000). Local hyperthermia with MR-guided focused ultrasound: Spiral trajectory of the focal point optimized for temperature uniformity in the target region. J Magn Reson Imaging 12:571–83.
- Köhler M, Mougenot C, Quesson B, (2009). Volumetric HIFU Ablation under 3D guidance of Rapid MRI Thermometry. Med Phys 36:3521–35.
- El-Sharkawy AEM, Schar M, Bottomley PA, et al. (2006). Monitoring and correcting spatio-temporal variations of the MR scanner’s static magnetic field. Magn Reson Mat Phys Biol Med 19:223–36.
- Streicher MN, Schäfer A, Reimer E, et al. (2012). Effects of air susceptibility on proton resonance frequency MR thermometry. Magn Reson Mat Phys Biol Med 25:41–7.
- Ozhinsky E, Han M, Bucknor M, et al. (2016). T2-based temperature monitoring in bone marrow for MR-guided focused ultrasound. J Ther Ultrasound 4:26
- Lam MK, Huisman M, Nijenhuis RJ, et al. (2015). Quality of MR thermometry during palliative MR-guided high-intensity focused ultrasound (MR-HIFU) treatment of bone metastases. J Ther Ultrasound 3:5.
- Hakenberg OW, Linne C, Manseck A, et al. (2000). Bladder wall thickness in normal adults and men with mild lower urinary tract symptoms and benign prostatic enlargement. Neurourol Urodyn 19:585–93.
- Wlodarczyk W, Hentschel M, Wust P, et al. (1998). MRI thermometry in phantoms by use of the proton resonance frequency shift method: application to interstitial laser thermotherapy. Phys Med Biol 43:2597–613.
- Peters NH, Bartels LW, Sprinkhuizen SM, et al. (2009). Do respiration and cardiac motion induce magnetic field fluctuations in the breast and are there implications for MR thermometry? J Magn Reson Imaging 29:731–5.
- Senneville BD, Mougenot C, Quesson B, et al. (2007). MR thermometry for monitoring tumor ablation. Eur Radiol 17:2401–10.
- Pichardo S, Köhler M, Lee J, et al. (2014). In vivo optimisation study for multi-baseline MR-based thermometry in the context of hyperthermia using MR-guided high intensity focused ultrasound for head and neck applications. Int J Hyperthermia 30:579–92.
- Roujol S, Ries M, Quesson B, et al. (2010). Real-time MR-thermometry and dosimetry for interventional guidance on abdominal organs. Magn Reson Med 63:1080–7.