
Abstract
Objective: Microwave ablation (MWA) is an effective technique for the treatment of benign thyroid nodules. The aim of this study was to investigate whether it is necessary to study changes in variables other than the volume reduction between follow-up intervals. This study also introduced the index R (Ssurface/V) to explore whether it could reflect features of shape between follow-up intervals.
Materials and methods: A total of 236 complex benign thyroid nodules in 230 patients who underwent MWA in our department from October 2013 to February 2017 were included. The Dmax, volume (V), volume reduction ratio (VRR) and index R (Ssurface/V) parameters were evaluated before treatment and postoperatively at 1, 3, 6 and >12 months. Multiple comparisons of these parameters were performed between the baseline and each follow-up period for the entire patient group and subgroups based on diameter and volume.
Results: All of the thyroid nodules underwent a significant decrease in size after MWA. The mean decrease in the volume of the thyroid nodules was from 17.40 ± 22.52 mL to 1.31 ± 2.71 mL, with a mean percent decrease of 0.90 ± 0.15% after 12 months. Index R increased over time from 2.55 ± 1.08 to 8.10 ± 5.01, which increased the effectiveness of shape parameterisation between the follow-up periods after the three-month time point, regardless of the initial volume size. For the nodules with a baseline Dmax ≤ 3.4 cm, the V, VRR and index R demonstrated similar capabilities in the evaluation of efficiency before the six-month follow-up visit.
Conclusions: Long-term follow-up emphasises changes in the shape and spatial structure of complex benign thyroid nodules, rather than size variations, after effective MWA. Index R, which is the surface area to volume ratio, can also reflect the shape change to some degree.
Introduction
Thyroid nodules are a fairly common occurrence [Citation1,Citation2]. Some of them need treatment for cosmetic reasons, subjective symptoms, or anxiety about a malignant change. Thermal ablation, such as laser ablation (LA), radiofrequency ablation (RFA) [Citation3–7] and high-intensity focussed ultrasound (HIFU) [Citation8,Citation9] have been well applied and yield effective results. In recent years, as a minimally invasive technique for thermal ablation, microwave ablation (MWA) is indicated for cases of symptomatic benign thyroid nodules and is increasing in popularity [Citation10–13]. Serial ultrasound (US) is recommended for the detection of changes in the sizes of thyroid nodules during follow-up [Citation1]. The volume change shown by US is one of the most important parameters for efficacy evaluation following thermal ablation [Citation6]. Compared with the baseline values, the follow-up values of the volume reduction rate (VRR) and maximum diameter (Dmax) decrease and yield significant results [Citation3–5,Citation13]. However, whether there are meaningful changes at each follow-up interval and whether US can provide additional information on the efficacy assessment of ablation beyond the size of the nodules remain to be determined. Thus, our study aimed to define the changes between each follow-up period using multiple comparisons and to investigate new parameters that could reflect the shape change of nodules after treatment.
Materials and methods
Patients
A total of 230 patients (67 males and 163 females; mean age: 50.5 ± 13.0 years; age range: 14–82 years) with 236 complex benign thyroid nodules were treated with US-guided MWA in our department from October 2013 to February 2017. Among the 230 patients, 167 had multiple lesions, and 63 had single lesions. The following inclusion criteria were applied: (a) benign thyroid nodules proven by two fine-needle aspiration biopsies, (b) presence of clinical symptoms (e.g., compressive symptoms, foreign body sensation, and neck discomfort), (c) anxiety about malignancies, (d) cosmetic concerns and (e) contraindications or refusal to undergo surgery. This was a retrospective study, and written informed consent was obtained from each of the patients before the procedure.
Equipment
US examination
A HI VISION Preirus (Hitachi Medical Corporation, Tokyo, Japan) colour US diagnostic apparatus and a Philips iU22 (Philips Ultrasound, Inc., Bothell, WA, USA) were used for the thyroid nodule examinations before the ablation and at each follow-up visit.
Microwave ablation instrument
The 2450 MHz MW unit (KY-2000, Kangyou Medical, Nanjing, China) consists of three independent MW generators, three flexible coaxial cables and three water pumping machines that can simultaneously drive three 16-gauge cooled-shaft antennae (with a 3 or 5 mm antenna tip). The generator is capable of producing 1–100 W of power continuously or in the form of pulses.
Pre-ablative assessment
All of the patients underwent B-mode US examination to evaluate the size, volume and composition of the nodules. Complex nodules contain a cystic portion representing 20–80% of the nodule. The three largest perpendicular diameters of the nodules were measured before MWA and during each follow-up visit. The nodule volume (V) was calculated from the nodule diameter using the ellipsoid formula (V = πABC/6), where A is the maximum perpendicular diameter (Dmax) and B and C are the other mutually perpendicular diameters.
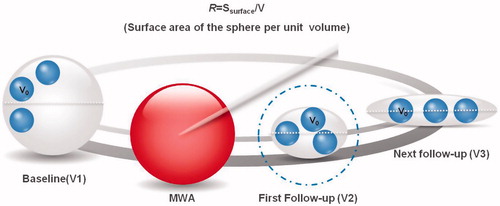
In addition to the V and Dmax, we introduced index R = Ssurface/V (the surface area of the sphere per unit volume) to explore the shape features between follow-up terms. The volume of a spheroid is smallest compared to other shapes with the same surface area, while the surface area of a spheroid is smallest compared to other shapes with the same volume. MWA, when comparing each of the follow-up values to the baseline value, induces no significant changes in volume between follow-up periods, and the shape of lesion must be different as the index R changes. Between other follow-up periods, the volume and surface area are reduced after an effective treatment. Variation of the index R means that either the volume or surface area changes greater than the other. A schematic diagram of this concept is shown in .
Figure 1. Schematic diagram of index R. Index R was defended as the surface area of the unit volume (R = Ssurface/V). Between the baseline and first follow-up, volume and surface area reduction was observed after effective treatment. The increasing ratio reflected that volume decrease much faster than the surface area. The value of R reflected volume reduction of the lesion. Between the next follow-up the volume had no changes (V2 = V3), while the shape of lesion was different. With the same volume, oblate ellipsoid earned larger surface area. Index R could reflect shape changes. The surface area in per unit volume improved. Dmax of V2, V3 was shorter than V1 after MWA, whereas Dmax in next follow-up was much longer than in first ones. V0: Unit volume (constant); V1: baseline volume; Dmax: white dotted line; V2, V3: volume after MWA, V2 is equal to V3.
The entire group of patients was further divided into subgroups according to their baseline maximum diameters (those with a Dmax ≤ 3.40 cm and those with a Dmax > 3.40 cm) and their initial volumes (those with a V ≤ 10.47 ml and those with a V > 10.47 ml) to investigate whether size influenced the results of the parameter comparison. The baseline characteristics of the patients in the different groups are summarised in .
Table 1. Baseline characteristics of different groups.
Laboratory tests, including thyroid data (triiodothyronine [T3], free thyroxine [fT4], and thyroid stimulating hormone [TSH] levels), complete blood counts, and blood coagulation tests (prothrombin time and activated partial thromboplastin time), were performed for all patients.
Procedure
The procedure was performed with the patients under local anaesthesia (1% lidocaine). To reduce possible heat-sink effects and to minimise the preoperative ablation volume, we performed MWA after the aspiration of internal fluid. The viscous material was aspirated, which was followed by normal saline irrigation. Then, 99% ethanol was slowly injected into the cystic cavity and completely removed after two minutes [Citation14]. The cooled MWA antenna (16 G) was subsequently placed under US monitoring. During the MWA, a 30–50 W power output was used, and the therapy was terminated when the hyper-echo covered the entire nodule. At the end of the procedure, the wound was compressed with dressing, and the patients remained under observation for an additional 30 min to assess potential complications.
Follow-up
US examination, laboratory data and clinical symptoms were evaluated immediately after the ablation. US examinations (size, echogenicity, and intra-nodular vascularity) were also performed at the 1-month, 3-month, 6-month and >12-month follow-up periods. The volume reduction ratio (VRR) was calculated with the following equation: VRR = [(initial volume-final volume) × 100]/initial volume. The index R was expressed as follows: Ssurface/V= [π(AB + AC + BC)/3]/(πABC/6) = 2(AB + AC + BC)/ABC. Twelve-month follow-up was completed for 89 of the 230 nodules, and the longest follow-up was 36 months.
The nodules with large initial volume, vascularity and closed to the dangerous parts tended to occur earlier regrowth [Citation15,Citation16]. Our objective is to explore new parameters, observe whether there are changes in other aspects rather than size variations. So we included two points for controlling: first, complete ablation assessment under contrast-enhanced ultrasound after MWA; second an effective ablation during the follow-up without recurrence. All these patients were involved in our study finally. And no recurrence was defined as a more than a 50% increase in the total volume [Citation15].
Statistical analysis
The statistical analyses were performed using SPSS, version 19.0 and Medcalc, version 15.10. The V and VRR at baseline and each follow-up visit were compared using the Kruskal–Wallis analysis of variance (ANOVA) test. Multiple comparisons of the Dmax and index R at baseline and each follow-up visit were performed using one-way ANOVA (follow-up time). The area under the receiver operating curve (ROC) was compared to determine the efficiency of the same follow-up point through the “Curves Comparison” function in Medcalc. The data were reported as the mean ± SD, and the significance level was set at 0.05.
Results
Ablation efficiency
The changes in the parameters before MWA and at each follow-up visit are shown in . All of the parameters expressed significant differences at follow-up compared with baseline (p < 0.0001). The baseline volume was 17.40 ± 22.52 ml, and the volumes after ablation were 4.47 ± 4.98 ml, 2.10 ± 2.58 ml, 1.90 ± 3.57 ml and 1.31 ± 2.71 ml at the 1-month, 3-month, 6-month, and 12-month follow-up periods, respectively. Index R increased with time, and the values were 2.55 ± 1.08, 3.75 ± 1.32, 4.93 ± 2.42, 6.59 ± 3.88 and 8.10 ± 5.01 at the 1-month, 3-month, 6-month and 12-month follow-up periods, respectively.
Table 2. Changes of parameters before MWA and at each follow-up.
Multiple comparisons in the whole group at each follow-up
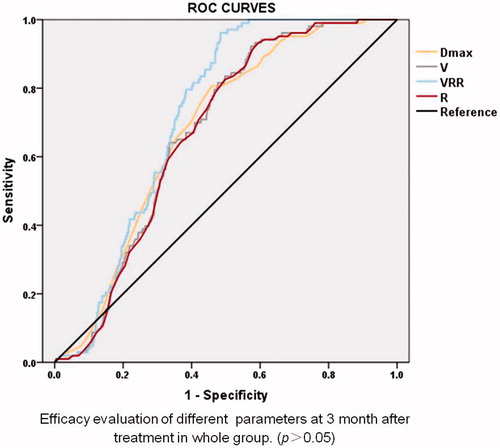
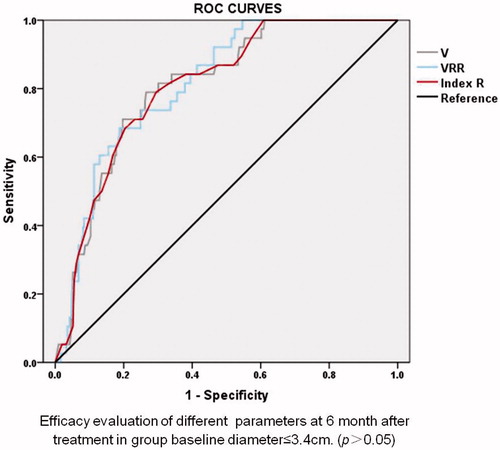
In the therapeutic evaluation, no statistically significant differences were observed in the values of Dmax, V and VRR between the three-month and six-month follow-up periods or between the 6-month and 12-month follow-up periods (). The value of index R gradually increased over time, with a greater value observed at each follow-up compared with the former period. The evaluation of the ROC curves of Dmax, V, VRR and index R at the three-month follow-up showed no significant differences between the treatment groups ().
Figure 2. Multiple comparisons in the whole group before ablation and after each follow-up. After MWA, no statistically significant differences were observed in parameters like Dmax, V and VRR between the three-month and six-month follow-up periods. Similarly, between the 6-month and 12-month follow-up, the above parameters didn’t show any statistically significant differences. ns: No significance. Those which were not showed had statistical significance difference (p < 0.05). The blue dashed line contains parameters Dmax, V and VRR. The blue solid line shows the comparison.
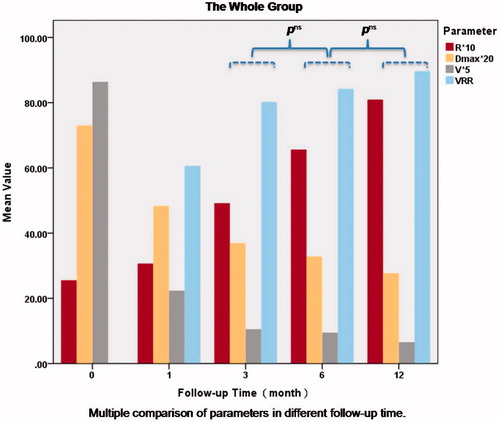
Figure 3. ROC curve of Dmax, V, VRR and index R at three-month follow-up. All parameters expressed effective treatment after MWA within three-month whether comparing with the baseline or the former follow-up. And the similar performance in treatment evaluation was obtained by ROC curve of these parameters.
Multiple comparisons in the diameter groups before ablation and at each follow-up visit
Regardless of the range of the diameter, the value of index R indicated the ablation efficacy between the different follow-up periods. There were no statistically significant differences between the 6-month and 12-month follow-up values of Dmax, V and VRR. In contrast to the next follow-up term, the values of V and VRR showed no effectiveness from the 3-month to 12-month periods when the initial diameter of the nodule was larger than 3.4 cm. In the lesions with a baseline Dmax ≤ 3.4 cm, the values of V and VRR showed statistically significant differences between follow-up visits before the six-month period and the former follow-up period (). Regarding the lesions with a baseline diameter ≤3.4 cm, the values of index R, V and VRR showed similar efficiency between the six-month follow-up period and the previous follow-up period ().
Figure 4. Multiple comparisons in the diameter group before ablation and after each follow-up. Between the 6-month and 12-month follow-up, whatever the initial diameter was, there were no statistically significant differences values of Dmax, V and VRR. And so did Dmax between the 3-month and 6-month follow-up. When the initial diameter >3.4 cm, the values of V and VRR showed no statistically significant differences in comparing with the next follow-up term, from 3-month to 12-month periods. ns: No significance. Those which were not showed had statistical significance difference (p < 0.05). The blue dashed line contains parameters Dmax, V and VRR. The red solid line contains parameters V and VRR. The yellow dashed line represents Dmax. The blue solid line shows the comparison.
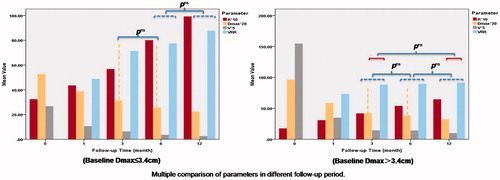
Figure 5. Receiver operating curve curve of V, VRR and index R at six-month follow-up in nodules baseline diameter ≤3.40 cm. V, VRR and index R reflected treatment effectiveness after MWA within six-month whether comparing with the baseline or the former follow-up. And the similar performance in treatment evaluation was obtained by ROC curve of these parameters.
Multiple comparisons in the volume groups before ablation and after each follow-up visit
The values of index R could determine the ablation efficacy more effectively between different follow-up visits after the three-month period, with a statistically significant difference between the large and small volume groups compared with the Dmax, V and VRR (p < 0.0001) ( and ).
Figure 6. Multiple comparisons in the volume group before ablation and after each follow-up. After the three-month periods, whatever initial volume was, Dmax, V and VRR showed no statistically significant differences compared with the former or the next follow-up. ns: No significance. Those which were not showed had statistical significance difference (p < 0.05). The blue dashed line contains parameters Dmax, V and VRR. The blue solid line shows the comparison.
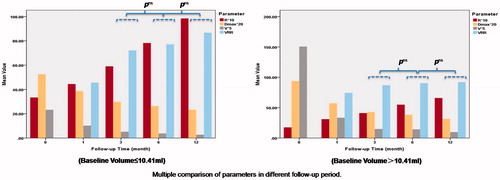
Figure 7. A 43-year-old man had a complex nodule in the left lobe. The changes of the nodules before and after MWA were presented in the following pictures. (a) Ultrasound examination revealed the Dmax, V and index R of the nodule were 3.7 cm, 10.20 ml and 2.36 before MWA. (b) One-month after the ablation, Dmax, V, VRR and index R of the nodule were 2.5 cm, 3.56 ml, 65.10% and 3.24, respectively. (c) Three-month after the ablation, Dmax, V, VRR and index R of the nodule were 1.3 cm, 0.44 ml, 95.69% and 6.54, respectively. (d) Six-month after the ablation, Dmax, V, VRR and index R of the nodule were 1.0 cm, 0.16 ml, 98.43% and 9.33, respectively. (e) At final 15-month follow-up of this patient, Dmax, V, VRR and index R of the nodule were 1.0 cm, 0.11 ml, 98.92% and 11.00, respectively. It shows more changes of shape rather than volume.

The treatment was well-tolerated, and no life-threatening complications were observed. Most of the patients complained of a sensation of heat in the neck or slight pain at the ablated site. However, no analgesics were needed in any of the patients. After the ablation, thyroid capsule haemorrhage developed in three patients, but they all spontaneously recovered within three months, one of whom recovered under US-guided aspiration. The TSH and fT4 values increased rapidly after the ablation and decreased significantly without any management at the subsequent one-month follow-up visit ().
Table 3. Thyroid function before treatment and after one month of follow-up (p > 0.05).
Discussion
In benign thyroid nodules, therapy is mainly focussed on patients with progressive nodular growth or cosmetic problems and symptoms. After over a decade of clinical application, imaging-guided thermal ablation has been reported with encouraging results. Currently, these treatments, such as RFA and LA through US guidance, are often proposed as an alternative therapy to thyroidectomy or radioiodine especially for nonsurgical candidates, surgical high-risk individuals or those refusing surgery [Citation17,Citation18]. Regarding RFA, VRR had been found to range from 47% to 84% at three to six months, and from 62% to 93% at one year; LA also seemed to be effective in achieving significant shrinkage of nodular volume, with VRR from 37% to 81% at three to six months, and from 13% to 82% at one-year follow-up [Citation19–21].
Similarly, MWA under the control of US had achieved promising results as a minimally invasive treatment for benign thyroid nodules in recent years. Compared with RFA, MWA processed the same mean maximal diameters (MDRR) and VRR after three months [Citation17]. The mean volume reduction at six months or at the last follow-up was 45.9–65% [Citation22] in a mixed group of patients (with cystic, solid and mixed nodules). Our previous study in 435 patients reported the mean VRR and the final VRR could reach 90% and 94%, respectively [Citation23]. In contrast to the baseline status, the results of our study produced a VRR of 0.86 ± 0.19 in complex nodules, which was similar to the 0.83 ± 0.17 reported in the study conducted by Yue et al. [Citation13] at the six-month follow-up visit. Additionally, good efficiency remained continual at 12 months, at which the VRR was 0.90 ± 0.15.
Furthermore, the results of our study indicated that additional information on the size of the nodules could not be obtained when comparing them with the previous or next follow-up at the six-month follow-up period. Parameters representing the size of the nodules expressed no statistically significant differences between follow-up periods. Thus, whether we can properly extend the follow-up interval remains to be determined. A prospective multicentre study by Zhigang Cheng [Citation17] showed that radiofrequency ablation mastered a larger maximum diameter and a reduced volume rate than did MWA at the six-month and later follow-up periods. Thus, whether there really is no change in the nodule during these short periods of follow-up remains to be confirmed. Moreover, it remains unclear whether further studies should address the changes between follow-up intervals, except for those related to the volume reduction. Indeed, few data have been generated regarding the true three-dimensional shape of nodules. Therefore, in addition to the V, Dmax and VRR, we tried to introduce the index R to explore whether this value could reflect the shape features between follow-up periods.
Unlike cases of thyroid carcinoma, the malignant nodule shape was estimated by calculating the ratio of the longest dimension to the shortest dimension [Citation24]. Benign symptomatic thyroid nodules are mainly manifested as a compression of the surrounding tissue. Due to the cystic component or internal bleeding, benign nodules are subjected to a large amount of tension, and the shapes are similar to a sphere or ellipsoid (more ellipsoidal than round) [Citation25]. Notably, nodule shape cannot be easily predicted using routine size parameters.
The index R, which represents the surface area to volume, can be explained as the surface area per unit of volume. As a constant, when the value of the index R increases, the proportion of the surface area per unit of volume in the whole-nodule surface improves, which corresponds to a reduction of the entire surface and tension. In the period between two follow-ups, all of the parameters (V, VRR, Dmax and index R) showed statistical significance within 3 months. The ratio of the index R reflected that the volume decreased much faster than the surface area and that the result possessed the same value with the changing of the V, VRR and Dmax values.
Meanwhile, in other periods during our study (including the three-month to six-month and 6-month to 12-month periods), the value of the index R increased, while the V, VRR and Dmax stayed the same. According to the arithmetic expression R = Ssurface/V, the surface area of the lesion might increase after the three-month follow-up. The volume of a spheroid is smallest compared to various other shapes with the same surface area, while the surface area of a spheroid is smallest compared to other shapes with the same volume. Therefore, the shape of the ablation lesion could be referenced as changing over time.
Feng et al. [Citation10] reported that all ablation lesions were ellipsoidal after immediate MWA. In our opinion, the complex nodules in our study rapidly decreased in volume due to the even removal of the cystic component and complete ablation in the solid region [Citation26,Citation27]. After an effective treatment and as time passed, water was absorbed, fibrous scar tissue formed, and a solid structure became densely arranged, such that the volume did not change significantly over the short-term evaluation.
When the patients were divided into two groups according to the maximum diameter of their lesions, the V and VRR expressed statistically significant differences in the lesions with a baseline Dmax ≤ 3.4 cm before the six-month follow-up, while the V and VRR did not show this result for patients in the larger diameter group. We suspected that large nodules might need a longer time to recover; nevertheless, under the premise of effective treatment, the V and VRR did not show statistically significant changes between the three-month follow-up and 12-month follow-up. We considered that grouping the nodules by diameter may not reflect changes in the size of the entire nodule, especially for large nodules, as the largest diameter does not represent the largest volume. Therefore, we regrouped the nodules based on the initial volume to explore changes in the parameters between each follow-up period, and the results were consistent with those of the overall group. An increase in index R after MWA represents an improvement of the surface area per unit of volume. The effect of index R on the evaluation of MWA lied not only in showing a tendency towards a decreasing volume but also in a shape-change description, especially after three months, in either the large volume or small volume groups. No statistically significant differences in the Dmax, V and VRR were obtained between some of the follow-up periods analysed.
Conclusions
Our results suggest that MWA can achieve a shrinkage of nodule size and a relief of clinical symptoms. In contrast to previous evaluations, effective treatment with long-term follow-up emphasises changes in the shape and spatial structure form of complex benign thyroid nodules rather than size variations. The increasing value of index R could add effectiveness to the shape parameterisation between follow-up periods after three months. For nodules with a baseline Dmax ≤ 3.4 cm, the V, VRR and index R possessed similar capabilities in the efficiency evaluation before the six-month follow-up visit. According to our point, after MWA ablation, nodule volume reduction should to be paid more attention in the first one- and three-month (in nodules D ≤ 3.4 cm, follow up focussing on volume could be extended to six-month). After six-month for nodules without recurrence, the interval could be much longer: 12-month or even 24-month. The limitations of this study include the small numbers of cases in some of the follow-up periods, so further studies with large sample sizes and a longer-term follow-up period will be necessary. Further prospective studies involving nodules with different composition ratios, rather than only complex ones are needed as well. Similarly, additional studies should determine the relationship between recurrence and index R in different volume and composition groups. Moreover, a three-dimensional visualisation system that is much more accurate and objective than an approximated sphere formula should be introduced to compare the size and shape changes after treatment.
Acknowledgements
Ethical approval was given by the medical ethics committee of Beijing Friendship Hospital, Capital Medical Hospital (No. 2015-P2–021-01). Written informed consent was obtained from each of the patients before the procedure. The language help is provided by American Journal Experts.
Disclosure statement
No potential conflict of interest was reported by the authors.
References
- Haugen BR, Alexander EK, Bible KC, et al. (2016). 2015 American Thyroid Association Management guidelines for adult patients with thyroid nodules and differentiated thyroid cancer: the American Thyroid Association Guidelines Task Force on Thyroid Nodules and Differentiated Thyroid Cancer. Thyroid 26:1–133.
- Shin JH, Baek JH, Chung J, et al. (2016). Ultrasonography diagnosis and imaging-based management of thyroid nodules: revised Korean society of thyroid radiology consensus statement and recommendations. Korean J Radiol 17:370–95.
- Sung JY, Baek JH, Jung SL, et al. (2015). Radiofrequency ablation for autonomously functioning thyroid nodules: a multicenter study. Thyroid 25:112–7.
- Papini E, Rago T, Gambelunghe G, et al. (2014). Long-term efficacy of ultrasound guided laser ablation for benign solid thyroid nodules. Results of a three-year multicenter prospective randomized trial. J Clin Endocrinol Metab 99:3653–9.
- Yue WW, Wang SR, Lu F, et al. (2017). Radiofrequency ablation vs. microwave ablation for patients with benign thyroid nodules: a propensity score matching study. Endocrine 55:485–95.
- Ahn HS, Kim SJ, Park SH, Seo M. (2016). Radiofrequency ablation of benign thyroid nodules: evaluation of the treatment efficacy using ultrasonography. Ultrasonography 35:244–52.
- Pacella CM, Mauri G, Cesareo R, et al. (2017). A comparison of laser with radiofrequency ablation for the treatment of benign thyroid nodules: a propensity score matching analysis. Int J Hyperthermia 33:911–9.
- Esnault O, Franc B, Ménégaux F, et al. (2011). High-intensity focused ultrasound ablation of thyroid nodules: first human feasibility study. Thyroid 21:965–73.
- Bini F, Trimboli P, Marinozzi F, et al. (2017). Treatment of benign thyroid nodules by high intensity focused ultrasound (HIFU) at different acoustic powers: a study on in-silico phantom. Endocrine. [Jun 21]. [Epub ahead of print]. doi: 10.1007/s12020-017-1350-1
- Feng B, Liang P, Cheng Z, et al. (2012). Ultrasound-guided percutaneous microwave ablation of benign thyroid nodules: experimental and clinical studies. Eur J Endocrinol 166:1031–7.
- Mader OM, Tanha NF, Mader A, et al. (2017). Comparative study evaluating the efficiency of cooled and uncooled single-treatment MWA in thyroid nodules after a 3-month follow up. Eur J Radiol Open 4:4–8.
- Heck K, Happel C, Grünwald F, Korkusuz H. (2015). Percutaneous microwave ablation of thyroid nodules: effects on thyroid function and antibodies. Int J Hyperthermia 31:560–7.
- Yue W, Wang S, Wang B, et al. (2013). Ultrasound guided percutaneous microwave ablation of benign thyroid nodules: safety and imaging follow-up in 222 patients. Eur J Radiol 82:e11–6.
- Kim YJ, Baek JH, Ha EJ, et al. (2012). Cystic versus predominantly cystic thyroid nodules: efficacy of ethanol ablation and analysis of related factors. Eur Radiol 22:1573–8.
- Sim JS, Baek JH, Lee J, et al. (2017). Radiofrequency ablation of benign thyroid nodules: depicting early sign of regrowth by calculating vital volume. Int J Hyperthermia 33:905–10.
- Baek JH. (2017). Factors related to the recurrence of benign thyroid nodules after thermal ablation. Int J Hyperthermia 33:459–64.
- Cheng Z, Che Y, Yu S, et al. (2017). US-guided percutaneous radiofrequency versus microwave ablation for benign thyroid nodules: a prospective multicenter study. Sci Rep7:9554.
- Korkusuz Y, Gröner D, Raczynski N, et al. (2017). Thermal ablation of thyroid nodules: are radiofrequency ablation, microwave ablation and high intensity focused ultrasound equally safe and effective methods? Eur Radiol. [Sep 11]. [Epub ahead of print]. doi: 10.1007/s00330-017-5039-x
- Mauri G, Sconfienza LM. (2017). Percutaneous ablation holds the potential to substitute for surgery as first choice treatment for symptomatic benign thyroid nodules. Int J Hyperthermia 33:301–2.
- Mauri G, Cova L, Monaco CG, et al. (2017). Benign thyroid nodules treatment using percutaneous laser ablation (PLA) and radiofrequency ablation (RFA). Int J Hyperthermia 33:295–9.
- Mainini AP, Monaco C, Pescatori LC, et al. (2016). Image-guided thermal ablation of benign thyroid nodules. J Ultrasound 20:11–22.
- Morelli F, Sacrini A, Pompili G, et al. (2016). Microwave ablation for thyroid nodules: a new string to the bow for percutaneous treatments?. Gland Surg 5:553–8.
- Liu YJ, Qian LX, Liu D, Zhao JF. (2017). Ultrasound-guided microwave ablation in the treatment of benign thyroid nodules in 435 patients. Exp Biol Med (Maywood) 242:1515–23.
- Alexander EK, Marqusee E, Orcutt J, et al. (2004). Thyroid nodule shape and prediction of malignancy. Thyroid 14:953–8.
- Young-Sun K, Hyunchul R, Kyung T, et al. (2006). Radiofrequency ablation of benign cold thyroid nodules: initial clinical experience. Thyroid 16:361–7.
- Jeong WK, Baek JH, Rhim H, et al. (2008). Radiofrequency ablation of benign thyroid nodules: safety and imaging follow-up in 236 patients. Eur Radiol 18:1244–50.
- Song HT, Rhim H, Choi JB, et al. (2001). Radiofrequency thermal ablation of benign cystic lesions: an experimental pilot study in a porcine gallbladder model. J Korean Radiol Soc 2001:571–6.