
Abstract
Purpose: Previous studies have reported that parameters of dynamic contrast-enhanced ultrasound (DCE-US) could predict prognosis of hepatocellular carcinoma (HCC) patients after antiangiogenic therapies. In this study, we aimed to investigate the correlation of DCE-US parameters and the prognosis of HCC patients after microwave ablation (MWA).
Materials and methods: Between June 2012 and January 2018, a total of 35 HCC patients who received MWA with a curative intent were enrolled. Pre-ablation DCE-US, liver biopsy, CD34 staining, and vascular endothelial growth factor (VEGF) staining were performed. DCE-US parameters were extracted from time-intensity curves using SonoLiver software. The correlation of DCE-US parameters with histopathology results and overall survival (OS) were investigated.
Results: Quantitative analysis showed that IMAX, RT, TTP, and mTT of HCC were statistically different with that of reference liver parenchyma (all p < .001). Microvessel density was shown to be positively correlated with IMAX and negatively correlated with TTP (r = 0.755 and −0.647, both p < .01). Additionally, positive correlations were observed between IMAX and VEGF expression (r = 0.665, p < .01). After a median follow-up of 22 months (range 6–64 months), local recurrence was detected in three patients. Largest diameter and TTP were shown to help predict OS in univariate and multivariate analyses.
Conclusion: DCE-US parameter may help predict the outcome of HCC patients after MWA, though further study is still needed.
Introduction
According to the World Health Organization statistics, liver cancer is the second leading cause of cancer-related deaths, leading to approximately 745,000 cancer-related deaths each year [Citation1]. For early-stage hepatocellular carcinoma (HCC), surgical resection and ablation are regarded as curative therapies [Citation2]. However, according to the 2018 American Association for the Study of Liver Diseases (AASLD) guidelines, resection or ablation with a curative intent is associated with a five-year recurrence rate as high as 75% [Citation3]. Therefore, it is of great clinical implications to identify predictors for prognosis of HCC patients after resection or ablation.
Contrast-enhanced ultrasound (CEUS) could display the perfusion characteristics of liver lesions after bolus injection of ultrasound contrast agent [Citation4]. Nowadays, CEUS has been applied in the diagnosis of HCC [Citation5], guidance of liver-directed therapies [Citation6], and postoperative assessment of HCC patients [Citation7]. With the development of quantitative software, dynamic contrast-enhanced ultrasound (DCE-US) enables quantitative assessment of tumor perfusion through time-intensity curves [Citation8]. As to HCC, DCE-US has been reported to effectively differentiate HCC from other liver lesions [Citation9]. In addition, percentage variation of DCE-US has been reported to be predictive of tumor response and correlated with progression-free survival and overall survival (OS) of HCC patients after antiangiogenic therapies [Citation10,Citation11]. Therefore, DCE-US has been highlighted by the European Federation of Societies for Ultrasound in Medicine and Biology guidelines in the assessment of antiangiogenic therapies of HCC [Citation12].
In recent years, thermal ablation has been regarded as a promising therapy for HCC [Citation13]. Of different ablative techniques, microwave ablation (MWA) has developed into a popular modality for HCC due to its non-reliance on electrical conductivity, char resistance, reduced heat-sink effect, and simultaneous administration of multiple antennas [Citation14]. The therapeutic efficacy of MWA for HCC has been reported in our previous studies [Citation15,Citation16]. Though the predictive value of DCE-US has been evaluated thoroughly in HCC patients after antiangiogenic therapies, its prognostic value in HCC patients after thermal ablation remains poorly understood. In this study, we analyzed the correlation between DCE-US parameters and histopathological characteristics of HCC. Further, the prognostic value of DCE-US parameters for HCC patients after MWA was investigated.
Materials and methods
Study design
This prospective study received approval from the Chinese PLA General Hospital Institutional Review Board. All the patients who met the inclusion criteria were enrolled. The patients received DCE-US and ultrasound-guided liver biopsy before MWA. After liver biopsy, H&E staining, vascular endothelial growth factor (VEGF), and CD34 staining were performed. Time-intensity curves were obtained and DCE-US parameters were extracted. Correlation between DCE-US parameters and histopathology results of HCC was investigated. After MWA, all the patients were strictly followed up until the last examination. Local recurrence and survival outcomes were recorded. Univariate and multivariate analyses were performed to investigate whether DCE-US parameters could help predict prognosis of HCC patients after MWA.
Patients
Between June 2012 and January 2018, patients diagnosed as early-stage HCC who received MWA with a curative intent at the Department of Interventional Ultrasound, Chinese PLA General Hospital were included. In all the cases, the diagnosis of HCC was confirmed on the basis of the typical dynamic pattern of the tumor on contrast-enhanced imaging and liver biopsy. Inclusion criteria were as follows: (1) single lesion with a largest diameter of 5 cm; (2) absence of portal vein thrombosis or extrahepatic metastases; (3) platelet count no less than 50 × 109/mm3 and prothrombin activity no less than 50%; (4) a Karnofsky performance score of 70 or less. In addition to the above criteria, the target lesions should meet the following requirements for the following quantitative DCE-US analyses: vascularization (hyper-vascularization), size (>2 cm), percentage of necrosis (<50% of total tumor volume), and site (the best acoustic window which enables acquisition over 3 min without losing the tumor) [Citation17]. The exclusion criteria were as follows: (1) patients younger than 18 years old; (2) tumor inconspicuous on conventional ultrasound; (3) hypo-vascular lesions at CEUS examination. Each patient was informed of the technique and signed informed consent.
Pre-ablation DCE-US
The ultrasound examinations were performed with Acuson Sequia 512 equipped with contrast pulse sequencing software (Siemens Medical Solutions, Mountain View, CA). Ultrasound examinations were performed in three phases. First, the whole liver was scanned and the morphology and the optimum scanning plane of the target lesion were identified using conventional ultrasound. Subsequently, an intravenous bolus of 2.4 ml ultrasound contrast agent (SonoVue; Bracco, Milan, Italy) was injected and then a flush of 5 ml normal saline was followed. Real-time CEUS was started at the same time with the bolus injection using a low mechanical index of 0.08. The whole vascular phase of liver CEUS consisted of the arterial phase, the portal venous phase, and the late phase according to the WFUMB-EFSUMB guidelines [Citation4]. The investigators who performed CEUS (Y.Z. and F.B.Z.) had five and four years’ experience in CEUS, respectively. The ultrasonic parameters (gain, depth, and scanning plane) were consistent for the same patient at different time points. Enhancement pattern of each tumor was observed and a dynamic sequence of three minutes or more was recorded.
Quantification of DCE-US parameters
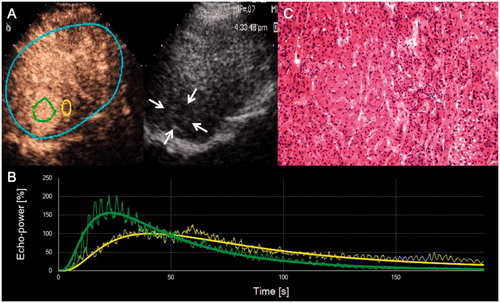
DCE-US quantification was performed using SonoLiver software (TomTec Imaging Systems, Unterschleissheim, Germany) and time-intensity curves of all the enrolled patients were obtained. One region of interest (ROI) of tumor was defined within HCC and the other ROI was defined in the peripheral liver parenchyma near the same depth (reference ROI) (). Five perfusion parameters were extracted from time-intensity curves, including IMAX (maximum intensity within the analysis regions of interest in the lesion as well as that in the reference liver parenchyma), RT (rise time, time from 10–90% of IMAX), TTP (time to peak), mTT (mean transit time, time from contrast agent wash-in to 50% wash-out), and QOF (quality of fit between raw data and theoretical curve). Quantifications were performed off-line by two skillful operators (Y.Z. and F.B.Z.), and quantitative disagreements between operators were settled by consensus.
Figure 1. Representative CEUS images, time-intensity curves, and corresponding hematoxylin and eosin staining of HCC. (A) Native CEUS images show hyper-enhancement of the hypoechoic liver lesion in the arterial phase (25 s) of CEUS. Two ROIs are drawn for the following quantitative analysis: an analysis ROI (on the left) in the liver lesion and a reference ROI (on the right) in the peripheral parenchyma. (B) Output time–intensity curves of the liver lesion (curve with a higher peak value) and the reference (curve with a lower peak value). (C) Pathological result indicates well-differentiated HCC.
Percutaneous ultrasound-guided MWA
Before MWA, all the enrolled patients received liver biopsy under ultrasound guidance. Percutaneous ultrasound-guided MWA was performed by two experienced interventional radiologists (X.L.Y. and P.L., each with 23 years of experience). A cooled-shaft microwave system (KY-2000, Kangyou Medical, Nanjing, China) was applied. This MWA system could produce a maximum output of 100 watts at a frequency of 2450 MHz. Twenty-gauge thermocouple needles were inserted into the designated location to monitor the real-time temperature throughout the procedure. Then antennas were percutaneously inserted into the tumor under ultrasound guidance after intravenous anesthesia. If the temperature measured at the designated location remained at 50.0–54.0 °C for ≥3 min, or had reached 60.0 °C, microwave emission was stopped. The needle track was cauterized during withdrawal of the antennas to avoid bleeding and tumor seeding. CEUS was performed immediately after MWA to assess whether tumor inactivation was complete with a safety-margin of 5.0–10.0 mm. Additional MWA sessions were performed if incomplete ablation was detected.
Follow-up
MWA-related complications and side effects were recorded according to the standardization of terminology and reporting criteria for image-guided tumor ablation proposed by Ahmed et al. [Citation18]. All the patients were strictly followed up after MWA. Contrast-enhanced computed tomography (CT) scans were performed 1, 3, 6, 9, and 12 months after MWA. Thereafter, contrast-enhanced CT was performed at a 3–6-month interval. Blood routine, liver function, and tumor markers were examined at the same time. Follow-up period was defined as the time from MWA to the most recent follow-up imaging. Local recurrence was diagnosed as viable tumor inside or abutting the ablation zone during follow-up at least one month after MWA. OS was defined as the time from MWA to death.
Histopathology analysis
Liver biopsies were fixed in formalin and embedded in paraffin. Tissue sections with 5-µm thickness were prepared for histopathology analysis. VEGF and CD34 staining were performed according to the instructions of the manufacture (ZSGB-BIO, Beijing, China, 1:100 dilution). In the negative controls, phosphate-buffered saline was applied as a replacement of primary antibodies. Microvessel density (MVD) was calculated based on the Weidner counting method [Citation19]. The CD34-stained sections were first scanned using a low-power microscope (×40) to determine the areas with greatest CD34 positive density. Then individual MVD was calculated as the mean value of the microvascular counts of the five different fields under a high-power microscope (×200). VEGF positive expression was defined as ≥30% cells with membrane and cytoplasm staining, whereas <30% cells with membrane and cytoplasm staining were considered as negative expression.
Statistical analysis
Statistical analysis was performed by using the SPSS 22.0 software (SPSS Inc., Chicago, IL) . Correlations between histopathology results and DCE-US parameters were analyzed. For normally distributed data, the Pearson correlation analysis was performed. For those with non-normal distributions, the Spearman rank correlation analysis was performed. The OS curves were described using the Kaplan–Meier method and compared with log-rank test. Univariate and multivariable analyses were performed to identify the independent predictors for OS. The parameters included in univariate and multivariate analyses for OS included age, gender, etiology, liver cirrhosis, Child-Pugh classification, Karnofsky performance score, alpha-fetoprotein, largest diameter, grade of differentiation, lesion distribution, and DCE-US parameters. A p values less than .05 was considered significant.
Results
Clinico-pathological characteristics of enrolled patients
Between June 2012 and January 2018, a total of 35 HCC patients who met inclusion criteria were enrolled in this study, including 28 male patients and 7 female patients. The clinico-pathological parameters of the patients are shown in . Liver cirrhosis was observed in 21 patients. Pre-ablation Child-Pugh classification was as follows: 24 patients had class A disease, 7 had class B disease, and four had class C disease. The mean alpha-fetoprotein was 90.4 ± 148.7 µg/mL (range 1.09–650.7 µg/mL). Sixteen HCC lesions were located in the left lobe and 19 were located in the right lobe, with a mean largest diameter of 3.3 ± 0.7 cm (range 2.2–4.9 cm). Eleven, 21, and 3 patients were pathologically diagnosed as well-differentiated, moderately differentiated, and poorly differentiated HCC, respectively. Histopathology results showed that the mean MVD of HCC was 58.4 ± 23.8 (range 37–140) and positive VEGF expression was detected in 27 patients (77.1%).
Table 1. Clinico-pathological characteristics of enrolled HCC patients (n = 35).
Ablation results
One MWA procedure was performed in 26 patients, and two in 9 patients. Thirty-three patients (94.3%) achieved technical success according to contrast-enhanced CT one month after initial MWA. Additional MWA was performed in the remaining two patients who manifested with a remaining tumor on contrast-enhanced CT. No MWA-related mortality, major or minor complications were detected. Supportive care was performed in six patients who reported abdominal pain (n = 4) and transient fever (n = 2).
Parameters of DCE-US
During the DCE-US scan, all the 35 HCC lesions showed rapid enhancement in the arterial phase. Quantitative parameters in ROI of HCC, as well as reference liver parenchyma, are summarized in . The QOF of ROI in all the HCC and reference liver parenchyma was higher than 80%. The QOF of ROIs in HCC and the corresponding reference liver parenchyma were 85.9 ± 4.6% (range 80.4–89.7%) and 86.5 ± 4.0% (range 80.7–90.4%, p = .56), respectively. Based on the assumption that the IMAX of related reference liver parenchyma was 100%, the IMAX of HCC lesions were significantly higher than that of reference liver parenchyma (p < .001). As shown in , the RT, TTP, and mTT were significantly shorter than that of reference liver parenchyma (all p < .001).
Table 2. DCE-US parameters in the regions of interest of 35 HCCs and reference liver parenchyma.
Correlations of DCE-US parameters and histopathology results
After correlation analysis, MVD was shown to be positively correlated with tumor IMAX (r = 0.755, p < .01) and negatively correlated with tumor TTP (r = −0.647, p < .01). There appeared to be no linear correlation between the remaining quantitative parameters and MVD. Additionally, positive correlations were observed between tumor IMAX and VEGF expression (r = 0.665, p < .01). And no linear correlation was observed between other quantitative parameters and VEGF expression.
Recurrence and survival outcomes
After a median follow-up of 22 months (range 6–64 months), local recurrence were observed in 3 patients (8.6%). Two patients received transarterial chemoembolization and one patient received liver surgery for local recurrence. DCE-US parameters of patients with and without local recurrence are listed in . The median OS was 47 months (95.0% confidence interval [CI]: 38–56), with 1-, 3-, and 5-year OS rates of 91.3%, 67.3%, and 56.1%, respectively.
Table 3. Pre-ablation DCE-US parameters of HCC patients with and without local recurrence after MWA.
Prognostic analyses of OS
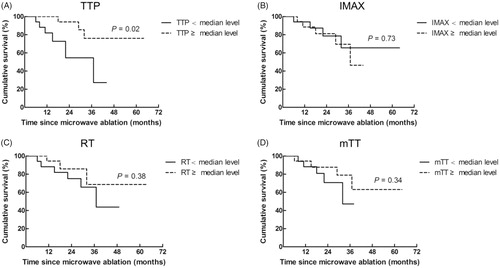
In univariate analyses, largest diameter and tumor TTP showed significant prognostic value for OS (HR: 0.034, 95.0% CI: 0.002–0.621, p = .02 and HR: 0.05, 95.0% CI: 0.004–0.72, p = .02, respectively). In the multivariate analysis, largest diameter and tumor TTP were confirmed as independent predictors of OS after adjustment for other potential prognostic factors (HR: 0.22, 95.0% CI: 0.053–0.916, p = .04; HR: 0.20, 95.0% CI: 0.04–0.98, p = .03, respectively). OS outcomes of HCC patients according to different levels of DCE-US parameters are displayed in . Though the above prognostic analyses revealed correlation between DCE-US parameters and OS, due to the small sample size of this study, the results still need further verification based on a large cohort study.
Figure 2. OS of HCC patients according to different levels of DCE-US parameters. (A) Patients with a TTP lower than median level (11.7 s) showed significantly worse OS outcomes than those with a median level or higher (p = .02). (B) Patients with an IMAX lower than median level (168%) showed comparable OS outcomes than those with a median level or higher (p = .73). (C) Patients with an RT lower than median level (11.1 s) showed comparable OS outcomes than those with a median level or higher (p = .38). (D) No significant difference of OS was observed between patients with an mTT lower than median level (63 s) and those with a median level or higher (p = .34).
Discussion
In this study, IMAX, RT, TTP, and mTT of HCC were significantly different with that of reference liver parenchyma. DCE-US parameters of HCC were correlated with MVD (IMAX and TTP) and VEGF expression (IMAX). Univariate and multivariate analyses showed that largest diameter and tumor TTP may help predict OS of HCC patients after MWA, though further research is still needed.
According to the world cancer statistics, liver cancer ranks the fifth most common cancer and the second leading cause of cancer-related deaths [Citation1]. Unlike other cancers, HCC diagnosis is mainly based on its typical contrast-enhanced imaging (hypervascular in the arterial phase with wash-out in the portal venous or late phase) [Citation20]. Previous studies have revealed that CEUS could characterize the microvascular characteristics of focal liver lesions through administration of microbubble ultrasound contrast agents. In addition to the diagnostic value, CEUS is playing important roles in the assessment of therapeutic responses of HCC. It is reported that CEUS could evaluate the intra-tumor vascularization of HCC after antiangiogenic treatment [Citation21], ablative therapies [Citation22], and transarterial chemoembolization [Citation23].
With the development of quantitative software, DCE-US has been utilized in the quantification of solid tumor perfusion [Citation8]. Through the time-intensity curves built up from raw linear data, DCE-US parameters were extracted, including IMAX, RT, TTP, mTT, and QOF. These parameters provide information about blood volume and blood flow, and have been compared between HCC and non-HCC liver lesions. Different studies have reported that DCE-US could reflect the perfusion characteristics and differentiate HCC from intrahepatic cholangiocarcinoma [Citation24], focal nodular hyperplasia [Citation25], and metastatic liver cancer [Citation26]. In this study, four of the DCE-US parameters (IMAX, RT, TTP, and mTT) were significantly different between HCC and reference liver parenchyma. This reflects the different perfusion features between HCC and reference liver parenchyma, and was consistent with previous studies [Citation26,Citation27].
In addition to the reflection of perfusion features, DCE-US has been reported to correlate with histopathological characteristics of HCC, including grade of differentiation [Citation27], portal vein thrombosis [Citation28], unpaired arteries [Citation29], MVD [Citation30], and VEGF expression [Citation31]. Choi and colleagues established three rat hepatoma models and showed that MVD was positively correlated with IMAX and negatively correlated with mTT and TTP [Citation32]. Tian and Wang enrolled 106 HCC patients and demonstrated that MVD was correlated with peak intensity, increased signal intensity, area under the curve, and blood flow of HCC [Citation30]. In our research, MVD was shown to be positively correlated with IMAX and negatively correlated with TTP. As to VEGF expression, a previous study revealed that one of DCE-US parameters (fade time) was correlated with VEGF expression [Citation31]. While in this study, positive correlations were observed between tumor IMAX and VEGF expression. It is hypothesized that the difference may be attributed to the different quantitative software used in the studies. However, a further study with a larger cohort is still needed as the number the patient of this study is very small.
Previous studies have demonstrated that DCE-US parameters could predict therapeutic efficacy of HCC patients after antiangiogenic treatment [Citation10,Citation11]. In advanced HCC patients, a series of studies have reported that DCE-US parameters are predictive of tumor response, progression-free survival, and OS after different targeted therapies, including bevacizumab [Citation11], sorafenib [Citation33], and axitinib [Citation34]. In addition to early prediction of tumor response, DCE-US parameters were shown to be strongly correlated with major adverse events of HCC patients after sorafenib treatment [Citation35]. To the best of our knowledge, it remains unknown whether DCE-US parameters could help predict prognosis of HCC patients after MWA. In the univariate and multivariate analyses, largest diameter was confirmed as predictors for OS after MWA, in accordance with our previous research [Citation14,Citation15]. TTP, which is related to blood flow of solid tissues, was shown to help predict OS of HCC patients after MWA in this research. Though MWA has less heat-sink effect compared with radiofrequency ablation, the heat loss during MWA by blood flow should be taken into account when considering the therapeutic effectiveness [Citation36]. A recent study found that during MWA, maximum temperature decreased significantly with increasing flow [Citation37]. Thus, it was hypothesized that a short TTP reflects fast blood flow and it may impact the effectiveness of MWA and thus finally the prognosis of HCC patients. However, due to the small sample size of this study, the correlation was still not conclusive and this result needs further validation.
Our study has several limitations. First, the number of HCC patients is small and thus more patients will be enrolled in our future work for a more unbiased result. Second, due to the high attenuation of ultrasound, imaging of deeply located liver lesions might be obscure. Lastly, two-dimensional images were obtained in this study and they could only manifest a single plane of the tumor. Thus, three-dimensional images will be obtained in our future research for a more comprehensive analysis.
Conclusions
Taken together, our study revealed that pre-ablation DCE-US parameter may help predict the outcome of HCC patients after MWA, though further study is still needed.
Acknowledgments
The authors would like to thank all the participants of the Department of Interventional Ultrasound, Chinese PLA General Hospital, for their valuable contributions.
Disclosure statement
No potential conflict of interest was reported by the authors.
Additional information
Funding
Related Research Data
References
- Ferlay J, Soerjomataram I, Dikshit R, et al. Cancer incidence and mortality worldwide: sources, methods and major patterns in GLOBOCAN 2012. Int J Cancer. 2015;136:E359–E386.
- Forner A, Llovet JM, Bruix J. Hepatocellular carcinoma. Lancet. 2012;379:1245–1255.
- Heimbach JK, Kulik LM, Finn RS, et al. AASLD guidelines for the treatment of hepatocellular carcinoma. Hepatology. 2018;67:358–380.
- Claudon M, Dietrich CF, Choi BI, et al. Guidelines and good clinical practice recommendations for contrast enhanced ultrasound (CEUS) in the liver–update 2012: a WFUMB-EFSUMB initiative in cooperation with representatives of AFSUMB, AIUM, ASUM, FLAUS and ICUS. Ultraschall Med. 2013;34:11–29.
- Terzi E, Iavarone M, Pompili M, et al. Contrast ultrasound LI-RADS LR-5 identifies hepatocellular carcinoma in cirrhosis in a multicenter restropective study of 1,006 nodules. J Hepatol. 2018;68:485–492.
- Kim EJ, Kim YS, Shin SK, et al. Contrast-enhanced ultrasound-guided radiofrequency ablation in inconspicuous hepatocellular carcinoma on B-mode ultrasound. Turk J Gastroenterol. 2017;28:446–452.
- Zhong J, Su Z, Zhang Y, et al. Contrast-enhanced ultrasonography versus contrast-enhanced computed tomography for assessment of residual tumor from hepatocellular carcinoma treated with transarterial chemoembolization: a meta-analysis. J Ultrasound Med. 2018. [Epub ahead of print]. doi: 10.1002/jum.14534.
- Frohlich E, Muller R, Cui XW, et al. Dynamic contrast-enhanced ultrasound for quantification of tissue perfusion. J Ultrasound Med. 2015;34:179–196.
- Wildner D, Pfeifer L, Goertz RS, et al. Dynamic contrast-enhanced ultrasound (DCE-US) for the characterization of hepatocellular carcinoma and cholangiocellular carcinoma. Ultraschall Med. 2014;35:522–527.
- Zocco MA, Garcovich M, Lupascu A, et al. Early prediction of response to sorafenib in patients with advanced hepatocellular carcinoma: the role of dynamic contrast enhanced ultrasound. J Hepatol. 2013;59:1014–1021.
- Lassau N, Koscielny S, Chami L, et al. Advanced hepatocellular carcinoma: early evaluation of response to bevacizumab therapy at dynamic contrast-enhanced US with quantification-preliminary results. Radiology. 2011;258:291–300.
- Dietrich CF, Averkiou MA, Correas JM, et al. An EFSUMB introduction into Dynamic Contrast-Enhanced Ultrasound (DCE-US) for quantification of tumour perfusion. Ultraschall Med. 2012;33:344–351.
- Kang TW, Rhim H. Recent advances in tumor ablation for hepatocellular carcinoma. Liver Cancer. 2015;4:176–187.
- Liang P, Yu J, Yu XL, et al. Percutaneous cooled-tip microwave ablation under ultrasound guidance for primary liver cancer: a multicentre analysis of 1363 treatment-naive lesions in 1007 patients in China. Gut. 2012;61:1100–1101.
- Yu J, Liang P, Yu XL, et al. Local tumour progression after ultrasound-guided microwave ablation of liver malignancies: risk factors analysis of 2529 tumours. Eur Radiol. 2015;25:1119–1126.
- Liu F, Yu X, Cheng Z, et al. Comparison of ultrasonography-guided percutaneous microwave ablation for subcapsular and nonsubcapsular hepatocellular carcinoma. Eur J Radiol. 2017;91:93–98.
- Lassau N, Chapotot L, Benatsou B, et al. Standardization of dynamic contrast-enhanced ultrasound for the evaluation of antiangiogenic therapies: the French multicenter support for innovative and expensive techniques study. Invest Radiol. 2012;47:711–716.
- Ahmed M, Solbiati L, Brace CL, et al. Image-guided tumor ablation: standardization of terminology and reporting criteria – a 10-year update. Radiology. 2014;273:241–260.
- Weidner N, Semple JP, Welch WR, et al. Tumor angiogenesis and metastasis-correlation in invasive breast carcinoma. N Engl J Med. 1991;324:1–8.
- European Association for the Study of the Liver, European Organisation for Research and Treatment of Cancer. EASL-EORTC clinical practice guidelines: management of hepatocellular carcinoma. J Hepatol. 2012;56:908–943.
- Shiozawa K, Watanabe M, Ikehara T, et al. Therapeutic evaluation of sorafenib for hepatocellular carcinoma using contrast-enhanced ultrasonography: preliminary result. Oncol Lett. 2016;12:579–584.
- Du J, Li HL, Zhai B, et al. Radiofrequency ablation for hepatocellular carcinoma: utility of conventional ultrasound and contrast-enhanced ultrasound in guiding and assessing early therapeutic response and short-term follow-up results. Ultrasound Med Biol. 2015;41:2400–2411.
- Wobser H, Wiest R, Salzberger B, et al. Evaluation of treatment response after chemoembolisation (TACE) in hepatocellular carcinoma using real time image fusion of contrast-enhanced ultrasound (CEUS) and computed tomography (CT)-preliminary results. Clin Hemorheol Microcirc. 2014;57:191–201.
- Chen LD, Xu HX, Xie XY, et al. Intrahepatic cholangiocarcinoma and hepatocellular carcinoma: differential diagnosis with contrast-enhanced ultrasound. Eur Radiol. 2010;20:743–753.
- Pei XQ, Liu LZ, Xiong YH, et al. Quantitative analysis of contrast-enhanced ultrasonography: differentiating focal nodular hyperplasia from hepatocellular carcinoma. Br J Radiol. 2013;86:20120536.
- Yue WW, Wang S, Xu HX, et al. Parametric imaging with contrast-enhanced ultrasound for differentiating hepatocellular carcinoma from metastatic liver cancer. Clin Hemorheol Microcirc. 2016;64:177–188.
- Pei XQ, Liu LZ, Liu M, et al. Contrast-enhanced ultrasonography of hepatocellular carcinoma: correlation between quantitative parameters and histological grading. Br J Radiol. 2012;85:e740–e747.
- Wang Z, Liu G, Lu MD, et al. Role of portal vein tumor thrombosis in quantitative perfusion analysis of contrast-enhanced ultrasound of hepatocellular carcinoma. Ultrasound Med Biol. 2015;41:1277–1286.
- Pei XQ, Liu LZ, Zheng W, et al. Contrast-enhanced ultrasonography of hepatocellular carcinoma: correlation between quantitative parameters and arteries in neoangiogenesis or sinusoidal capillarization. Eur J Radiol. 2012;81:e182–e188.
- Tian H, Wang Q. Quantitative analysis of microcirculation blood perfusion in patients with hepatocellular carcinoma before and after transcatheter arterial chemoembolisation using contrast-enhanced ultrasound. Eur J Cancer. 2016;68:82–89.
- Yang YL, Yang RJ, Liu X, et al. Correlations between the time-intensity parameters of contrast-enhanced ultrasound and clinical prognosis of hepatocellular carcinoma. Clin Imaging. 2013;37:308–312.
- Choi JW, Kim JH, Kim HC, et al. Comparison of tumor vascularity and hemodynamics in three rat hepatoma models. Abdom Radiol (NY). 2016;41:257–264.
- Sacco R, Mismas V, Romano A, et al. Assessment of clinical and radiological response to sorafenib in hepatocellular carcinoma patients. World J Hepatol. 2015;7:33–39.
- Lo GM, Al Zahrani H, Jang HJ, et al. Detection of early tumor response to axitinib in advanced hepatocellular carcinoma by dynamic contrast enhanced ultrasound. Ultrasound Med Biol. 2016;42:1303–1311.
- Sugimoto K, Moriyasu F, Saito K, et al. Hepatocellular carcinoma treated with sorafenib: early detection of treatment response and major adverse events by contrast-enhanced US. Liver Int. 2013;33:605–615.
- Yu NC, Raman SS, Kim YJ, et al. Microwave liver ablation: influence of hepatic vein size on heat-sink effect in a porcine model. J Vasc Interv Radiol. 2008;19:1087–1092.
- Ringe KI, Lutat C, Rieder C, et al. Experimental evaluation of the heat sink effect in hepatic microwave ablation. PLoS One. 2015;10:e0134301.