
 ?Mathematical formulae have been encoded as MathML and are displayed in this HTML version using MathJax in order to improve their display. Uncheck the box to turn MathJax off. This feature requires Javascript. Click on a formula to zoom.
Abstract
Three different magnetic resonance imaging (MRI) coils were developed and assessed for use with an experimental platform designed to generate hyperthermia in mice using magnetic resonance-guided focused ultrasound (MRgFUS). An ergonomic animal treatment bed was integrated with MRI coils. Three different coil designs optimized for small targets were tested, and performance in targeting and conducting accurate temperature imaging was evaluated. Two transmit/receive surface coils of different diameters (4 and 7 cm) and a transmit-only/receive-only (TORO) coil were used. A software platform was developed to provide real-time targeting and temperature maps and to deliver controlled ultrasound exposure. MR thermometry was conducted on different targets, including fresh chicken breasts and mouse cadavers. Multiple experiments were performed in which tissues were targeted with high reproducibility. The TORO coil was the most resilient to temperature drift, resulting in an increase in the calculated temperature of 0.29 ± 0.12 °C, compared to 1.27 ± 0.13 °C and 0.47 ± 0.04 °C for the medium and small coils, respectively. Controlled closed-loop hyperthermia exposure was successfully performed with all three coils. Considering all assessments, the TORO coil exhibited the best overall performance for thermometry acquisition when accounting for stability, precision, temperature spread and resilience to temperature drift. B1 maps of the three coils confirmed that the TORO coil exhibited the most homogeneous B1 field, which explained the improved thermometry performance. The use of coils specifically designed for small targets within the proposed experimental platform allowed accurate thermometry during hyperthermia.
Introduction
Hyperthermia is a therapeutic technique in which a body is subjected to mild increases in temperature (41–45 °C) for an extended length of time (15–90 min) [Citation1–5]. An increase in temperature affects many biological phenomena, including blood flow oxygenation and the permeability of nanoparticles [Citation1, Citation6]. In phase III clinical trials, hyperthermia has been demonstrated to increase the efficacy of radiotherapy and chemotherapy [Citation3,Citation5,Citation7,Citation8].
Achieving localized hyperthermia for preclinical testing in small animal models is often challenging because of small target volumes and the need to maintain temperatures within a narrow range for an extended length of time. Furthermore, difficulties arise in live animals as a result of heat dissipation due to perfusion. However, such testing is a valuable tool for the development and eventual translation of hyperthermia as a therapeutic option.
Focused ultrasound (FUS) can be used to increase the temperature in a localized target volume. In FUS, high-energy ultrasound waves are used to deposit energy deep within a target volume of tissue with high spatial accuracy while minimizing side effects to the surrounding tissue [Citation9]. FUS is performed using imaging guidance, through techniques such as magnetic resonance imaging (MRI) and ultrasound [Citation10–13].
MRI is well suited to guide the deposition of energy from FUS into tissues. This technique is often referred to as magnetic resonance-guided focused ultrasound (MRgFUS) [Citation14]. MRI can accurately monitor increases in temperature in real time using the proton resonance frequency shift (PRF) method [Citation15]. Because of its high spatial resolution, excellent soft tissue contrast and ability to monitor temperature, MRI is accepted by regulatory bodies as the preferred method for the guidance of FUS. MRgFUS is clinically approved for many ablative treatments for symptomatic uterine fibroids and the palliation of bone metastases, and other methods involving MRgFUS are in development [Citation10,Citation11,Citation16–18].
Although clinical MRgFUS systems are available, these systems are not well suited for experiments with small animals [Citation19]. Hence, a need for small animal-specific systems remains, particularly, for achieving relatively small increases in temperature, such as those required for hyperthermia. A number of animal-specific systems have been described in the literature [Citation19–22]. Ellens and Partanen [Citation22] have reviewed various preclinical systems that have been developed to improve MRgFUS and its translation into clinical practice. Bing et al. [Citation19] reported an animal-specific system and demonstrated long-duration hyperthermia in rats on a clinical scanner. Hijnen et al. [Citation21] proposed the use of an FUS and MRI system designed for application in humans that includes a small animal adapter to achieve ablation and hyperthermia in rats. Chopra et al. [Citation20] employed a clinical MR system with a computer-controlled three-axis positioning system to deliver FUS for ablation purposes. These systems allow the application of MRgFUS in small animals; however, they have not been optimized for use in mice subjected to long periods of hyperthermia in clinical MRI scanners. Additionally, the water volumes used in tanks for FUS exposure result in a high load on MRI coils that may degrade imaging because of the lack of matching and tuning of the coils under these loading conditions [Citation22]. Our work focuses on the use of RF coils that are designed for the specific loading conditions and small targets to accurately map temperature over long periods of time in a clinical scanner. Tailored selection of parameters for MR thermometry may also improve the accuracy of temperature mapping for hyperthermia in small targets.
The purpose of our study was to evaluate the performance of three different RF coils that were designed to monitor and control the temperature in small animals during MRgFUS hyperthermia in a 3-T MRI clinical scanner. This system is based on a previous MRgFUS platform used for ablation [Citation23]. The previous system presented some drawbacks resulting from challenging and nonreproducible positioning of the animals as well as poor signal-to-noise ratios (SNRs) in the targeting images. The system described herein integrates ergonomic animal positioning beds specifically designed for mice with an MRI-compatible 3D transducer positioning system designed for large-bore MRI scanners. Three custom MRI coils were designed and integrated into the beds to allow simultaneous localization of the animal and the transducer. The system is controlled using a software platform that was developed in-house for accurate temperature mapping and control and interfaces with the MRI scanner and the motors used for transducer movement. The performance of the proposed MRgFUS system was evaluated using tissues, phantoms and mouse cadavers.
Materials and methods
Platform and coil design
An ergonomic mouse bed that allows the placement of a mouse under anesthesia with its flank facing a transducer for exposure to FUS was designed. The bed allows the placement of the mouse on its left or right flank and includes a mask for the delivery of anesthetic that can be adjusted as required to fit mice ranging from 15 g to 35 g. The bed has side attachments that allow the placement of various custom MRI coils either above or below the mouse. The mouse bed is mounted on top of the water tank where the FUS transducer is placed in a 3D positioning system. MRI coils placed under the treatment bed allow simultaneous localization of the transducer and the mouse. Positioning the coils in proximity to the mouse provided high SNR images of the location of the transducer and animal as well as MR thermometry.
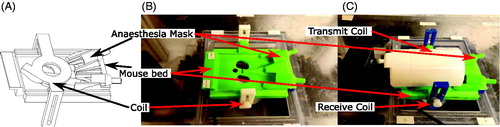
Three MRI coils were developed: a small 4-cm-diameter transmit/receive (T/R) surface coil, a medium 7-cm-diameter T/R surface coil and a transmit-only/receive-only (TORO) coil. The TORO coil was composed of a 4-cm-diameter receive surface coil placed under the treatment bed and a half-birdcage transmit coil placed over the mouse (). The MRI coils were built using circuit boards printed in-house and nonmagnetic ceramic capacitors (DKD1111P05–100B, Passive Plus). The coils were tuned for use at 3T using a network analyzer (8751 A, 5 Hz – 500 MHz, Hewlett Packard) and then sealed in custom 3D-printed casings to render them waterproof.
Figure 1. Ergonomic mouse treatment bed mounted in the FUS treatment tank. The custom RF coil can be mounted below (B) or above (A) the bed. The transducer (not shown in the figure) is placed below the mouse treatment bed and immersed in water. The transmit-only/receive-only (TORO) coil is mounted on the treatment bed (C) with the transmit-only half-birdcage coil over the mouse and the receive-only surface coil below.
A 1-MHz FUS transducer was built using modified lead zirconate titanate (PZT) composite crystal (DL47, DeL Piezo Specialties, West Palm Beach, FL). The crystal geometry was a spherical cap focalized at 50 mm with a diameter of 32 mm. The transducer was air-backed and mounted in a polyvinyl chloride (PVC) casing. Matching of the transducer to 50 Ω was achieved using an LC network.
The acoustic beam for the transducer was simulated through the 2D implementation of the staggered-grid finite-difference time-domain (FDTD) viscoelastic model [Citation24,Citation25]. The model was implemented using fourth order in space and second order in time derivative operators to minimize the effects of numerical dispersion [Citation26–28]. The direction of ultrasound propagation was referred to as the z-axis, and the x- and y-axes represented the perpendicular plane. The full width at half maximum (FWHM) of the transducer was determined as the width of the beam at which −6 dB of the maximum intensity occurred. The computational domain was a region 8 cm in length along both x and z with a 0.05-mm spatial resolution and was occupied by water with a wave speed of 1482 m/s and a density of 1000 kg/m3.
Experimental characterization of the transducer was performed in a degassed and deionized water tank. The transducer was centered facing a 0.2-mm needle hydrophone (SN1752, Precision Acoustics, Dorset, UK). The transducer was driven in burst mode (20 pulses per burst) at a frequency of 1 MHz with a burst repetition rate of 500 Hz using a function generator (WS 8101, Tabor Electronics, Israel). The hydrophone was mounted on a computer-controlled 3D robotic arm (UMS2, Precision Acoustics, Dorset, UK), and the signal obtained from the hydrophone was digitized using an oscilloscope (WaveRunner 62Xi-A, LeCroy, Chestnut Ridge, NY). Two-dimensional (x, y) and (x, z) measurements ±10 mm around the focus were acquired at a spatial resolution of 0.25 mm.
Thermometry calculation
A software platform [Citation29] was developed and used to control a 3T MRI scanner (Achieva, Philips, Best, The Netherlands), to provide real-time imaging targeting and thermal maps. This software platform uses a library written in the Python language (Proteus MRI-HIFU Software Development Suite, Calgary, AB, Canada) and was adapted to employ real-time image-guided positioning of the FUS transducer using a 2D motorized system and to perform closed-loop controlled exposure for hyperthermia delivery. Spin-lattice relaxation (T1)-weighted single-slice echo planar images with fat suppression were used for temperature monitoring in a coronal orientation, with the image centered at the focal point of the FUS transducer. The software platform displayed real-time coronal temperature maps that were calculated using these images and the PRF shift method described in EquationEquation (1)(1)
(1) [Citation15] as follows:
(1)
(1)
where ϕ(t) is the phase map at a given time, t; ϕ(t0) is the phase map at a reference time, t0, with a known temperature; B0 is the strength of the magnetic field; TE is the echo time; α is the PRF-change coefficient and γ is the gyromagnetic ratio. To avoid artifacts in voxels with high oscillating phase values due to low SNR, the temperature values were displayed and considered for use only in calculations in the regions of the temperature map that exhibited temperature uncertainty, i.e., μT, of less than 2 °C based on EquationEquation (2)
(2)
(2) :
(2)
(2)
Here, M and σM are the magnitude map at t and the standard deviation of the difference of the magnitude maps, M(t) − M(t0), respectively [Citation30].
Drift in thermometry is caused by variations in the magnetic field over time and results in incorrect temperature calculations. To compensate for this drift, a baseline nonheated region was defined as the pixels outside of a 10-mm-radius circle centered at the transducer focus. The simplest drift correction is performed by subtracting the average baseline value from the calculated temperature change [Citation31]. For longer exposure times, such as those used in hyperthermia, additional spatial variations in the background phase drift accumulate and are well described by second-order polynomial functions [Citation32]. A second-order spatial-temporal compensator was used to perform drift correction using EquationEquation (3)(3)
(3) :
(3)
(3)
where an is the coefficient that minimizes the variation of φ(t) − φ(t0) over time caused by the magnetic field. an were coefficients calculated via a least-squares minimization process using voxels in the nonheated region that fulfilled the criterion of a μT less than 2 °C.
Thermometry assessment
To assess the quality of the thermal maps obtained for the different coils, quantitative criteria were defined and used to compare performance. These criteria were divided into two categories: image and thermometry quality. Calculations were performed within a circular region of interest (ROI) centered at the transducer focus in the coronal plane with a radius of 3 mm. Only pixels that fulfilled the criterion of a μT less than 2 °C were considered in the calculations.
Image quality
Pixels above the threshold. The number of pixels in the nonheated region influences the quality of the thermal maps because they provide the data for drift correction. This value is strongly influenced by the size of the target as well as by the radius of the MRI coil used. The sensitivity of the surface coils decreases significantly beyond a distance equal to the radius of the coil. Therefore, increasing the coil diameter results in an increased number of pixels above the threshold.
SNR outside and inside the drift correction region. SNR was calculated by dividing the average signal intensity outside and inside the specified 10-mm-radius circle used for drift correction by the standard deviation of a region of noise. A high SNR results in an image quality that allows accurate targeting and can yield more accurate thermometry by providing a stronger signal for thermal map calculations. Smaller coils are expected to result in an increased SNR compared to large ones [Citation33].
Phase variability. The PRF method uses changes in phase among the images to calculate relative temperature change. When there is no temperature change, the phase should not change over time, except for the drift in the magnetic field. Certain coils may be better configured to correct for phase drift, which can be quantified by observing phase variability over time in the absence of any temperature change. Based on the phase component of the images used for thermometry calculations, the standard deviation over time for each voxel within the ROI was calculated to create a standard deviation map. The average of this map was then used to calculate phase variability. A low value of phase variability indicates an unchanging phase over time in the absence of temperature change and should, therefore, result in more accurate temperature calculations.
Magnitude variability. The temperature uncertainty, μT, is used to avoid artifacts caused by highly oscillating phase values in low-SNR regions. When there is large temporal variability in magnitude in the thermometry images, the uncertainty will increase (EquationEquation (2)(2)
(2) ). The standard deviation over time for each voxel within the ROI was obtained from the magnitude component in the images used for the thermometry calculations and then employed to create a map. The average of this map was defined as the magnitude variability, for which a low value indicates a high likelihood of the temperature uncertainty remaining constant over time within the ROI.
Thermometry quality
The thermometry quality criteria were calculated using the thermal maps obtained using the PRF method.
Stability. Stability in the thermal maps was defined as the temporal average of the spatial standard deviation within the ROI. The spatial standard deviation is expected to be low when all of the voxels have the same temperature. A low average over time for this standard deviation indicates that the temperature calculation remains steady. A low value of stability reflects a steady temperature calculation in a homogenous temperature region.
Precision. Precision was defined in the thermal maps as the temporal standard deviation of the spatial average temperature within the ROI. When no temperature change is expected, the spatial average temperature will have a value, that is, close to the baseline temperature. Because there is no temperature change, this temperature value remains the same over time, and a low standard deviation reflects this steady situation. A low precision value indicates that the calculated temperature remains accurate for the entirety of the time during which thermometry is run.
Stability and precision are mainly used to evaluate the quality of thermometry when no temperature change is expected. However, if there is homogeneous heating over the ROI, these values should also remain low.
T10, Tavg and T90. T10, Tavg and T90 refer to the highest tenth percentile, the lowest tenth percentile and the average temperature within the ROI, respectively [Citation4,Citation34–36]. These parameters were averaged over all time points for the temperature maps obtained without heating, to evaluate changes during thermometry acquisition. For the temperature maps obtained during heating, these parameters were averaged over time points after reaching the target set point and before cool down. For temperature maps obtained without heating, these values were expected to remain close to the baseline temperature. For a homogenously heated region, all three values were expected to remain similar to each other and close to the set point.
Uncompensated drift. Uncompensated drift (UD) was defined as the difference between the initial and final temperatures obtained once thermometry was completed. When no temperature change is expected, UD exhibits the ability to compensate for temperature drift over time.
Hyperthermia targets
The quality of thermometry was evaluated on two different targets: chicken breast tissue and mouse cadavers.
Fresh chicken breast was acquired from a local butcher. The chicken breast was placed in a container and immersed in 2 L of 0.9% NaCl saline solution. The container was then placed in a degassing chamber for 10 h prior to the experiments.
Adult mouse cadavers were obtained from AQUAlity Tropical Fish Wholesale (Catalog# ff004–1, Mississauga, Canada). The mouse cadavers were obtained frozen and were thawed until they reached temperature equilibrium with the MRI room. All experiments involving animals were performed following approval by the Lakehead University Animal Care Committee.
MRI
MRI was performed using a 3T MRI scanner (Achieva, Philips, Best, the Netherlands). A custom system interface (Clinical MR Solutions, Brookfield, WI, United States) with specialized coil adapter modules was used to connect the custom coils to the MRI scanner.
The target was placed on the treatment bed above a tank filled with deionized and degassed water. Localization of the transducer and target was performed using images acquired with a 2-stack gradient echo sequence (sagittal and transverse, TR = 4.83 ms, TE = 2.49 ms, FOV = 120 × 120 mm, acquisition matrix = 240 × 240 mm2, slice thickness = 2 mm, number of excitations (NEX) = 2 and turbo spin factor (TSF) = 186). High-resolution coronal images were obtained using a gradient echo sequence with 20 slices centered at the interface of the water and the target (TR = 5.55 ms, TE = 2.76 ms, FOV = 80 × 80 mm, acquisition matrix = 240 × 240 mm2, slice thickness = 0.5 mm and NEX = 32, TSF = 1). These coronal images were acquired for targeting purposes and to ensure the absence of air bubbles prior to FUS exposure. Thermometry and thermal maps were obtained using the PRF method [Citation15], applied to coronal single-slice images acquired with an echo planar (EPI) sequence centered at the transducer focus (TR = 22 ms, TE = 16 ms FOV = 80 mm, acquisition matrix = 80 × 80 mm2, slice thickness = 3 mm, flip angle = 19°, NEX = 12, TSF = 9 and temporal resolution = 1.8 s).
Temperature maps without heating
Seven 15-min acquisitions for MR thermometry were sequentially performed on the mouse cadavers for each custom coil. No heating was administered during these acquisitions. A fiber-optic thermocouple (Reflex, Neoptix, Montreal, Canada) was used to measure the temperature of the mouse, which was employed as the baseline temperature for the thermal maps. The thermocouple measurements were used to confirm that the mouse cadaver maintained a constant temperature during the long thermometry scans. The thermocouple data were then employed to calculate the UD. The coils were substituted without moving the mouse cadaver to ensure that the same target was used for the various coils. The use of the same target was confirmed visually in the localization and high-resolution targeting images before thermometry acquisitions were performed.
Temperature maps with continuous FUS exposure
Continuous FUS exposure for 120 s at an acoustic power of 2.5 W was performed on freshly degassed chicken breast tissue. The FUS transducer was focused at a depth of 3 mm from the water-tissue interface, and the water and tissues were maintained at room temperature. MR thermometry acquisitions began 20 s before exposure to FUS and were continued until the average temperature in the ROI reached the initial baseline value. This process was repeated three times for each coil. The coils were substituted without moving the target to ensure that the same region was employed for the different coils. The placement was confirmed visually using localization and high-resolution targeting images.
Temperature maps during PID-controlled hyperthermia
A 15-min period of controlled FUS exposure with a set temperature of 3 °C above baseline at the focus was performed on a fresh chicken breast target. The input power of the transducer was controlled using a proportional, integral, derivative (PID) controller that was developed in-house. The PID controller was designed and tuned using MATLAB (2014 b, The MathWorks, Inc., Natick, Massachusetts). The controller was implemented and executed in a Python software environment. The PID tuning coefficients were determined using a model obtained from continuous heating curves measured from the transducer on equivalent targets. The acquisition of the thermometry data occurred over a 25-min period. Exposure to FUS began 30 s after beginning the acquisition of thermometry data and continued for 900 s. Data acquisition for thermometry purposes continued after exposure to FUS to monitor the cooling down period. This procedure was repeated three times for each of the three custom coils with a fresh target for each repetition.
B1 mapping
Temperature calculation using the PRF method is based on changes among sequential phase images. Because phase images are highly dependent on B1 homogeneity, quantifying homogeneity for each RF coil can provide information on the expected quality of the thermometry. B1 maps were obtained for the medium, small and TORO coils. B1 maps were also obtained using the body coil for transmission and the receive-only (RO) coil from the TORO pair. B1 mapping using the dual angle method was performed to obtain the B1 fields [Citation37] (spin echo, TR = 3000 ms, TE = 70 ms, FOV = 50 mm, acquisition matrix = 64 × 64 mm2, slice thickness = 300 mm (nonselective), flip angle α = 30° and 60°, NEX = 1 and TSF = 16). A phantom was constructed using a 2.5-cm-diameter syringe filled with 15 mL of demineralized water containing 11.55 mg of CuSO4 · 5 H2O, 0.015 mL of Arquad® (1% solution) and 0.00225 mL of H2S04–0.1 N solution (0.05 M). The syringe was placed parallel to the direction of the magnetic field directly on the coil. The B1 maps were analyzed by placing a 3-mm-radius ROI at the center of the phantom, and the standard deviation was calculated to evaluate the degree of homogeneity within that area. Intensity profiles through the center of the B1 map in the left-right and superior-inferior directions were obtained.
Statistical analysis
SPSS software Version 22.0 (2013 release, IBM SPSS Statistics for Windows, IBM Corp., Armonk, NY) was employed to perform analyses of variance (ANOVAs) on the datasets. A p value of .05 was used to indicate statistical significance. When the ANOVA indicated statistical significance, Tukey’s HSD post hoc test was employed to determine the population groups that were significantly different from each other. Averages, standard errors and statistical tests were performed for each coil between the repeated thermometry scans unless otherwise indicated.
Results
Transducer characterization
The normalized 2D intensity maps for the XZ and XY planes used for numerical and experimental characterization are presented in . The energy within a region of 3 mm in radius centered at the focus was calculated to be 50% and 80% of the total energy from the numerical and experimental intensity plots, respectively. We employed this energy deposition calculation to define the ROI for the thermometry calculations because the measurements indicated that 80% of the energy was deposited within the 3-mm radius. The energy within a region of 10 mm in radius yielded 97% and 99% of the total energy based on the numerical and experimental intensity plots, respectively. This criterion was used to define the nonheated region for the drift calculations because voxels outside of this 10-mm radius would not receive a significant amount of deposited energy during exposure to FUS.
Figure 2. Numerical (top row) and measured (middle row) normalized 2D maps of the acoustic intensity of the transducer in the XZ (left column) and XY (right column) planes. Experimental and numerical normalized ultrasound beam intensity profile (bottom) at the geometrical focus (z = 50 mm).
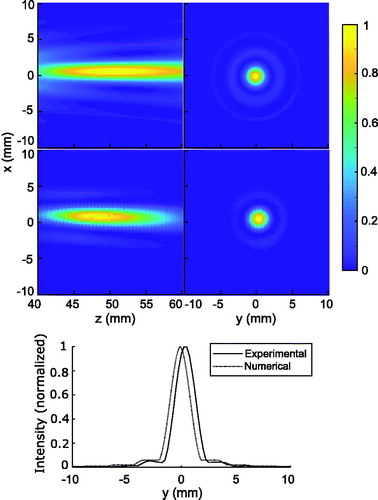
The numerical and experimental intensity profiles measured at the geometrical focus and across the x-axis are presented at the bottom of . The numerical and experimental values of the FWHM were each calculated to be 2 mm.
Temperature maps without heating
Image quality analysis
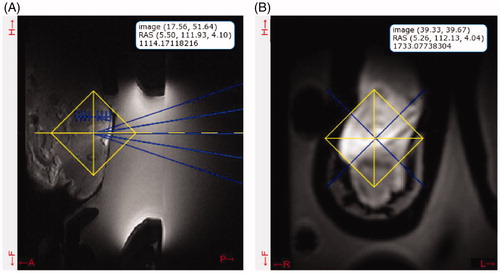
presents an example of the images obtained using the platform for targeting. presents an overlay of the FUS transducer, which allows localization and accurate selection of the target within the animal. It is possible to navigate among slices during targeting and to magnify the images as needed to accurately place the focus of the transducer. displays a high-resolution coronal image in the focus that allows the user to confirm the target choice. Images placed at the water-target interface are employed to ensure that no air bubbles are present on the surface of the target that could reflect ultrasound energy and cause unintended heat accumulation. All of the images used for targeting allowed colocalization of the transducer and the animal and presented a high SNR, independent of the coil employed. The average SNRs of the localization images were 28 ± 3 for the medium coil, 102 ± 18 for the small coil and 111 ± 52 for the TORO coil. The high-resolution images exhibited an average SNR of 74 ± 19 for the medium coil, 202 ± 62 for the small coil and 296 ± 21 for the TORO coil.
Figure 3. (A) Transverse and (B) coronal image planning snapshot from the user interface. The yellow crosshairs denote the user-selected location for target heating, and the blue overlay shows the current focus of the transducer. The platform controls a motorized system and moves the transducer to the required location. The interface provides a legend on the images, with the coordinates of the cursor relative to the lower-left corner of the image (top), the absolute MRI coordinates using the right-anterior-superior (RAS) convention (middle) and the magnitude of the pixel (bottom). In this example, the cursor was located at the focal location in each image orientation.
The images obtained from the thermometry acquisitions presented a higher SNR than the localization images; however, this SNR was lower than the value measured for the high-resolution coronal images. The average SNRs obtained from the thermometry images were 61 ± 6 for the medium coil, 158 ± 11 for the small coil and 97 ± 19 for the TORO coil. The quality of all thermometry images was assessed using the defined criteria, employing a mouse cadaver that was not exposed to FUS. The results are presented in . The small coil exhibited significantly higher SNRs than the other coils, both inside and outside the 10-mm drift correction region, followed by the TORO coil and the medium coil. Compared with the small and TORO coils, the medium coil displayed a significantly greater number of pixels above the threshold that could be employed for drift correction calculations. The magnitude variability was smaller for the small coil compared to the medium and TORO coils; however, these differences were not statistically significant. The phase variability was smallest (though not significantly so) for the TORO coil, which suggested that this coil may allow more precise thermometry calculations than the other coils.
Table 1. Image quality for the thermometry acquisitions carried out over a 15-min period on mouse cadavers under nonheated conditions.
Thermometry quality analysis
The quality of thermometry was assessed using the defined criteria with a mouse cadaver as the target, in the absence of any exposure to FUS. The results are presented in . The medium coil exhibited greater stability than the TORO and small coils; however, the differences were not statistically significant. These findings indicated that the temperature maps obtained with the medium coil showed very low variation within the ROI and remained unchanged for the duration of the acquisition. The precision was significantly greater for the TORO coil than the medium coil, which indicated that the TORO coil provided more accurate temperature measurements over time. During each 15-min thermometry acquisition, the mouse cadaver maintained a constant temperature, which resulted in an accurate UD determination. The average baseline temperature for all scans measured using the thermocouple during thermometry acquisitions was 19.9 ± 0.1 °C. The UD was significantly lower for the TORO coil than the small and medium coils. The small coil also exhibited a significantly lower UD than the medium coil. The low UD and precision values obtained for the TORO coil demonstrated that it provided accurate temperature measurements that were resilient to drift over extended periods of time. The TORO coil displayed the high-tenth-percentile temperature T10 value that was the closest to the thermocouple baseline, and the difference compared to the medium coil was statistically significant. The low-tenth-percentile T90 value that was closest to the baseline was obtained for the medium coil, and the difference compared with the other coils was statistically significant. The average temperatures for the small and TORO coils were significantly different from the average temperature for the medium coil, and these average values were close to the baseline measured by the thermocouple.
Table 2. Quality of the thermometry acquisitions carried out over a 15-min period on mouse cadavers under nonheated conditions.
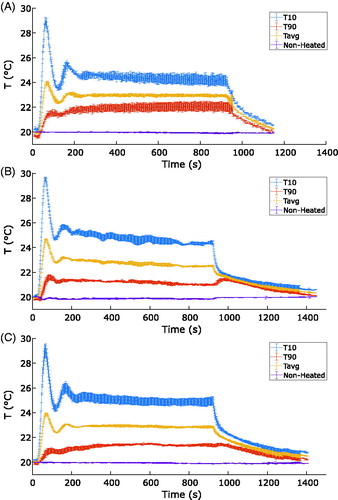
The average calculated temperatures within the ROIs for all seven repeated thermometry sequences are displayed in as a function of time for the three coils. The plot confirms that the TORO coil exhibited greater resilience to drift relative to the other coils. The small and medium coils both exhibited drift in the calculated temperature that increased over time. Almost no drift was observed for the TORO coil. The small coil exhibited a reduction in the calculated temperature of approximately 0.4 °C at the beginning of thermometry, and this reduction occurred consistently for all seven repeated thermometry acquisitions.
Figure 4. Average and percentile values of temperatures within the ROI as a function of time for the medium (A), small (B) and TORO (C) coils obtained from mouse cadavers under nonheated conditions. Nonheated describes the average temperature calculated in the region used for drift correction. The error bars show the standard errors for T10, T90 and Tavg between repeated scans for each coil.
Temperature maps with continuous FUS exposure
Three different coils were used to monitor heating during the continuous exposure of chicken breast tissue to FUS. Image quality was assessed for all the thermometry images using the defined criteria. The results are presented in . The SNR was significantly higher for the small coil, followed by the TORO and medium coils. The SNRs for all coils were increased in the absence of any exposure to FUS compared with the results presented in . This increase in SNR was the result of using a more homogenous target (chicken breast) than a mouse carcass. The number of pixels above the threshold followed the trend observed in , i.e., the medium coil displayed a significantly higher value than both the small and TORO coils. Although heating was performed during this experiment, the magnitude and phase variability values were comparable to the values observed in the absence of heating with no significant difference between the coils.
Table 3. Quality of the images from thermometry analyses carried out over a 4-min period on degassed chicken breast subjected to 120 s of continuous exposure to FUS at 2.5 W acoustic power.
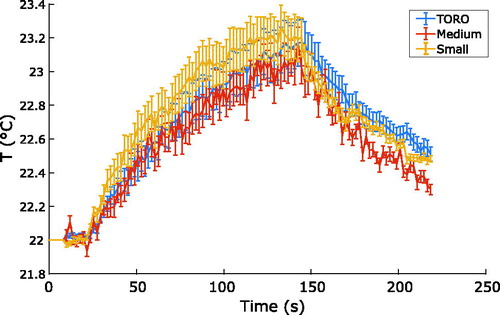
presents the values obtained for the quality of thermometry. No significant differences in the stability and precision values were found during exposure to FUS. T10 and T90 for all coils were approximately 1 °C away from the average temperature, which indicated that the heating of the ROI was moderately homogeneous. The coils presented significantly different average and T10 temperatures; the TORO coil exhibited an average temperature closest to the set temperature of 23 °C. Because of expected changes in the temperature maps during exposure to FUS, the use of the stability and precision measurements during heating was less straightforward than when no heating was applied. However, because the measurements were performed in the heating zone, which is expected to be homogenous, the results reflected steadiness over time. The values presented in indicate that the TORO coil offers better precision than the other coils, even if the temperature is indeed changing over time.
Table 4. Quality of the images from thermometry analyses carried out over a 4-min period on degassed chicken breast subjected to 120 s of continuous exposure to FUS at 2.5 W acoustic power.
displays the average calculated temperature within the ROI as a function of time for all coils. The temperatures registered by the coils were similar during exposure to FUS; however, the TORO coil cooled more slowly and required more time for the temperature values to return to baseline. The TORO coil exhibited smoother cooldown behavior than the medium and small coils. These plots are consistent and show the typical exponential heating profiles observed during short continuous exposure to FUS [Citation23].
Figure 5. Average temperature calculated within the ROI as a function of time for the medium, small and TORO coils, obtained using degassed chicken breast tissue subjected to 120 s of continuous exposure to FUS at an acoustic power of 2.5 W. The error bars show the standard error between repeated scans for each coil.
Temperature maps during PID-controlled hyperthermia
Temperature changes were monitored using the three different coils during PID-controlled hyperthermia FUS exposure. The target tissue was fresh chicken breast, with a target temperature of 3 °C above baseline. The results of the assessment of thermometry image quality are presented in . The image quality values for all coils were consistent with the values observed during continuous exposure to FUS, which confirmed the consistent behavior of the coils during heating. The small and TORO coils exhibited significantly greater SNRs inside the drift correction region relative to the medium coil. The SNR outside the region was significantly higher for the small coil than for the medium and TORO coils. The number of pixels above the threshold was significantly higher for the medium coil, followed by the TORO coil. The magnitude and phase variability values were similar to those observed in the absence of heating (). Although heating resulted in increases in magnitude and phase variability, the use of a more homogenous sample reduced this variance.
Table 5. Quality of the images obtained from thermometry analyses carried out over a 24-min period on degassed chicken breast during a 15-min period of PID-controlled hyperthermia set 3 °C higher than the baseline value.
The results of assessment of the quality of thermometry during PID-controlled hyperthermia exposure to FUS are presented in . There were no statistically significant differences in stability or precision during PID-controlled heating. The measured stability values were in the same order as those obtained in the absence of heating. These findings indicate that the homogeneity of temperature values within the ROI remains similar during heating. The medium coil displayed significantly different T90 and Tavg values compared with the small coil, and these values were closer to the set point. Precision was affected by heating, as this parameter reflects the variation of the average temperature over time, and an increase of temperature increases this value. The observed differences between the set temperature, Tavg, T10 and T90 fell within the values reported in the literature during hyperthermia [Citation4,Citation19,Citation30,Citation31]. The peak power output from the transducer could be decreased to reduce the temperature spread and increase homogeneity, which also increased stability.
Table 6. Quality of thermometry carried out on degassed chicken breast.
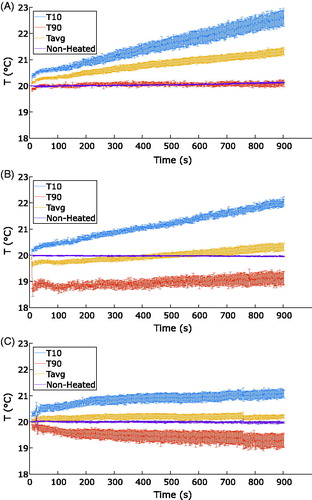
presents a plot of temperature as a function of time for each coil during all controlled exposures. The medium and TORO coils exhibited a 1 °C overshoot of the average temperature, whereas the small coil exhibited a 1.7 °C overshoot. The overshoot lasted 25 s before the temperature began to decrease. The settling time was calculated with a 10% set value threshold using MATLAB. The settling times for the medium, small and TORO coils were 161 ± 17 s, 280 ± 88 s and 142 ± 10 s, respectively. These findings were consistent among all of the PID-controlled FUS exposures. The T10, Tavg and T90 curves revealed that the small coil exhibited the lowest standard error between repeated scans.
Figure 6. Calculated temperature as a function of time for the medium (A), small (B) and TORO (C) coils, obtained on degassed chicken breast tissue during a 15-min PID-controlled hyperthermia FUS exposure for a target 3 °C above baseline. Nonheated describes the average temperature calculated in the region used for drift correction. The error bars show the standard errors for T10, T90 and Tavg measured over the three repeated exposure used for each coil.
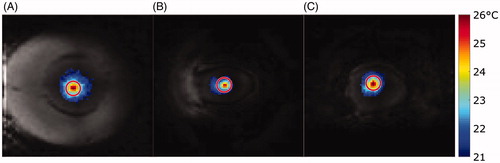
presents an example of a temperature map for each coil superimposed on an image obtained during controlled exposure when the set temperature had been reached (415 s after initiating exposure). A maximum temperature of 26 °C was measured at the focus, with average temperatures within the ROI of 22.7 °C for the TORO and 23 °C for the small and medium coils. Although there was significant heat diffusion outside of the 3-mm ROI, it remained within the 10-mm region, and the temperature drift region did not show any voxels that changed in temperature.
Figure 7. Temperature map obtained with the medium (A), small (B) and TORO (C) coils, using degassed chicken breast tissue subjected to controlled exposure to FUS at a set temperature 3 °C above baseline. The temperature map is shown at 415 s for each coil. The user-specified ROI is shown as a solid red circle. Only temperature values above or equal to the 20 °C baseline are shown on the temperature maps.
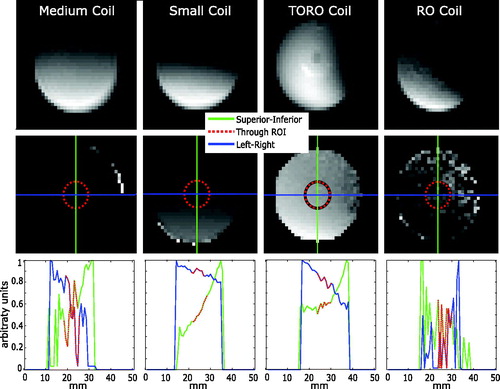
presents the B1 maps for the medium, small and TORO coils along with the B1 map for the RO coil with body coil transmission. These B1 maps demonstrate the homogeneity of the B1 field generated by each coil. The TORO coil exhibited the most homogenous B1 field, followed by the small, medium and RO coils. The TORO coil displayed the highest homogeneity within the ROI, with a standard error of 0.0077, compared to standard errors of 0.0363, 0.0129 and 0.0501 for the medium, small and RO coils, respectively. Profiles through the B1 maps revealed homogeneity in the left-right (green) and superior-inferior (blue) directions. The red dots in the profiles show the region overlapping the ROI that was employed for the thermometry calculations. The profiles through the B1 maps indicated that the RO coil exhibited the least smooth B1 profile followed by the medium coil. The small and TORO coils exhibited smooth profiles, with the TORO coil presenting a flatter profile in the superior-inferior direction although the small coil displayed a flatter profile in the left-right direction.
Figure 8. B1 maps obtained using the medium (first column), small (second column), TORO (third column) and RO (fourth column) coils. The first row shows the magnitude images for a flip angle of 2α (60 °C). The second row shows the B1 maps with superior-inferior (green) and left-right (blue) profile lines through the center of a 3-mm-radius ROI (red). The bottom row shows the intensity profiles in the superior-inferior (green) and left-right (blue) directions with the target region used for hyperthermia highlighted in red.
The medium, small and TORO coils were assessed for their ability to monitor temperature during extended thermometry sequences. The TORO coil exhibited improved precision during thermometry compared with the other coils, which is particularly important during prolonged hyperthermia involving low target temperatures. Most importantly, in the absence of heating, the TORO coil resulted in the lowest UD, which demonstrated its ability to maintain accurate thermometry during long exposure. These results suggest that the TORO coil is the best choice for thermometry relative to the small and medium coils. Furthermore, the B1 maps indicated an increase in B1 field homogeneity when using the TORO coil compared to the medium, small and body coils transmitted with the RO coil, which resulted in more homogeneous phase images and improved thermometry. Although the TORO coil resulted in the best thermometry, the small coil displayed the highest SNR, which would allow easier localization of small targets. The TORO coil exhibited a sufficient SNR for targeting and was therefore considered the best choice among the tested geometries for the intended application.
Discussion
Three different custom-built RF coils were designed and tested with an animal treatment bed and a software system for MRgFUS thermometry during hyperthermia exposure in a clinical MRI scanner. To the best of our knowledge, this is the first implementation of a TORO coil for thermometry. The TORO design was chosen to improve thermometry due to the increase in B1 homogeneity resulting from the half-birdcage design of the transmit coil [Citation38].
Theoretical modeling and experimental characterization of the transducer were performed to set the appropriate parameters to accurately calculate thermometry. The results of experimental and numerical transducer characterization were consistent and yielded an FWHM of 2 mm. When setting the ROI for thermometry calculations, the value was increased to a 3-mm radius, to include 80% of the total energy determined from our experimental measurements. Because the tissue is heated for a duration that is significantly longer than the thermal relaxation time [Citation39] of the tissues, the area employed for drift calculation was set outside a radius of 10 mm centered at the focal point to account for the diffusion of energy into neighboring tissues. This radius accounts for 98% of the total acoustic intensity measured in the XY-plane and should prove sufficient to prevent heat transfer to the region used for drift correction calculations. Increasing this radius may result in an insufficient number of pixels above the threshold to be employed in drift calculation if the coil does not provide a sufficient signal in that region. For the three coils used in this study, this value proved to be acceptable.
All coils displayed a sufficient SNR to easily localize the transducer and the target. When comparing the SNRs from all of the coils, the small coil exhibited twice the SNR of the other coils. The reduction in SNR observed for the TORO coil was due to the expected drop in SNR caused by transmitting with a half-birdcage geometry and locating the target 4 cm away from the maximum B1 intensity of the half-birdcage [Citation38]. The size of the small coil was chosen to place the target mouse at the isocenter of the coil and improve target imaging. The tradeoff of this small size is that a smaller number of pixels are obtained, and the area that can be used for drift correction is smaller. The medium coil displayed the greatest number of pixels above the threshold that could be employed for drift correction calculations, as expected from its larger diameter relative to the other coils [Citation40]. It was more challenging to locate the transducer when using the small and TORO coils for the same reason. It was nevertheless possible to localize the transducer, although if the transducer is to be placed farther from the target, the current design for the small and TORO coils may require modification.
Five criteria were specified for quantitative assessment of the quality of thermometry. The criteria described different aspects of the accuracy or steadiness of thermometry. Stability indicates the spatial variability of a temperature map over time, whereas precision indicates the accuracy of a value and the variability of that value over time. Because these parameters describe temperature homogeneity within the ROI both temporally and spatially, they become relevant during thermometry acquisitions. Overall, the TORO coil demonstrated the best performance during thermometry based on the defined thermometry quality criteria. Specifically, the TORO coil exhibited the best precision during a 15-min thermometry acquisition without heating, as reported in . The SNR obtained from the targeting images was not related to the quality of the thermometry images. Additionally, the SNR for the images used for temperature calculations was not directly related to the quality of the thermal maps. The TORO coil displayed lower temperature drift compared to the medium and small coils, with a temperature drift of 0.29 ± 0.12 °C compared to 1.27 ± 0.13 °C and 0.47 ± 0.04 °C, respectively. This finding was expected, given the geometry of the TORO coil, which produces a more homogenous B1 field than the other coils. The medium coil, with its increased number of pixels above the threshold, was initially thought to present the best resilience to temperature drift. However, when performance was assessed, it was found that the TORO coil exhibited higher thermometry quality. Although it was originally postulated that static image quality criteria, such as the number of pixels above the threshold and SNR, would increase the quality of thermometry, our results suggested that this was not the case. The homogeneity of the B1 field of the coil has a greater influence on MRI thermometry than a low SNR in an MR image. For thermometry applications, homogeneity in B1 fields affects temperature calculations because they rely on phase images. The most homogenous B1 was obtained for the TORO coil, which was correlated with the lowest UD and the best precision during the 15-min thermometry acquisitions without heating when we expect the temperature to remain accurate and not to change.
Although the small coil did not exhibit the best performance for thermometry, it presented a high degree of reproducibility. During each set of repeated thermometry scans, the small coil displayed the lowest standard deviation for all criteria. This phenomenon could be useful in cases in which improved reproducibility across thermometry scans is most important.
All coils provided sufficiently accurate thermometry for the PID control to successfully perform a long exposure at the set temperature. The small coil exhibited a longer settling time and greater overshoot, which can be explained by the lower stability of the thermometry for this coil and affects the response of the controller. During one repetition using the medium coil, cooldown was not observed, and the temperature obtained from thermometry registered 25 °C after exposure had ended and the tissues had reached baseline temperatures according to thermocouple measurements; this outcome was observed on only one occasion and did not occur for any other coil.
The temporal resolution of temperature is usually increased under in vivo exposure. Consequently, the number of averages used for imaging needs to be reduced. This strategy will strongly affect the SNR and quality of thermometry. Future in vivo hyperthermia experiments will require a NEX sufficient to provide accurate thermometry, which will result in a cost in terms of the temporal resolution. The expected effects of motion during thermometry should also be considered when selecting NEX. A balance between temporal resolution and sufficient signal averaging using the TORO coil may provide the best results.
The PID exhibited a 1 °C overshoot that consistently lasted approximately 40 s for all three coils. This overshoot may have important biological implications and would mean that retuning of the PID controller is required prior to initiating hyperthermia in mice. Furthermore, the conditions of PID tuning for mice in vivo may differ from the parameters resulting in a good performance for chicken breast. Prior to working with mice in vivo, preliminary experiments using mouse carcasses may further improve the PID controller.
The TORO coil displayed the most homogenous B1 map of all the coils that were tested. The highly heterogeneous B1 map that was generated when using the RO coil with body coil transmission illustrates the need to develop custom RF coils with transmit coils of similar size to the targets of interest [Citation41–43]. The B1 profile of the small coil was flatter in the left-right direction compared to that of the TORO coil. This finding can be explained by the fact that surface coils present a homogenous B1 field parallel to the coil surface. However, surface coils display heterogeneous B1 fields in a plane perpendicular to the coil, as demonstrated by the high slope obtained in the superior-inferior direction for the small coil. The high degree of homogeneity shown in all directions in the B1 maps of the TORO coil suggests a similar performance in both planes. Additionally, it has been suggested by El-Sharkawy et al. [Citation32] that the primary cause of temporal and spatial variations in B0, which lead to temperature drift, may be caused by gradients that induce heating of passive shims. The use of separate transmit and receive coils may reduce the strain on the coil and other MRI hardware and thus avoid heat build-up that affects B0 and B1 during long thermometry acquisitions. Improving the homogeneity of B0 and B1, both temporally and spatially, will result in improved thermometry.
This study did not include thermometry performed using the body coil for transmission. Previous experiments using this configuration yielded poor thermometry results. The use of a large transmit coil on small target results in a low filling factor, which causes increased inhomogeneity of B1 [Citation41–43]. shows that when transmission is performed using the body coil, the resulting B1 maps are very heterogeneous relative to those for the TORO coil, which explains the poor thermometry results.
This work assessed the quality of imaging and thermometry in a controlled ex vivo setting using three different coils that were designed to monitor hyperthermia in small animals. These results may help guide future development of imaging coils for MRgFUS in small animals. The study compared the performance of three different coils: a small 4-cm T/R surface coil, a 7-cm medium T/R surface coil and a TORO coil. This study was the first to use a TORO coil to monitor hyperthermia. The TORO coil exhibited an improved ability to monitor temperature in MRI using the PRF method relative to the other coils. Specifically, the TORO coil exhibited a better ability to compensate for temperature drift than the medium and small surface coils. The use of TORO coils in conjunction with MRI and FUS may increase the accuracy of thermometry and hyperthermia in small targets.
Acknowledgments
We would like to acknowledge CMC Microsystems for the provision of CAD products that facilitated this research.
Disclosure statement
No potential conflict of interest was reported by the authors.
Additional information
Funding
References
- Hahn G. Potential for therapy of drugs and hyperthermia. Cancer Res. 1979;39:2264–2268.
- Ranjan A, Benjamin CJ, Negussie AH, et al. Biodistribution and efficacy of low temperature-sensitive liposome encapsulated docetaxel combined with mild hyperthermia in a mouse model of prostate cancer. Pharm Res. 2016;33:2459–2469.
- van der Zee J, González D, van Rhoon GC, et al. Comparison of radiotherapy alone with radiotherapy plus hyperthermia in locally advanced pelvic tumours: a prospective, randomised, multicentre trial. The Lancet. 2000;355:1119–1125.
- Tillander M, Hokland S, Koskela J, et al. High intensity focused ultrasound induced in vivo large volume hyperthermia under 3D MRI temperature control. Med Phys. 2016;43:1539–1549.
- Issels RD, Lindner LH, Verweij J, et al. Neo-adjuvant chemotherapy alone or with regional hyperthermia for localised high-risk soft-tissue sarcoma: a randomised phase 3 multicentre study. Lancet Oncol. 2010;11:561–570.
- Kong G, Braun RD, Dewhirst MW. Hyperthermia enables tumor-specific nanoparticle delivery: effect of particle size. Cancer Res. 2000;60:4440–4445.
- Horsman MR, Overgaard J. Hyperthermia: a Potent Enhancer of Radiotherapy. Clin Oncol (R Coll Radiol)). 2007;19:418–426.
- Vernon CC, Hand JW, Field SB, et al. Radiotherapy with or without hyperthermia in the treatment of superficial localized breast cancer: Results from five randomized controlled trials. Int J Radiat Oncol Biol Phys. 1996;35:731–744.
- Falk MH, Issels RD. Hyperthermia in oncology. Int J Hyperthermia. 2001;17:1–18.
- Ellis S, Rieke V, Kohi M, et al. Clinical applications for magnetic resonance guided high intensity focused ultrasound (MRgHIFU): present and future: clinical applications for MRgHIFU. J Med Imaging Radiat Oncol. 2013;57:391–399.
- Masucci L, Goeree R. Magnetic Resonance–Guided High-Intensity Focused Ultrasound (MRgHIFU) Treatment of Symptomatic Uterine Fibroids: An Evidence-Based Analysis. Ont Health Technol Assess Ser. 2013;13:1.
- Zhou M, Chen J-Y, Tang L-D, et al. Ultrasound-guided high-intensity focused ultrasound ablation for adenomyosis: the clinical experience of a single center. Fertil Steril. 2011;95:900–905.
- Kennedy JE. Innovation: High-intensity focused ultrasound in the treatment of solid tumours. Nat Rev Cancer. 2005;5:321–327.
- Mougenot C, Quesson B, de Senneville BD, et al. Three-dimensional spatial and temporal temperature control with MR thermometry-guided focused ultrasound (MRgHIFU). Magn Reson Med. 2009;61:603–614.
- Ishihara Y, Calderon A, Watanabe H, et al. A precise and fast temperature mapping using water proton chemical shift. Magn Reson Med. 1995;34:814–823.
- Hesley GK, Felmlee JP, Gebhart JB, et al. Noninvasive treatment of uterine fibroids: early Mayo Clinic experience with magnetic resonance imaging-guided focused ultrasound. Mayo Clin Proc. 2006;81:936–942.
- Tempany CMC, Stewart EA, McDannold N, et al. MR imaging–guided focused ultrasound surgery of uterine leiomyomas: a feasibility study. Radiology. 2003;226:897–905.
- Hurwitz MD, Ghanouni P, Kanaev SV, et al. Magnetic resonance–guided focused ultrasound for patients with painful bone metastases: phase III trial results. J Natl Cancer Inst [Internet]. 2014;106:106. [cited 2017 Dec 14];Available from: https://academic.oup.com/jnci/article-lookup/doi/10.1093/jnci/dju082.
- Bing C, Nofiele J, Staruch R, et al. Localised hyperthermia in rodent models using an MRI-compatible high-intensity focused ultrasound system. Int J Hyperthermia. 2015;31:813–822.
- Chopra R, Curiel L, Staruch R, et al. An MRI-compatible system for focused ultrasound experiments in small animal models. Med Phys. 2009;36:1867
- Hijnen N, Heijman E, Kohler M, et al. Tumor hyperthermia and ablation in rats using a clinical MR-HIFU system equipped with a dedicated small animal setup. Int J Hyperthermia. 2012;28:141–155.
- Ellens NPK, Partanen A. Preclinical MRI-guided focused ultrasound: a review of systems and current practices. IEEE Trans Ultrason Ferroelectr Freq Control. 2017;64:291–305.
- Rieck B, Curiel L, Mougenot C, et al. Treatment of localized abscesses induced by methicillin-resistant Staphylococcus aureus (MRSA) using MRgFUS: First in vivo results. 2012 [cited 2015 Oct 27]. p. 173–178. Available from: http://scitation.aip.org/content/aip/proceeding/aipcp/10.1063/1.4769938.
- Virieux J. SH-wave propagation in heterogeneous media: velocity‐stress finite‐difference method. GEOPHYSICS. 1984;49:1933–1942.
- Pichardo S, Moreno-Hernández C, Andrew Drainville R, et al. A viscoelastic model for the prediction of transcranial ultrasound propagation: application for the estimation of shear acoustic properties in the human skull. Phys Med Biol. 2017;62:6938–6962.
- Levander AR. Fourth-order finite-difference P-SV seismograms. Geophysics. 1988;53:1425–1436.
- Robertsson JOA, Blanch JO, Symes WW. Viscoelastic finite-difference modeling. Geophysics. 1994;59:1444–1456.
- Bohlen T. Parallel 3-D viscoelastic finite difference seismic modelling. Comput Geosci. 2002;28:887–899.
- Zaporzan B, Waspe AC, Looi T, et al. MatMRI and MatHIFU: software toolboxes for real-time monitoring and control of MR-guided HIFU. J Ther Ultrasound. 2013;1:7.
- Pichardo S, Köhler M, Lee J, et al. In vivo optimisation study for multi-baseline MR-based thermometry in the context of hyperthermia using MR-guided high intensity focused ultrasound for head and neck applications. Int J Hyperthermia. 2014;30:579–592.
- Bing C, Staruch RM, Tillander M, et al. Drift correction for accurate PRF-shift MR thermometry during mild hyperthermia treatments with MR-HIFU. Int J Hyperthermia. 2016;32:673–687.
- El-Sharkawy AM, Schär M, Bottomley PA, et al. Monitoring and correcting spatio-temporal variations of the MR scanner’s static magnetic field. Magn Reson Mater Phy. 2006;19:223–236.
- Hayes CE, Axel L. Noise performance of surface coils for magnetic resonance imaging at 1.5 T. Med Phys. 1985;12:604–607.
- Hurwitz MD, Kaplan ID, Hansen JL, et al. Hyperthermia combined with radiation in treatment of locally advanced prostate cancer is associated with a favourable toxicity profile. Int J Hyperthermia. 2005;21:649–656.
- Hand JW, Machin D, Vernon CC, et al. Analysis of thermal parameters obtained during phase III trials of hyperthermia as an adjunct to radiotherapy in the treatment of breast carcinoma. Int J Hyperthermia. 1997;13:343–364.
- Mack CF, Stea B, Kittelson JM, et al. Interstitial thermoradiotherapy with ferromagnetic implants for locally advanced and recurrent neoplasms. Int J Radiat Oncol. 1993;27:109–115.
- Insko EK, Bolinger L. Mapping of the radiofrequency field. J Magn Reson A. 1993;103:82–85.
- Ballon D, Graham MC, Miodownik S, et al. A 64 MHz half-birdcage resonator for clinical imaging. J Magn Reson. 1990;90:131–140.
- Othman MIA, Ali MGS, Farouk RM. The effect of relaxation time on the heat transfer and temperature distribution in tissues. WJM. 2011;01:283–287.
- Burk D, Kanal E, Brunberg J, et al. 1.5-T surface-coil MRI of the knee. Am J Roentgenol. 1986;147:293–300.
- Leifer MC. Theory of the quadrature elliptic birdcage coil. Magn Reson Med. 1997;38:726–732.
- Doty FD, Entzminger G, Hauck CD, et al. Practical aspects of birdcage coils. J Magn Reson. 1999;138:144–154.
- Doty FD, Entzminger G, Kulkarni J, et al. Radio frequency coil technology for small-animal MRI. NMR Biomed. 2007;20:304–325.