
 ?Mathematical formulae have been encoded as MathML and are displayed in this HTML version using MathJax in order to improve their display. Uncheck the box to turn MathJax off. This feature requires Javascript. Click on a formula to zoom.
Abstract
Radiofrequency (RF) ablation (RFA) is the most commonly used minimally invasive procedure for thermal ablation of liver tumors. Ultrasound not only provides real-time feedback of the electrode location for RFA guidance but also enables visualization of the tissue temperature. Changes in backscattered energy (CBE) have been widely applied to ultrasound temperature imaging for assessing thermal ablation. Pilot studies have revealed that significant shadowing features appear in CBE imaging and are caused by the electrode and RFA-induced gas bubbles. To resolve this problem, the current study proposed ultrasound single-phase CBE imaging based on positive CBE values. An in vitro model with tissue samples derived from the porcine tenderloin was used to validate the proposed method. During RFA with various electrode lengths, ultrasound scans of tissue samples were obtained using a clinical ultrasound scanner equipped with a convex array transducer of 3 MHz. Raw image data comprising 256 scan lines of backscattered RF signals were acquired for B-mode, conventional CBE, and single-phase CBE imaging by using the proposed algorithmic scheme. The ablation sizes estimated using CBE imaging and gross examinations were compared to calculate the correlation coefficient. The experimental results indicated that single-phase CBE imaging largely suppressed artificial CBE information in the shadowed region. Moreover, compared with conventional CBE imaging, single-phase CBE imaging provided a more accurate estimation of ablation sizes (the correlation coefficient was higher than 0.8).
Introduction
Currently, radiofrequency (RF) ablation (RFA) is the most commonly used minimally invasive procedure for cauterization of liver tumors through ionic agitation [Citation1,Citation2]. Surgeons typically use either computed tomography (CT) or ultrasound B-mode imaging to localize the electrode during RFA and thereby guide it for insertion into the treatment target. Compared with CT, ultrasound offers the advantages of portability, nonionizing imaging, and real-time feedback of the electrode location [Citation3]. Therefore, sonography plays a critical role in the guidance of both percutaneous and intraoperative RFA.
In addition to B-scan ultrasound, several ultrasound imaging techniques can be used to obtain quantitative information for RFA evaluations in periablation and postablation periods. RFA increases tissue stiffness because the heating of tissues induces coagulation necrosis, which involves protein denaturation and tissue dehydration. Ultrasound elastography may be used to quantify the stiffness of ablation lesions [Citation4–8]. However, because RFA-induced heating is rapid and reaches approximately boiling temperatures, numerous gas bubbles that behave as hyperechoic zones form during the RFA process. A study suggested that these transient hyperechoic zones persist for 30–90 min and can be used to estimate ablation zones during RFA [Citation9]. To improve the visualization of gas bubbles for the assessment of heated areas, some advanced methods for signal analysis, including ultrasound envelope statistics [Citation10,Citation11] and nonlinear imaging [Citation12], have been utilized. Gas bubbles also result in artifacts in ultrasound shear wave elastography, and these artifacts can be used to assess RFA in the periablation period [Citation13].
The thermal dose is also a critical consideration for evaluating RFA treatment. An increase in the temperature during RFA not only results in the thermal expansion of tissues but also affects the interaction between the incident wave and scatterers in tissues. The temperature information, or thermal distribution, in tissues during RFA can be described according to changes in the acoustic parameters of wave propagation, such as echo-time shift [Citation14–17], attenuation [Citation18,Citation19], and backscattered energy [Citation20–22]. Previous studies have applied ultrasound temperature imaging based on the detection of echo-time shifts caused by thermal expansion and changes in sound speed to visualize temperature variations during RFA [Citation23,Citation24]. The major problem in using echo-time shifts for temperature estimation is that the results are affected by motion and tissue necrosis [Citation25,Citation26]. In addition, the echo-time-shift technique fails in estimating high temperatures [Citation27]. Compared with echo-time shifts, the usability of ultrasound attenuation is highly dependent on conditions with temperatures above 50 °C [Citation19,Citation28]. Therefore, attenuation is not a suitable method for monitoring small temperature variations.
The use of changes in backscattered energy (CBE) for ultrasound temperature estimation has also attracted research attention. The CBE method was initially proposed by Straube and Arthur for noninvasive thermometry of hyperthermia; the researchers indicated that CBE with temperature is primarily caused by thermal effects on the backscatter coefficients of scatterers at temperatures ranging from 37 °C to 50 °C [Citation20]. In theory, CBE from an individual scatterer monotonically increases (positive CBE expressed by a logarithmic unit compared with the reference temperature) and decreases (negative CBE) with temperature for lipid- and aqueous-based scatterers, respectively [Citation20–22]. The sensitivity of the backscattered energy is also proportional to the ultrasound frequency [Citation29]. Although accurate CBE imaging requires motion compensation, motion tracking and compensation may be unnecessary if ultrasound CBE imaging is only positioned to visualize areas of temperature changes [Citation30]. Thus, the CBE may have more potential in practical applications than other parameters. In a previous study, an enhanced CBE imaging technique was proposed based on the polynomial approximation of integrated CBE imaging (calculated using the absolute value of the CBE image); this technique provides improved contrast for the visualization of thermal distribution in tissues [Citation31].
In RFA, the heated area corresponds with the ablation zone [Citation9,Citation12]. It is expectable that CBE values observed during RFA are considerably affected by gas bubbles and tissue vaporization. Therefore, CBE imaging techniques exhibit the potential for estimating the size of RFA-induced lesions. Recently, we conducted laboratory-based pilot studies of CBE imaging in RFA. The preliminary results revealed that shadowing occurred in the CBE image under the location of the electrode, degrading the method’s performance in assessing thermal lesions. Inserting an electrode induced the shadowing effect because the electrode blocked wave propagation, thereby reducing the signal-to-noise ratio of ultrasound B-scans. In addition, RFA-induced gas bubbles and tissue necrosis further led to acoustic attenuation, strengthening the shadowing effects. Essentially, a CBE image is a biphase map consisting of both positive and negative CBE values, because a typical biological tissue comprises a mixture of lipids and aqueous substances. However, considering the aforementioned factors, the backscattered energy measured in shadowing regions should gradually decrease compared with that obtained before performing RFA and should thus result in negative CBE. Therefore, using positive CBE only for single-phase CBE imaging may reduce shadowing patterns and thereby enhance the assessment of the ablation zone.
In this study, we proposed an algorithmic scheme for single-phase CBE imaging with positive CBE and evaluated the scheme’s performance in reducing shadowing features in CBE images during RFA. An in vitro model was used to validate the proposed method. Experimental results indicated that single-phase CBE imaging largely avoided artificial CBE information in the shadowing region. Moreover, compared with conventional CBE imaging, single-phase CBE imaging provided a more accurate estimation of the ablation size after RFA.
Materials and methods
Experimental setup
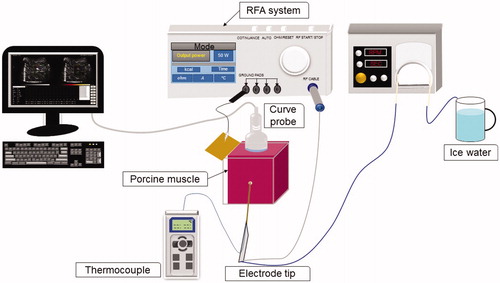
The experimental setup is depicted in . An in vitro model in which tissue samples were derived from the porcine tenderloin was used to validate the proposed method. Each tissue sample was placed in a case. A metal board was attached to the wall of the case as a grounding pad for the RFA system. The clinical RFA system (Model VIVA, Starmed Co. Ltd., Goyang, Gyeonggi, South Korea) employed in experiments consisted of a cool-tip needle electrode (Model 17-20V15-40, Starmed Co.), an RF generator, a peristaltic pump, cables, and other accessories. The active-tip length (ATL) of the electrode could be set to 0.5, 1.0 or 1.5 cm to induce thermal lesions of various sizes. The pump was responsible for circulating cold saline to the electrode tip to avoid electrode overheating, which causes tissue carbonization. A thermocouple was attached to the tip of the electrode to measure the tissue temperature at the ablation center.
Figure 1. The experimental setup comprised an ultrasound imaging system, a clinical RFA system equipped with a cool-tip needle electrode, a radiofrequency generator, a peristaltic pump, cables, and accessories. In vitro experiments were performed to validate the proposed method.
Measurement procedures
First, the electrode was inserted into the tissue sample through a small hole in the case wall. An ultrasound scanner (Model 3000, Terason, Burlington, MA) equipped with a 3-MHz convex array transducer (Model 10L5, Terason) was used for imaging and data acquisition during RFA. The transducer was placed on the surface of the tissue sample in a transverse section. The interface between the transducer and tissue sample was coupled with ultrasound gel. Prior to experiments, raw image data comprising 256 scan lines of backscattered RF signals at a sampling rate of 12 MHz were acquired as the preablation reference at the 0th minute. The data size was approximately 7 (depth) × 13 (width) cm2. Subsequently, the RFA system was switched to the treatment mode (starting power: 50 W; treatment time: 12 min; operating frequency: 480 kHz; with the power automatically increased by 10 W/min until the RF pulse paused because of high tissue impedance). A sequence of RF pulses was generated as a function of time and stopped at the end of ablation (12th min). During RFA, raw image data were acquired every minute. When an ATL of 0.5 cm was used, the ablation process was terminated at approximately the second minute, because applying thermal ablation to a small tissue area accelerates the increase in electrical impedance of the tissue, resulting in an open loop between the tissue and the electrode. Accordingly, raw image data were acquired every 10 s when an ATL of 0.5 cm was used. The raw data were used for B-mode and CBE imaging. A B-mode image at a dynamic range of 40 dB was constructed using a log-compressed envelope image, which was obtained from the absolute value of the Hilbert transform of each backscattered RF signal. A CBE image was formed according to the proposed algorithm, the details of which are presented in the next paragraph. For each ATL, five samples were used to perform five independent measurements. A total of 15 samples were used in the experiment (n = 15).
Ultrasound CBE imaging
Conventionally, an ultrasound CBE image is obtained by calculating the ratio of the backscattered energy at each temperature relative to the reference at each pixel [Citation22,Citation30]. This pixel-to-pixel algorithmic scheme results in CBE imaging that is highly sensitive to speckle motion and changes in the waveform features of ultrasound backscattered signals [Citation30]. To simplify the algorithm for practical applications, a window-to-window approach was proposed previously; under this approach, a CBE map is generated to enable visualization of temperature distribution without performing additional motion compensation or phase correction processing [Citation31]. In the present study, the CBE imaging algorithm (for both conventional and single-phase imaging) was developed based on the window-to-window computational scheme and is illustrated in . The details are as follows.
Figure 2. The algorithmic flow chart for ultrasound CBE imaging illustrates use of the sliding-window technique for regional CBE estimations. Conventional and single-phase CBE images were constructed using the strength (magnitude) of CBE and positive CBE values, respectively. The details of the algorithm are presented in the Materials and Methods section.
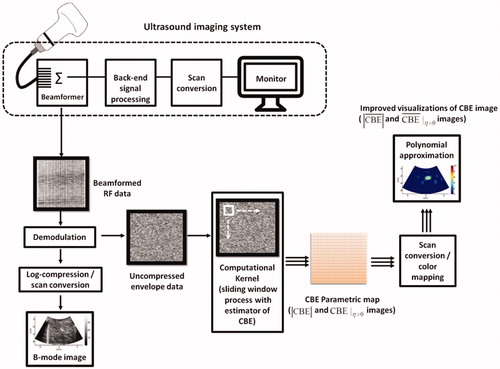
First, raw image data (i.e., backscattered RF signals) are demodulated using the Hilbert transform to obtain corresponding uncompressed envelope images (log-compressed envelopes were used for B-scan only, as explained previously). The envelope image Rk at each time point (k = 0, 1, 2, …, 12 min; R0 is the preablation data) can be expressed as follows:
(1)
(1)
Subsequently, a window with a size of is set within Rk for acquiring local backscattered envelopes
:
(2)
(2)
where i and j correspond to locations in the upper-left corner of the window. Let E[·] denote the statistical mean. The regional CBE value (denoted by
) can be calculated using EquationEquation (3)
(3)
(3) , which is assigned as the new pixel located in the upper-left corner of the window:
(3)
(3)
Let the window move throughout Rk and R0 in steps of a certain number of pixels corresponding to a window overlap ratio (WOR) for calculating regional CBE values. After data interpolation, a CBE image with the same size as the original image can be obtained, as given by
(4)
(4)
In this study, 50% was used as the WOR, and the side length of the sliding window corresponded to three times the pulse length of the ultrasound transducer (6.9 mm).
Both positive and negative pixels (denoted by and
, respectively) simultaneously exist in a CBE image. Conventionally, the absolute value of the CBE image (symbolized by
) can be determined to reflect the strength of CBE in ablated tissues. By contrast, according to the assumption posed in the Introduction, single-phase CBE imaging was defined in this study as
parametric imaging, which was obtained by setting negative values in CBE image 0. Previous studies have extensively used polynomial approximation to fit experimental data and predict temperature distribution and heat conduction behavior [Citation32–34]. Thus, the polynomial approximations of
and
images (denoted by
and
, respectively) were also applied in this study to visualize temperature distribution and heat conduction behavior.
Suppose that the original image prior to smoothing is Xi,j, where i and j are indices of the image depth and width, respectively. We assumed that the function in each direction was a polynomial of order p. Because p is much smaller than the number of pixels in axial and lateral directions, Xi,j data were used to determine the optimal polynomial by using the least-squares method. Xi,j was replaced with the value calculated using the optimal polynomial. This approximation was performed along each line in axial and lateral directions, with fp(·; V), the optimal polynomial of order p, reconstructed from the vector V = (V1, V2, …, Vn) located at indices 1, 2, …, n. After the execution of polynomial approximations in lateral and axial directions, the image was constructed using the following procedures:
(5)
(5)
and
(6)
(6)
where nd and nw are the numbers of pixels in axial (depth) and lateral (width) directions, respectively;
is the vector
;
is the intermediate image; and
is the output of polynomial approximation.
Some computational settings we used in polynomial approximation are described below. The order p = 12 was empirically determined for polynomial approximation in ultrasound CBE imaging. Note that performing polynomial approximation using the data of the whole image may be affected by boundary conditions. For this reason, during the polynomial approximation of image data, the image may be segmented into a set of regions to improve contour fitting, as mentioned in a previous study [Citation35]. Therefore, the data in and
maps used for polynomial approximation are limited to a range of the subimage with a depth of 0.5–5.5 cm and a width of 3–10 cm to reduce the effects of information from peripheral nontissue regions in an experimental environment in vitro.
Data analysis
To quantify CBE as a function of time during RFA, pixel values in a 3 × 3-cm2 region of interest (ROI) located at the ablation zone in each image and
image were averaged for comparisons with temperatures measured using the thermocouple. The
and
images corresponding to each time point were further summed and averaged to obtain the temporally compounded
and
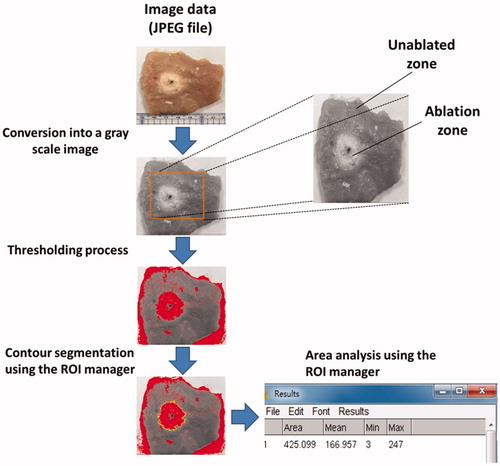
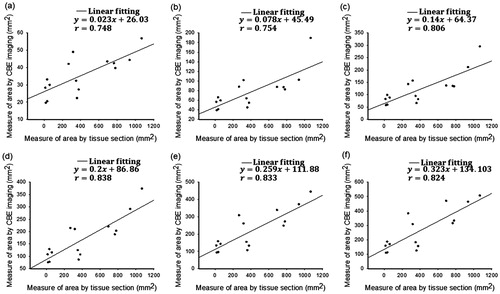
images, respectively. The temporally compounded images, as the overall evaluations of temperature distributions, were then analyzed by segmenting the areas within the contours of −1 to −6 dB to quantitatively measure the region of change in the shading of the CBE image (denoted by SCBE with mm2 as the unit). Concurrently, the samples were cut along the ultrasound imaging plane and photographed for gross examination. The photographs (i.e., tissue-section images) were analyzed using ImageJ (a public-domain image-processing program developed by the National Institutes of Health) and served as the ground truth for size measurements of ablation zones, as illustrated in . A linear-fitting equation in the form of y = axe +b was applied to describe the relationship between SCBE values and gross examinations. The correlation coefficient r was also calculated. All statistical analyses were conducted using SigmaPlot software (v 12.0, Systat Software, Inc., CA).
Figure 3. Analysis steps of gross examinations using the software ImageJ to estimate the ablation zone of the tissue sample; the steps comprised greyscale conversion, a thresholding process, and contour segmentations.
Results
depicts typical B-mode, ,
,
, and
images obtained at various time points and under using temporal compounding (ATL = 0.5 cm). and represent the images obtained using ATLs of 1 and 1.5 cm, respectively. During RFA, areas that were hyperechoic due to the formation of gas bubbles appeared in B-mode images and caused the image brightness to slightly increase with the ablation time. Based on the finding of this study that the image brightness variation was not significant, the conventional B-scan may not be an ideal tool for evaluating RFA. The shadowing effect also occurred under the needle electrode and degraded the B-scan quality. To complement the B-scan, the
image reflected the strength of CBE, which was used to represent thermal information. The strength of CBE was further visualized from the
image by using a polynomial approximation to outline the contour of the temperature distribution. Note that the shadowing effect in the B-scan affected the construction of
images, resulting in a bias in contour fitting based on
images, even if the subimage technique was used in polynomial approximation to partially reduce the effects of shadowing. Comparatively, the proposed
and
imaging largely reduced the appearances of shadowing and thus provided superior visualizations of the temperature distribution induced by RFA.
Figure 4. Typical (a) B-mode, (b) , (c)
, (d)
, and (e)
images obtained at various time points and under using temporal compounding (ATL = 0.5 cm). During RFA, areas that were hyperechoic due to the formation of gas bubbles appeared in B-mode images, causing the image brightness to slightly increase in correspondence with the ablation time. In images, the shadowing effect can be observed in the area where the electrode was positioned.
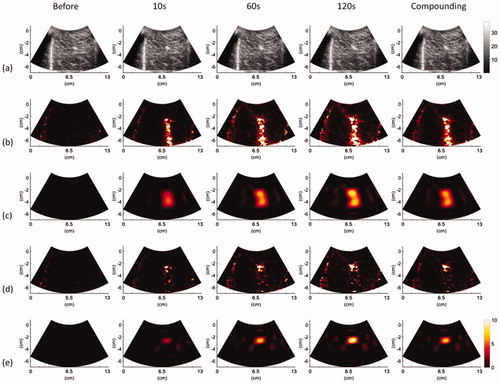
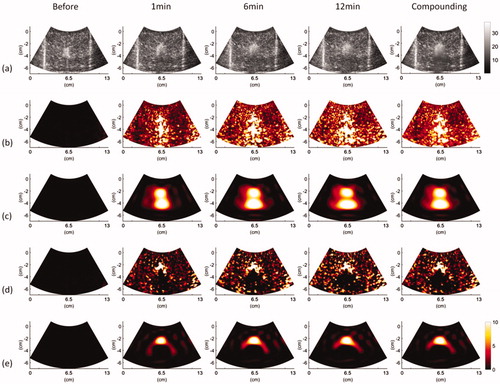
Figure 5. Typical (a) B-mode, (b) , (c)
, (d)
, and (e)
images obtained at various time points and under using temporal compounding (ATL = 1 cm).
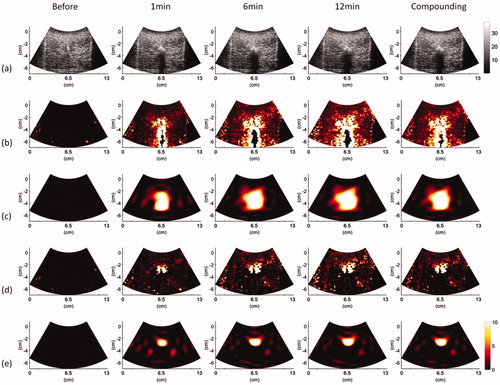
Figure 6. Typical (a) B-mode, (b) , (c)
, (d)
, and (e)
images obtained at various time points and under using temporal compounding (ATL = 1.5 cm).
To further observe changes in CBE in the peri- and post-ablation periods, average pixel values within the ROIs in and
images were plotted as functions of time for comparison with the temperatures of ablated tissues, as depicted in . For all ATLs, the values of
and
increased with time during RFA. In particular,
imaging increased the accuracy of
as a reflection of postablation cooling phases. and illustrate the relationship between ablation sizes obtained from gross examination and SCBE values estimated using
and
images, respectively. The results indicated that the
-based SCBE values were not adequately correlated with ablation sizes. This is attributed to the effect of shadowing in conventional ultrasound CBE imaging. When the proposed
image was used in the present study, the correlation coefficient r between SCBE and ablation sizes significantly increased. The analyses of
images using a more than −3-dB contour criterion produced an r value of >0.8.
Figure 7. Average pixel values within ROIs in the CBE images (red lines) plotted as a function of time for comparisons with the temperatures of ablated tissues (black lines). (a)–(c) images obtained using ATL = 0.5, 1, and 1.5 cm, respectively; (d)–(f)
images obtained using ATL = 0.5, 1, and 1.5 cm, respectively. For each ATL, the values of
and
increased with time during RFA. In particular,
imaging increased the accuracy of
as a reflection of postablation cooling phases.
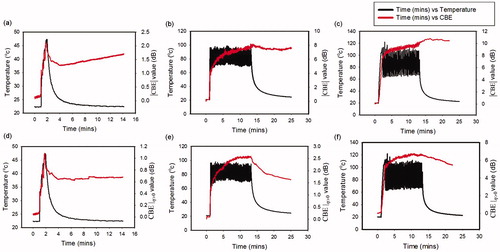
Figure 8. Relationships between the ablation size obtained from gross examination and the SCBE values estimated using images by applying various contour criteria. (a) − 1 dB; (b) − 2 dB; (c) − 3 dB; (d) − 4 dB; (e) − 5 dB; (f) − 6 dB. The results indicated that
-based SCBE values were not adequately correlated with ablation sizes. This is attributed to the effect of shadowing features in conventional ultrasound CBE imaging.
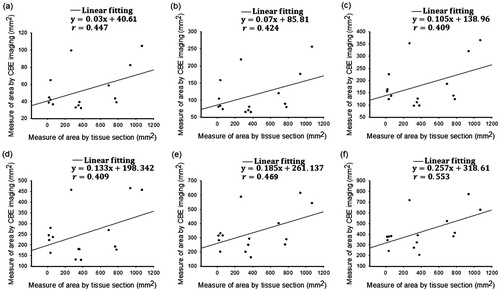
Figure 9. Relationships between the ablation size obtained from gross examination and the SCBE values estimated using images by applying various contour criteria. (a) − 1 dB; (b) − 2 dB; (c) − 3 dB; (d) − 4 dB; (e) − 5 dB; (f) − 6 dB. When the proposed
image was used, the correlation coefficients r between SCBE and ablation sizes significantly increased. Analyses of
images using the more than −3-dB contour criterion produced an r value of >0.8.
Discussion
Contribution of this study
Studies have reported examples of using ultrasound CBE imaging to monitor hyperthermia based on uniform heating [Citation20–22,Citation36] and noninvasive ablation using high-intensity focused ultrasound [Citation37,Citation38]. One of the problems in using CBE imaging to monitor RFA is that electrode-induced shadowing affects the applicability of conventional CBE imaging for the visualization of thermal dose distributions. Moreover, the performance of CBE imaging for monitoring high-temperature RFA remains unknown. The current study presented a single-phase CBE imaging method using to resolve the shadowing problem in CBE imaging during RFA. Additionally, during RFA, we generated a thermal dose of approximately 100 °C at the center of ablated tissues to explore the performance of the proposed method. The results demonstrated that the proposed
imaging technique suppressed most of the artificial CBEs and thereby improved the estimation of RFA-induced lesion size. In particular, the results suggested that
imaging may be used at temperatures between 20 °C and 100 °C and thus overcomes the temperature measurement range limitations encountered when other acoustic parameters are used for ultrasound thermal imaging. This study is the first to propose the concept of single-phase CBE imaging, which is less affected by the shadowing effect for monitoring RFA-induced temperature distribution in tissues.
Physical meanings of CBE imaging
Two mechanisms may explain the temperature variations in ultrasound CBE. As mentioned in the Introduction, the initially proposed theory suggests that an increase in temperature produces an increase in CBE for lipid scatterers and a decrease in CBE for aqueous scatterers [Citation20–22]. The second theory, which represents a substantial contribution to the CBE literature [Citation39], posits that CBE can also be caused by local changes in speckle patterns, which result from changes in the speed of sound during heating and thus affect wave interference and the corresponding waveforms of ultrasound backscattered signals. Both of these models are useful for understanding the physical meanings of CBE imaging constructed during RFA at a lower temperature range because the associated interpretations were established at temperatures between 37 °C and 50 °C. However, these theoretical CBE models cannot be used to explain CBE at high temperatures. A general CBE model that supports interpretations of CBE from body-to-boiling temperatures has not yet been developed. The dominant factors for determining CBE during RFA at temperatures more than 50 °C most likely include stiffness increase, tissue necrosis, and gas bubble formation.
Possible explanations for  imaging’s suppression of artificial CBE
Potential reasons why the proposed single-phase technique based on reduced shadowing features in ultrasound CBE imaging are proposed below. First, RFA-induced gas bubbles block the propagation of the acoustic wave, thereby strengthening the formation of shadows in the ablation zone. Moreover, when the temperature is increased during RFA, the accumulation of the thermal dose gradually strengthens the degree of tissue necrosis and the overall attenuation, reducing the amplitude of backscattered signals received from shadowing regions compared with that of the reference data. In this circumstance, negative CBE values dominate the features of shadow regions, but this phenomenon can be prevented using the proposed single-phase CBE imaging. Second, CBE results from changes in the waveforms of backscattered signals due to the thermal effect of sound speed [Citation39]. Variations in signal waveforms are not only associated with changes in sound speed but also with tissue necrosis and gas bubbles induced by high temperatures. Accordingly, tissue necrosis and gas bubbles increase the degree of acoustic impedance mismatch, resulting in an increase in the amplitude of backscattered echoes during RFA. Thus,
tends to be a dominant factor in ultrasound CBE imaging during RFA.
Challenges for CBE-related techniques in monitoring RFA
In addition to CBE imaging, correlation [Citation40,Citation41] and image-fusion techniques [Citation42] have been used to describe signal changes for predicting thermal damage and have provided equivalent results. For monitoring RFA, a spatiotemporal correlation function between two sequential B-scan frames can be calculated to form decorrelation and integrated backscatter images of changes in the signal energy [Citation40,Citation41]. A spherical marker can be drawn along the contour of the target tumor on the reference image obtained before RFA; through image fusion, an ablation is considered complete when the area that is hyperechoic due to RFA-induced gas bubbles completely covers the synchronized spherical marker [Citation42].
Visual processing of CBE data must be performed while using CBE-related techniques to evaluate an ablation zone. The quality of data visualization critically affects the accuracy of ablation size prediction [Citation31]. It can be expected that the performance of the proposed single-phase CBE method depends on the parameter used to optimize the visualization (i.e., the order of polynomial approximation). The purpose of polynomial approximation is to provide a two-dimensional fitting of CBE data for visualizing ablation size. Notably, polynomial approximation still fulfills its purpose although its application sacrifices the resolution and detailed information of CBE values for individual image pixels. By contrast, the order selection is a more critical concern in ablation size assessment.
In practice, an optimal order for the polynomial approximation of CBE imaging may not exist. Different tissue properties result in different heat conductions and corresponding CBE features; thus, the order must be empirically adjusted to achieve the best fit. In this study, the order p = 12 was used because it facilitated the correlation between the SCBE value and the findings obtained from gross examinations, according to our tests in the laboratory. However, higher-order polynomial approximations easily underestimate the spatial distribution of CBE [Citation31]; this may be the reason why ablation sizes were underestimated in the present study (). Inconsistent optimization conditions are also commonly seen because optimal parameters are often system dependent [Citation40]. Thus, in addition to tissue properties, the order of polynomial approximation may also depend on the characteristics of ultrasound and RFA systems. Prior to considering CBE-related techniques as reliable for evaluation of RFA-induced thermal damage, concerns related to optimization and calibration should be further explored in a cross-system environment.
Limitations and suggestions for future studies
This study has some limitations. First, the CBE image measurement underestimated but highly correlated with ablation size, as discussed. Balancing the correlation between CBE image and ablation size and the accurate assessment of the ablation zone is a challenge for the further development and application of CBE imaging. Second, CBE imaging is based on processing backscattered envelopes. However, most commercial clinical machines are unable to provide raw image data. One possible strategy for resolving this concern is the development of an RFA-dedicated ultrasound system that facilitates access to raw data for combination with the proposed algorithm. Third, the current study explored the feasibility of imaging by conducting in vitro experiments. Previous studies have proposed solutions to the problem of tissue motion, such as using high-frame-rate imaging or electrocardiography signals as triggers to collect image data [Citation25]. Integration of the preceding methods with
imaging is worthy of further investigation through in vivo validations.
Conclusions
This study conducted in vitro experiments to evaluate the performance of the proposed single-phase CBE imaging method in monitoring RFA. The findings and contributions of this study are summarized as follows. (i) Inserting the electrode into the tissue produced the shadowing in ultrasound B-scan. The attenuations from gas bubble formation and tissue necrosis during RFA further strengthened the shadowing effects, affecting ultrasound CBE imaging of ablation lesions. (ii) The proposed single-phase imaging method based on positive CBE values reduced the appearances of the shadowing patterns in CBE imaging. Compared to conventional CBE imaging, single-phase CBE imaging improved the assessment of the ablation size after RFA. (iii) The proposed CBE imaging method worked at temperatures between 20 °C and 100 °C. The effects of thermal dose accumulation, stiffness increase due to tissue necrosis, and gas bubble formation are the dominant factors for determining CBE during RFA at high temperatures. In the future, ultrasound single-phase CBE imaging has the potential to monitor RFA-induced temperature distributions in tissues without being affected by the shadowing effects.
Disclosure statement
No potential conflict of interest was reported by the authors.
Additional information
Funding
Related Research Data
References
- Bruix J, Sherman M. Management of hepatocellular carcinoma: an update. Hepatology. 2011;53:1020–1022.
- Shah DR, Green S, Elliot A, et al. Current oncologic applications of radiofrequency ablation therapies. WJGO. 2012;5:71–80.
- Machi J, Uchida S, Sumida K, et al. Ultrasound-guided radiofrequency thermal ablation of liver tumors: percutaneous, laparoscopic, and open surgical approaches. J Gastrointest Surg. 2001;5:477–489.
- Pernot M, Mace E, Dubois R, et al. Mapping myocardial elasticity changes after RF-ablation using supersonic shear imaging. Comput Cardiol. 2009;36:793–796.
- Hollender P, Rosenzweig S, Eyerly S, et al. Three-dimensional fusion of Shear Wave Imaging and electro-anatomical mapping for intracardiac radiofrequency ablation monitoring. IEEE Ultrason Symp Proc. 2013;1:111.
- Mariani A, Kwiecinski W, Pernot M, et al. Real time shear waves elastography monitoring of thermal ablation: in vivo evaluation in pig livers. J Surg Res. 2014;188:37–43.
- Sugimoto K, Oshiro H, Ogawa S, et al. Radiologic-pathologic correlation of three-dimensional shear-wave elastographic findings in assessing the liver ablation volume after radiofrequency ablation. WJG. 2014;20:11850–11855.
- Kwiecinski W, Provost J, Dubois R, et al. Quantitative evaluation of atrial radio frequency ablation using intracardiac shear-wave elastography. Med Phys. 2014;41:112901.
- Chen M, Zhang Y, Lau WY. Radiofrequency ablation for small hepatocellular carcinoma. New York: Springer; 2016.
- Wang CY, Geng X, Yeh TS, et al. Monitoring radiofrequency ablation with ultrasound Nakagami imaging. Med Phys. 2013;40:072901.
- Zhou Z, Wu S, Wang CY, et al. Monitoring radiofrequency ablation using real-time ultrasound Nakagami imaging combined with frequency and temporal compounding techniques. PLoS One. 2015;10:e0118030.
- Winkler I, Adam D. Monitoring radio-frequency thermal ablation with ultrasound by low frequency acoustic emissions-in vitro and in vivo study. Ultrasound Med Biol. 2011;37:755–767.
- Tsui PH, Wang CY, Zhou Z, et al. Monitoring radiofrequency ablation using ultrasound envelope statistics and shear wave elastography in the periablation period: an in vitro feasibility study. PLoS One. 2016;11:e0162488.
- Maass-Moreno R, Damianou CA. Noninvasive temperature estimation in tissue via ultrasound echo-shifts. Part I. Analytical model. J Acoust Soc Am. 1996;100:2514–2521.
- Maass-Moreno R, Damianou CA, Sanghvi NT. Noninvasive temperature estimation in tissue via ultrasound echo-shifts. Part II. In vitro study. J Acoust Soc Am. 1996;100:2522–2530.
- Seip R, VanBaren P, Cain CA, et al. Noninvasive real-time multipoint temperature control for ultrasound phased array treatments. IEEE Trans Ultrason, Ferroelect, Freq Contr. 1996;43:1063–1073.
- Simon C, Vanbaren P, Ebbini ES. Two-dimensional temperature estimation using diagnostic ultrasound. IEEE Trans Ultrason, Ferroelect, Freq Contr. 1998;45:1088–1099.
- Damianou CA, Sanghvi NT, Fry FJ, et al. Dependence of ultrasonic attenuation and absorption in dog soft tissues on temperature and thermal dose. J Acoust Soc Am. 1997;102:628–634.
- Tyreus PD, Diederich C. Two-dimensional acoustic attenuation mapping of high-temperature interstitial ultrasound lesions. Phys Med Biol. 2004;49:533–546.
- Straube WL, Arthur RM. Theoretical estimation of the temperature dependence of backscattered ultrasonic power for noninvasive thermometry. Ultrasound Med Biol. 1994;20:915–922.
- Arthur RM, Straube WL, Trobaugh JW, et al. Non-invasive estimation of hyperthermia temperatures with ultrasound. Int J Hyperthermia. 2005;21:589–600.
- Trobaugh JW, Arthur RM, Straube WL, et al. A simulation model for ultrasonic temperature imaging using change in backscattered energy. Ultrasound Med Biol. 2008;34:289–298.
- Daniels MJ, Varghese T, Madsen EL, et al. Non-invasive ultrasound-based temperature imaging for monitoring radiofrequency heating-phantom results. Phys Med Biol. 2007;52:4827–4843.
- Daniels MJ, Varghese T. Dynamic frame selection for in vivo ultrasound temperature estimation during radiofrequency ablation. Phys Med Biol. 2010;55:4735–4753.
- Seo CH, Shi Y, Huang SW, et al. Thermal strain imaging: a review. Interface Focus. 2011;1:649–664.
- Liu HL, Li ML, Tsui PH, et al. A unified approach to combine temperature estimation and elastography for thermal lesion determination in focused ultrasound thermal therapy. Phys Med Biol. 2011;56:169–186.
- Fuhrmann TA, Georg O, Haller J, et al. Uncertainty estimation for temperature measurement with diagnostic ultrasound. J Ther Ultrasound. 2016;4:28.
- Liu YD, Li Q, Zhou Z, et al. Adaptive ultrasound temperature imaging for monitoring radiofrequency ablation. PLoS One. 2017;12:e0182457.
- Tsui PH, Chien YT. Effect of frequency on the change in backscattered ultrasound energy as a function of temperature. Jpn J Appl Phys. 2012;51:057001.
- Tsui PH, Chien YT, Liu HL, et al. Using ultrasound CBE imaging without echo shift compensation for temperature estimation. Ultrasonics. 2012;52:925–935.
- Xia J, Li Q, Liu HL, et al. An approach for the visualization of temperature distribution in tissues according to changes in ultrasonic backscattered energy. Comput Math Methods Med. 2013;2013:1.
- Enoch IE, Ozil E, Birkebak RC. Polynomial approximation solution of heat transfer by conduction and radiation in a one-dimensional absorbing, emitting, and scattering medium. Numer Heat Transf. 1982;5:353–358.
- Keshavarz P, Taheri M. An improved lumped analysis for transient heat conduction by using the polynomial approximation method. Heat Mass Transf. 2007;43:1151–1156.
- Kubota R, Suetake N, Uchino E, et al. Polynomial-based boundary extraction of plaque in intravascular ultrasound image by using its local statistical information. ICIC Express Lett. 2008;2:387–393.
- Sadeh I. Polynomial approximation of images. Comput Math Applic Appl. 1996;32:99–115.
- Arthur RM, Basu D, Guo Y, et al. 3-D in vitro estimation of temperature using the change in backscattered ultrasonic energy. IEEE Trans Ultrason Ferroelectr Freq Control. 2010;57:1724–1733.
- Choi K, Kong D, Park J, et al. Noninvasive ultrasound temperature imaging with fusion algorithm. IEEE Ultrason Symp Proc. 2012;1:933–936.
- Chenot J, Melodelima D, Chapelon JY. Temperature mapping for ultrasound scanner using backscattered changes. AIP Conference Proc. 2012;1481:59–63.
- Li X, Ghoshal G, Lavarello RJ, et al. Exploring potential mechanisms responsible for observed changes of ultrasonic backscattered energy with temperature variations. Med Phys. 2014;41:052901.
- Mast TD, Pucke DP, Subramanian SE, et al. Ultrasound monitoring of in vitro radio frequency ablation by echo decorrelation imaging. J Ultrasound Med. 2008;27:1685–1697.
- Subramanian S, Rudich SM, Alqadah A, et al. In vivo thermal ablation monitoring using ultrasound echo decorrelation imaging. Ultrasound Med Biol. 2014;40:102–114.
- Toshikuni N, Matsue Y, Ozaki K, et al. An image fusion system for estimating the therapeutic effects of radiofrequency ablation on hepatocellular carcinoma. Radiol Oncol. 2017;51:263–269.