
Abstract
Purpose: To investigate the feasibility of three-dimensional contrast-enhanced ultrasound (3DCEUS) fusion in evaluating ablative margin (AM) after radiofrequency ablation (RFA) for hepatocellular carcinoma (HCC) and compare with those of computed tomography (CT) fusion.
Patients and methods: In total, 55 patients (47 men, 8 women; mean age, 56.0 ± 10.6 years) with 55 HCCs were included. Pre- and post-RFA 3DCEUS images were fused to assess AM immediately after RFA. The AM measured on fusion imaging was categorized into two groups: (A) AM <5 mm, and (B) AM ≥5 mm. The agreement of AM evaluation was compared between 3DCEUS and CT fusion. The influence of AMs evaluated by 3DCEUS fusion on the risk of local tumor progression (LTP) was assessed.
Results: For 3DCEUS fusion, registration success rate was 96.4% (53/55). AM evaluation resulted in 28 tumors in group A and 25 tumors in group B. For CT fusion, AM evaluation resulted in 31 tumors with AM <5 mm and 23 tumors with AM ≥5 mm. AM was successful evaluated by both technique in 53 (96.4%) tumors. The agreement between 3DCEUS and CT fusion was excellent (kappa coefficient = 0.924, p < .001). LTP was identified in 5 tumors (9.4%, 5/53). LTPs all occurred in the area where unachieved 5 mm AM was evaluated by 3DCEUS fusion. Cumulative rate of LTP was significantly higher in group A than in group B (28% versus 0%; p = .033, log-rank test).
Conclusions: 3DCEUS fusion enables AM evaluation for HCC immediately after RFA with comparable accuracy to CT fusion. AM <5 mm evaluated by 3DCEUS fusion has high predictive value for LTP.
Introduction
Hepatocellular carcinoma (HCC) is the fifth most common tumor worldwide and the second most common cause of cancer-related death [Citation1,Citation2]. Several guidelines recommend radiofrequency ablation (RFA) for those who are unsuitable for surgical resection [Citation3–6]. Nevertheless, it has been reported that local tumor progression (LTP) occurred in 1.6–26% of the cases [Citation7–12]. The independent predictors for local tumour progression (LTP) after RFA for HCC include insufficient ablative margin (AM), tumor size, tumor type, subcapsular location and perivascular location [Citation9,Citation10,Citation12,Citation13]. AM is one of the most important factors for the prediction of LTP. Thus, it is critical to evaluate whether the AM is sufficient accurately and quickly after RFA.
Regular imaging modalities, including contrast-enhanced computed tomography (CECT), magnetic resonance imaging (MRI), and two-dimensional contrast-enhanced ultrasound (2DCEUS) could assess treatment response after RFA [Citation14]. The use of 2DCEUS in immediate assessment of technical success has been reported to provide results comparable to those obtained with CECT/MRI, without additional nephrotoxic contrast or ionizing radiation [Citation15,Citation16]. However, the modalities mentioned above cannot evaluate AM because it is difficult to differentiate the ablated normal liver tissue surrounding the tumor in the ablative zone [Citation17,Citation18]. Previous studies have reported that AM was assessed by comparing pre- and post-RFA CT/MRI images in a side-by-side manner. However, this approach may be inaccurate because sectional liver images constantly differ between pre- and post-RFA CT/MRI images due to translocation, rotation, or deformation of the liver. Subsequently, CT-CT and MRI-MRI fusion imaging were proved to be feasible and useful to evaluate the AM accurately [Citation19,Citation20]. It is reported that 2DCEUS-CT/MRI fusion imaging can improve the technical feasibility of RFA for inconspicuous tumor on baseline ultrasound (BUS) and evaluate AM accurately [Citation18]. Wherever, it is not easy to access CT/MRI Digital Imaging and Communications in Medicine (DICOM) data and not convenient in ultrasound-guided RFA procedure. Recently, 2DCEUS-3D BUS fusion imaging (post-ablation real-time 2DCEUS fused with pre-ablation reference 3D BUS images) was reported to evaluated AM for RFA [Citation21]. However, this technique could not evaluate AM three-dimensionally and might inevitably leave out information on the other two planes. Moreover, it relied on magnetic positioning system and required patients to keep on absolutely fixed posture during treatment procedure.
Ultrasound examination is convenient, repeatable and free of radiation, and it can observe the organs dynamically. Moreover, three-dimensional contrast-enhanced ultrasound (3DCEUS) could provide intuitive spatial structure and perfusion information of tumor and ablation zone in RFA [Citation22]. Therefore, it is hypothesized that 3DCEUS fusion imaging (3DCEUS-FI) could be used as a novel mono-modality fusion technique to evaluate AM. It fuses the 3DCEUS images before and immediately after RFA powered by a new algorithm and can be integrated into the ultrasound workstation. Thus, the purpose of this study was to investigate the feasibility of 3DCEUS-FI in evaluating and AM after RFA for HCC and compare with those of CT fusion imaging.
Methods and materials
Patients and tumors
This prospective study was approved by the institutional review board of our hospital and informed consent was obtained from all human subjects. From January to April 2017, all patients diagnosed with HCC who met the following criteria and intended to receive RFA in our department were enrolled. Patients were diagnosed with HCC according to the diagnostic algorithm of the American Association for the Study of Liver Diseases (AASLD) practice guidelines for the management of HCC [Citation6]. The inclusion criteria of this study were: (1) number of treated lesions ≤3 and maximum diameter of treated lesions ≤5 cm, (2) Child–Pugh class A/B, (3) platelet count >50 × 109/L and prothrombin time ratio >50%, (4) conspicuous index tumor on BUS, (5) The patient could hold a breath as directed. The exclusion criteria were: (1) presence of extrahepatic metastasis and vascular invasion in the pre-RFA imaging study, (2) pre- or post-RFA local treatment of index tumor or systematic therapy, (3) index tumor adjacent to a previous ablation zone, (4) a follow-up period of less than 3 months.
3DCEUS acquisitions
3DCEUS volumetric data before and immediately after RFA were acquired using a Mindray DC8 ultrasound scanner (Mindray, Shenzhen) equipped with a 3 D matrix probe (frequency range of 3.5–5.0 MHz). All 3DCEUS examinations were performed by the same investigator who had 5 years’ experience in ultrasound. For each patient, BUS was performed to identify the index tumor before 3DCEUS examination. The imaging parameters were optimized to ensure high-quality BUS images. Then 2DCEUS was initiated, 2.4 ml of SonoVue (Bracco, Milan, Italy) was intravenously bolus injected and flushed by 5 ml saline. Then the transducer was kept in a stable position and 3DCEUS was initiated. The imaging settings for 3DCEUS were as follows: mechanical index, 0.06–0.09; one focal zone; power output, 3–6%; dynamic range, 40-60dB; volume angle, 55°–65°. Each patient was asked to take a breath hold for 10–15 s during 3DCEUS image acquisition. The volumetric data should contain as many vessels (diameter ≥3 mm) as possible and the index tumor should be well-defined. Immediately after RFA, 3DCEUS were performed as the same way before RFA. The patient posture, respiration phase and imaging parameters setting of the ultrasound scanner were kept exactly the same between the before and after RFA image acquisition. For the patients with multiple lesions, the largest one was selected as the index tumor for evaluation.
CT acquisitions
All patients were requested to have abdomen CECT scans within 2 weeks before RFA. Scans of the abdomen were performed using an AquilionTM 64-slice helical CT machine (Toshiba, Tokyo, Japan) with the following parameters: 0.5 mm ×64 mm collimation, 120 kV and 150–200 mA. After the non-contrast scan, iodinated contrast agent (Ultravist 300, Bayer Schering, Berlin, Germany) at a concentration of 300 mg iodine/mL was administered at a flow rate of 3–4 ml/s with a volume of 1.5 ml/kg, followed by a 40 ml bolus of saline solution. After unenhanced scanning, arterial and portal venous phase acquisitions were obtained at 35 s and 65 s after the initiation of injection, respectively.
RFA procedures
RFA was carried out under local anesthesia in combination with intravenous administration of conscious analgesic sedation. Two of the authors (with 10 years and 5 years of experience with ablation, respectively) performed the ablation. The aim of RFA was to obtain at least 5 mm of AM in as many cases as possible. Strategies for RFA were officially discussed at a multidisciplinary meeting before treatment. RFA was performed percutaneously under real-time ultrasound guidance. RFA was carried out with Cool-tip electrode with 2–3 cm exposed tip (Cool-tip System, Valleylab, Boulder, CO). The Cool-tip System consisted of an RF generator with a maximum power of 200 W and a 17-gauge internally cooled straight electrode. The energy deposition algorithm used followed the manufacturer’s recommended protocol. Ablations were completed when the echogenic zone induced by RFA on ultrasound was large enough to cover the entire tumor and the surrounding liver. The needle tract was ablated with the electrode at the end of the procedure to prevent bleeding and tumor seeding.
3DCEUS-FI and measurement of the AM
A newly developed fusion technique in an ultrasound workstation (Mindray, Shenzhen) was used in the present study. 3DCEUS-FI process was performed and interpreted by the two operators together and consensus was obtained by discussion.
The registration process requires the interpreters to delineate the corresponding vessels on both pre- and post-RFA 3DCEUS images as landmarks, the workstation to complete registration, and the interpreters to evaluate registration error (RE). An arbitrary landmark around the tumor was marked on both pre- and post-RFA 3DCEUS images and RE was measured on the fusion images. The RE was defined as what extent the adjacent alignment markers were matched between the pre-RFA and post-RFA 3DCEUS volume images after registration. Registration process was considered successful if the RE was ≤3 mm. The time taken for registration and the success rate of registration were recorded.
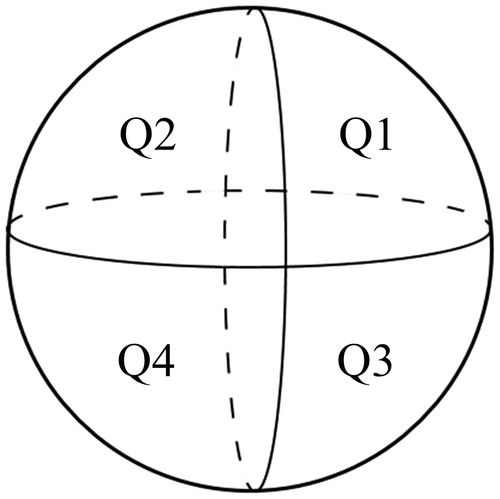
After registration, the images of index tumor and ablation zone were superimposed in a 3 D image. The index tumor was marked in yellow in order to improve the contrast between the tumor and ablation zone. The 3DCEUS-FI made it possible to estimate whether the ablation zone had completely covered the tumor in all directions. If the tumor was completely ablated, the AM was measured on the 3DCEUS fusion images. Based on the results of AM evaluation, all patients were divided into two groups: AM <5 mm and AM ≥5 mm. If the distance between the tumor and large vessels or the liver surface was less than 5 mm and the boundary of ablation zone reached the large vessels or liver surface, AM ≥5 mm was still considered obtained. To describe the position of the unachieved AM, the tumor was divided into four quadrants by two orthogonal planes (axial and vertical) crossing at the center of the tumor. The two cephalic quadrants of the four total quadrants were numbered 1–2, and the two caudal quadrants were numbered 3–4, both from left to right (). If the tumor was not completely ablated, an additional RFA was carried out. After the additional RFA, 3DCEUS volumetric data was required to be acquired again, and then treatment response and AM were re-analyzed through the workstation until complete ablation was achieved.
Figure 1. Four quadrants used to describe direction of local tumor progression from center of tumor. The tumor was divided into four quadrants by two orthogonal planes (axial and vertical planes) crossing at the center of the tumor. (Q is short for Quadrant).
Treatment assessment and follow up
CECT and 2DCEUS were done 4–6 weeks after the treatment. Complete ablation was defined as non-enhancement in the ablated zone 4–6 weeks after ablation. Thereafter, the patients were followed-up once every 3 months. At each follow-up visit, patients were assessed based on clinical examination, α-fetoprotein and 2DCEUS. CECT was performed once every 6 months [Citation23]. The LTP lesion was diagnosed as enhancement at the arterial phase with wash out at the portal and delayed phase of the contrast-enhanced imaging examination inside or abutting the ablation zone [Citation24]. The LTP position was recorded according to the 1–4 quadrants mentioned above.
CT image fusion and measurement of the AM
All CT images of pre-RFA and post-RFA DICOM files were sent to the IQQA system (Intelligent Manual Qualitative Quantitative-Liver, EDDA Technology, USA) for processing. CT fusion were interpreted by two experienced radiologists both with 5 years of experience with abdominal CT, and consensus was obtained by discussion. The investigators were blind to the results of 3DCEUS-FI. Before registration, whether a tumor was at the subcapsular or perivascular location was recorded. Subcapsular HCC was defined as a lesion located less than 1 cm from the liver capsule [Citation25]. Perivascular HCC was defined as an index tumor with any contact with first- or second-degree branches of a portal or hepatic vein that was 3 mm or greater in axial diameter [Citation26]. The first step was to complete the 3 D reconstruction of the tumor, liver and vessels and it was preserved as the pre-operative data. The second step was to obtain a 3 D reconstruction of the ablation zone, liver and vessels, which was saved as the post-operative data. Then the post-operative data was associated with the pre-operative one, and a registration was performed. Finally, the pre-operative tumor information was overlaid on the post-RFA images. Different colors were used to outline the tumor, ablation zone and 5 mm AM in multiplanar reconstruction (MPR) mode.
Statistical analysis
The results are presented as the median ± SD (range). The agreement between CT and 3DCEUS fusion for the classification of an AM was expressed by the kappa coefficient. The LTP rate was compared using the Kaplan–Meier method. The relationship between each of the variables and LTP was estimated with a log-rank test. All data were analyzed using SPSS version 16.0 software (SPSS, Chicago IL, USA) and a p value of less than .05 was considered statistically significant.
Results
Patients and tumor profile
In total, 55 patients (47 men, 8 women; age range, 26–75 years; mean age ± SD, 56.0 ± 10.6 years) with 55 HCCs were analyzed (). The maximal diameter of the tumors ranged from 1.1 to 4.2 cm (mean ± SD, 2.0 ± 0.7 cm). A flow chart of the study was presented in . Demographic characteristics and index tumor profiles of 55 patients were summarized in .
Figure 2. Flow chart of the present study. RFA: radiofrequency ablation; 3DCEUS: three-dimensional contrast-enhanced ultrasound; CT: computed tomography; ICA: incomplete ablation; AM: ablative margin; LTP: local tumor progression.
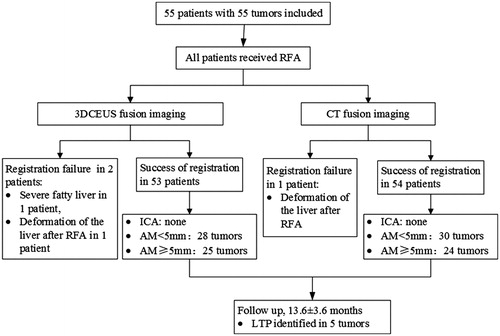
Table 1. Demographic characteristics and index tumor profiles of 55 patients.
3DCEUS-FI and measurement of the AM
The success rate of registration was 96.4% (53/55). The duration time of registration was 4.4 ± 1.9 min (range, 2–9 min), respectively. Two tumors were not successfully registered because of serious fatty liver and deformation of the liver after ablation, respectively. Complete ablation was achieved in a single session in all patients. AM evaluation resulted in 28 tumors with AM <5 mm and 25 tumors with AM ≥5 mm. ().
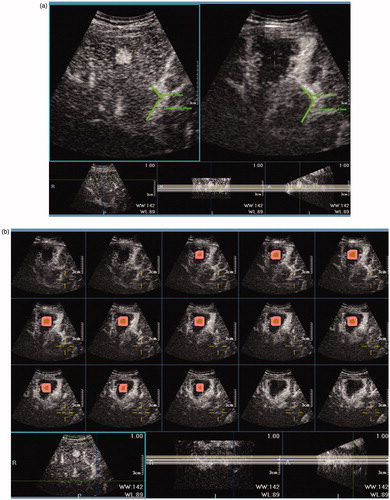
Figure 3. Image processing of 3DCEUS-FI in a case of a 59-year-old man with HCC. (a): After registration, one arbitrary landmark was marked on pre-RFA images and the virtual location was mapped on post-ablation images. Registration error (the distance between the virtual and real location of the landmark) was 0. (b–d): The multiplanar reformation images of 3DCEUS-FI showed the ablative margin >5 mm. The tumor was marked in yellow, and 5 mm ablative margin area was marked in pink adjacent to the tumor. The non-enhanced ablation zone completely covered the tumor and 5 mm ablative margin area in the coronal (b), sagittal (c) and axial plane (d).
CT fusion and evaluation of AM
The registration success rate of CT fusion was 98.2% (54/55). One tumor was not successfully registered because of deformation of the liver after ablation. AM evaluation resulted in 31 tumors with AM <5 mm and 23 tumors with AM ≥5 mm.
Comparison of the classification of AM between 3DCEUS-FI and CT fusion imaging
AM evaluation was successful both on 3DCEUS and CT fusion imaging in 53 (96.4%) tumors. In 23 tumors evaluated as AM ≥5 mm by CT fusion, all were evaluated as AM ≥5 mm by 3DCEUS-FI. In 30 tumors evaluated as AM <5 mm by CT fusion, 28 tumors were evaluated as AM <5 mm while 2 tumors were evaluated as AM ≥5 mm by 3DCEUS-FI. The overall agreement between 3DCEUS and CT fusion imaging was excellent (kappa = 0.924, p < .001) (, ).
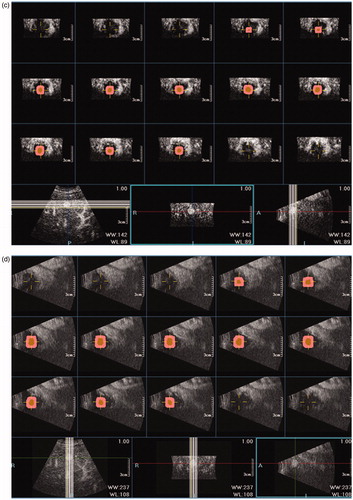
Figure 4. 3DCEUS and CT fusion of an insufficient ablative margin in a 57-year-old man with HCC. (a): The ablation zone (marked in red line) covered the tumor (marked in orange) completely after 3DCEUS fusion, but 5 mm ablative margin was not achieved on the upper-left (Quadrant 1) of the tumor. (b): CECT obtained before RFA showed a low-attenuating tumor (arrow) in venous phase. (c): CECT obtained 1 month after RFA showed the ablation zone in arterial phase. The treatment response was considered complete ablation. (d): CT fusion showed the tumor was covered by translucence ablation zone (green) successfully, but it was an eccentric overlap. (e): The pre-RFA tumor was overlaid on the post-RFA images. It was shown that ablative margin was insufficient on Quadrant 1 as the ablation zone margin (green) intersected with the tumor margin and did not cover 5 mm ablative margin area (purple). (f): CECT obtained 7 months after RFA shows LTP as peripheral hypo-enhanced lesion (arrow) adjacent to the treated area in venous phase. LTP occurred in the section where 5 mm ablative margin was not achieved.
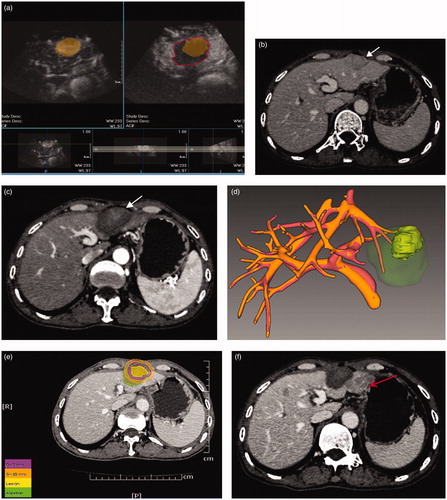
Table 2. Comparative evaluation of 3DCEUS fusion imaging with CT fusion imaging in the assessment of AM for 53 patients who were successful both on 3DCEUS and CT fusion imaging.
Tumor response and LTP
The median follow-up was 13.6 months (range 5.6–18.0 months). The LTP was identified in 5 tumors (9.4%, 5/53) during the follow-up period. All of the LTPs occurred in the area in which the unachieved 5 mm AM was evaluated on 3DCEUS-FI. The median time to LTP was 7.7 months (range 4.9–16.6 months). showed the determinants of LTP. AM <5 mm was significantly related to LTP. The cumulative rate of LTP at 18 months was significantly higher for HCCs in group A than in group B (28% versus 0%; p = .033, log-rank test) ().
Figure 5. Curves of local tumor progression, calculated by the Kaplan–Meier method, according to the presence or absence of AM ≥5 mm. The log-rank test result shows that over time the presence or absence of AM ≥5 mm by 3DCEUS fusion was associated with a significantly higher rate of local tumor progression.
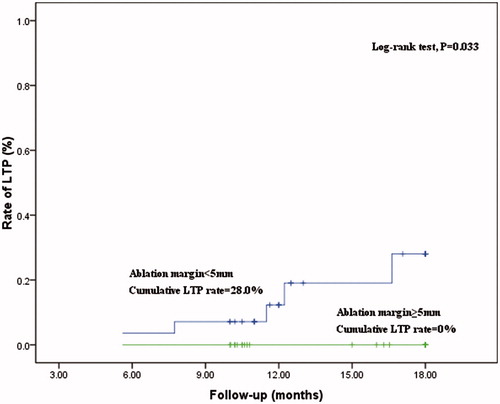
Table 3. Determinants of LTP by Kaplan–Meier method and log-rank test in 53 patients that were successful both on 3DCEUS and CT fusion imaging.
Discussion
To the best of our knowledge, 3DCEUS-FI is a novel mono-modality fusion imaging technique that had not been reported. The results of the present study support the feasibility of 3DCEUS-FI for evaluating treatment effect and AM immediately after ablation of HCC on account of the following evidence: First, the mono-modality fusion process could be achieved in several minutes, which indicates it is convenient and efficient. This high cost-effective technique made it possible to evaluate the AM immediately after RFA procedure without ionizing radiation exposure to patients. Moreover, CT/MRI DICOM images were not needed in performing 3DCEUS fusion. Differing from multi-modality fusion imaging such as BUS/2DCEUS-CT/MRI [Citation18,Citation27], registration applied in this technique did not depend on electromagnetic positioning. Therefore, an electromagnetic positioning device was not necessary in the ultrasound machine.
Second, a high success rate was obtained for 3DCEUS-FI. The results showed that the overall registration success rate was 96.4% (53/55). In this study, the margin of the tumor and its virtual 5 mm AM were mapped to the post-RFA 3DCEUS volume data after registration and outlining the tumor margin. The treatment effect could be assessed quantitatively and intuitively by observing whether the non-enhanced ablation zone completely covered the tumor and virtual AM in MPR mode. 3DCEUS fusion technique works on the principle of identifying vessels in different layers as landmarks to realize spatial localization and fuse pre-RFA and post-RFA volume data, which is similar to CT fusion. Therefore, the obtained volume data should include information of blood vessels around the tumor. Promisingly, registration success rate was high with artificial positioning of corresponding vessels on pre-RFA and post RFA images. In addition, it requires that the patient posture, respiration phase and imaging parameters setting of the ultrasound scanner to be exactly kept the same before and after RFA, so as to avoid potential angle deviation to improve the registration success rate.
Third, 3DCEUS-FI enables comparably precise AM evaluation as CT fusion imaging, which is considered to be an accurate method [Citation19,Citation28–31]. In this study, agreement of both methods in the assessment of AM was high (96.2%) and this was confirmed by a kappa coefficient of 0.924. In two out of 53 nodules assessed as AM ≥5 mm on 3DCEUS-FI, the CT fusion showed AM <5 mm. The shrinkage of the ablation zone during the interval of more than a month between pre- and post-RFA CT might have affected the result in these two patients. Guibal et al [Citation32] found that the mean volume of the ablated area was a maximum of 1 week after RFA procedure and shrank slowly over time. Cassinotto et al [Citation33] elaborated that the mean volume of the ablation zone decreased over time, approximately to 30% at 1.6 months after RFA. In this study, the interval between pre-RFA and post RFA CT did not greatly affect the AM evaluation consistency between these two modalities.
Most importantly, the AM <5 mm measured on the 3DCEUS-FI was found to be significantly related to LTP, which demonstrated that 3DCEUS-FI provided an accurate evaluation of the AM. Moreover, all LTPs occurred in the section in which 5 mm AM was not achieved. The AM has been considered as the most important risk factor for LTP [Citation34], and was clearly proven by CT fusion imaging [Citation30,Citation31]. In clinical practice, the AM cannot be validated by pathology, and the LTP rate has been an indicator to test the accuracy of AM evaluation. An AM ≥5 mm has been reported to be necessary to prevent LTP [Citation11] because of the presence of microsatellite lesions around a main tumor [Citation35]. Therefore, all tumors were categorized into two groups on the basis of AM in this study. If tumors with AM <5 mm were detected in 3DCEUS-FI with precise evaluation immediately after RFA, an effective method could be implemented timely to improve the treatment effectiveness or determine whether close follow-up was needed. Although some previous studies reported tumor size and tumor location (subcapsular/perivascular location) were risk factors for LTP, in this study these three factors were not related to LTP.
The limitations of the present study are as follows: First, this is a single-center study with a relatively small number of patients and a short follow-up time. The assessment of AM by 3DCEUS-FI is a new field, and this study is a preliminary report. Second, the 3DCEUS images in this study were gained through a 3 D matrix probe that was inapplicable for patients with narrow intercostal space. Freehand sweeping system needs to be developed within the workstation in the future. Third, this pilot study was aimed at authenticating the feasibility and accuracy of 3DCEUS-FI in evaluating AM and predicting LTP. Further studies of this technique with intra-ablation management for HCC are warranted to validate its value in lowering LTP rate.
3DCEUS-FI enables AM evaluation for HCC immediately after RFA with comparable accuracy to CT fusion imaging. AM <5 mm evaluated by 3DCEUS-FI has a high predictive value for LTP.
Disclosure statement
No potential conflict of interest was reported by the authors.
Additional information
Funding
References
- Torre LA, Bray F, Siegel RL, et al. Global cancer statistics, 2012. CA Cancer J Clin. 2015;65:87–108.
- Heimbach J, Kulik LM, Finn R, et al. Aasld guidelines for the treatment of hepatocellular carcinoma. Hepatology (Baltimore, MD). 2017;67:358–380.
- Nishikawa H, Kimura T, Kita R, et al. Radiofrequency ablation for hepatocellular carcinoma. Int J Hyperthermia. 2013;29:558–568.
- Bruix J, Sherman M, Llovet JM, et al. Clinical management of hepatocellular carcinoma. Conclusions of the Barcelona-2000 EASL conference. European Association for the study of the liver. J Hepatol. 2001;35:421–430.
- Makuuchi M, Kokudo N, Arii S, et al. Development of evidence-based clinical guidelines for the diagnosis and treatment of hepatocellular carcinoma in Japan. Hepatol Res. 2008;38:37–51.
- Bruix J, Sherman M. Management of hepatocellular carcinoma: an update. Hepatology. 2011;53:1020–1022.
- Lam VW, Ng KK, Chok KS, et al. Risk factors and prognostic factors of local recurrence after radiofrequency ablation of hepatocellular carcinoma. J Am Coll Surg. 2008;207:20–29.
- Xia F, Lai EC, Lau WY, et al. High serum hyaluronic acid and HBV viral load are main prognostic factors of local recurrence after complete radiofrequency ablation of hepatitis B-related small hepatocellular carcinoma. Ann Surg Oncol. 2012;19:1284–1291.
- Berber E, Siperstein A. Local recurrence after laparoscopic radiofrequency ablation of liver tumors: an analysis of 1032 tumors. Ann Surg Oncol. 2008;15:2757–2764.
- Kei SK, Rhim H, Choi D, et al. Local tumor progression after radiofrequency ablation of liver tumors: analysis of morphologic pattern and site of recurrence. Am J Roentgenol. 2008;190:1544–1551.
- Nakazawa T, Kokubu S, Shibuya A, et al. Radiofrequency ablation of hepatocellular carcinoma: correlation between local tumor progression after ablation and ablative margin. Am J Roentgenol. 2007;188:480–488.
- Ayav A, Germain A, Marchal F, et al. Radiofrequency ablation of unresectable liver tumors: factors associated with incomplete ablation or local recurrence. Am J Surg. 2010;200:435–439.
- Liu M, Huang GL, Xu M, et al. Percutaneous thermal ablation for the treatment of colorectal liver metastases and hepatocellular carcinoma: a comparison of local therapeutic efficacy. Int J Hyperthermia. 2017;33:446–453.
- Crocetti L, Della Pina C, Cioni D, et al. Peri-intraprocedural imaging: US, CT, and MRI. Abdom Imaging. 2011;36:648–660.
- Lu MD, Yu XL, Li AH, et al. Comparison of contrast enhanced ultrasound and contrast enhanced CT or MRI in monitoring percutaneous thermal ablation procedure in patients with hepatocellular carcinoma: a multi-center study in China. Ultrasound Med Biol. 2007;33:1736–1749.
- Meloni MF, Andreano A, Franza E, et al. Contrast enhanced ultrasound: should it play a role in immediate evaluation of liver tumors following thermal ablation? Eur J Radiol. 2012;81:e897–e902.
- Wang XL, Li K, Su ZZ, et al. Assessment of radiofrequency ablation margin by MRI-MRI image fusion in hepatocellular carcinoma. World J Gastroenterol. 2015;21:5345–5351.
- Li K, Su Z, Xu E, et al. Evaluation of the ablation margin of hepatocellular carcinoma using CEUS-CT/MR image fusion in a phantom model and in patients. BMC Cancer. 2017;17:61.
- Tang H, Tang Y, Hong J, et al. A measure to assess the ablative margin using 3D-CT image fusion after radiofrequency ablation of hepatocellular carcinoma. HPB. 2015;17:318–325.
- Sakakibara M, Ohkawa K, Katayama K, et al. Three-dimensional registration of images obtained before and after radiofrequency ablation of hepatocellular carcinoma to assess treatment adequacy. Am J Roentgenol. 2014;202:W487–W495.
- Xu EJ, Lv SM, Li K, et al. Immediate evaluation and guidance of liver cancer thermal ablation by three-dimensional ultrasound/contrast-enhanced ultrasound fusion imaging. Int J Hyperthermia. 2018;34:870–876.
- Xu HX, Lu MD, Xie XH, et al. Three-dimensional contrast-enhanced ultrasound of the liver: experience of 92 cases. Ultrasonics. 2009;49:377–385.
- Ahmed M, Solbiati L, Brace CL, et al. Image-guided tumor ablation: standardization of terminology and reporting criteria - a 10-year update. Radiology. 2014;273:241–260.
- Yu J, Liang P, Yu XL, et al. Local tumour progression after ultrasound-guided microwave ablation of liver malignancies: risk factors analysis of 2529 tumours. Eur Radiol. 2015;25:1119–1126.
- Sartori S, Tombesi P, Macario F, et al. Subcapsular liver tumors treated with percutaneous radiofrequency ablation: a prospective comparison with nonsubcapsular liver tumors for safety and effectiveness. Radiology. 2008;248:670–679.
- Kang TW, Lim HK, Lee MW, et al. Perivascular versus nonperivascular small HCC treated with percutaneous RF ablation: retrospective comparison of long-term therapeutic outcomes. Radiology. 2014;270:888–899.
- Makino Y, Imai Y, Igura T, et al. Feasibility of extracted-overlay fusion imaging for intraoperative treatment evaluation of radiofrequency ablation for hepatocellular carcinoma. Liver Cancer. 2016;5:269–279.
- Fujioka C, Horiguchi J, Ishifuro M, et al. A feasibility study: evaluation of radiofrequency ablation therapy to hepatocellular carcinoma using image registration of preoperative and postoperative CT. Acad Radiol. 2006;13:986–994.
- Kim YS, Lee WJ, Rhim H, et al. The minimal ablative margin of radiofrequency ablation of hepatocellular carcinoma (>2 and <5 cm) needed to prevent local tumor progression: 3D quantitative assessment using CT image fusion. Am J Roentgenol. 2010;195:758–765.
- Kim KW, Lee JM, Klotz E, et al. Safety margin assessment after radiofrequency ablation of the liver using registration of preprocedure and postprocedure CT images. Am J Roentgenol. 2011;196:W565–W572.
- Tomonari A, Tsuji K, Yamazaki H, et al. Feasibility of fused imaging for the evaluation of radiofrequency ablative margin for hepatocellular carcinoma. Hepatol Res. 2013;43:728–734.
- Guibal A, Bertin C, Egels S, et al. Contrast-enhanced ultrasound (CEUS) follow-up after radiofrequency ablation or cryoablation of focal liver lesions: treated-area patterns and their changes over time. Eur Radiol. 2013;23:1392–1400.
- Cassinotto C, Denys A, Gay F, et al. Radiofrequency ablation of liver tumors: no difference in the ablation zone volume between cirrhotic and healthy liver. Cardiovasc Intervent Radiol. 2018;41:905–911.
- Liu CH, Arellano RS, Uppot RN, et al. Radiofrequency ablation of hepatic tumours: effect of post-ablation margin on local tumour progression. Eur Radiol. 2010;20:877–885.
- Okusaka T, Okada S, Ueno H, et al. Satellite lesions in patients with small hepatocellular carcinoma with reference to clinicopathologic features. Cancer. 2002;95:1931–1937.