
 ?Mathematical formulae have been encoded as MathML and are displayed in this HTML version using MathJax in order to improve their display. Uncheck the box to turn MathJax off. This feature requires Javascript. Click on a formula to zoom.
Abstract
Purpose: This study aimed to evaluate the immediate efficacy of magnetic resonance (MR)-guided microwave ablation (MWA) in rabbit kidneys implanted with VX2 tumors.
Materials and methods: MR-guided MWA was performed in eight VX2 tumor-bearing rabbits. MR images after ablation were obtained and analyzed. The differences between the tissue specimens and MR images obtained after ablation were compared.
Results: On the three-dimensional volumetric interpolated breath-hold T1-weighted (3D-VIBE-T1WI) sequence, a low signal intensity indicated the primary tumor at the center of the ablation area, which was surrounded by a peripheral high-signal area. The signal for the primary tumor in the fast spin-turbo spin-echo T2-weighted (FS-TSE-T2WI) sequence was lower than before, and the ablation zone showed a low signal that completely covered the primary tumor. There was no significant difference in volume among the low-signal areas of the primary tumor on FS-TSE-T2WI before MWA, the central low-signal area on 3D-VIBE-T1WI after MWA, and the tumor coagulation necrosis area on the tissue specimens (p > 0.05). No significant difference was found in the volume of ablation zones among the tissue specimens, the high-signal area around the lesion on the 3D-VIBE-T1WI sequence, and the low-signal area covering the lesion on the FS-TSE-T2WI sequence (p > 0.05).
Conclusion: Magnetic resonance imaging (MRI) is an effective method for immediate efficacy evaluation of rabbit renal VX2 tumors after MWA and can serve as a valuable reference for the clinical assessment of post-ablative renal tumors.
Introduction
Over the past decades, the global incidence of renal cell carcinoma (RCC) has continued to grow at the rate of 2%–3% per year [Citation1]. With the recent development and application of modern medical imaging techniques, the detection rate of early-stage RCC has gradually increased. According to a previous report by Lane et al. [Citation2], early-stage RCC accounts for approximately 60% of the cases of new-onset renal cancer.
Over the last 20 years, radiofrequency ablation (RFA), microwave ablation (MWA), cryoablation (CA), and other techniques have been gradually used for minimally invasive treatment of renal tumors. These therapeutic modalities are now becoming alternative options for conventional surgical resection. In follow-up studies after ablation, contrast-enhanced ultrasound (US), computed tomography (CT) enhanced, and magnetic resonance imaging (MRI) enhanced scans have been reported to play important roles for evaluation of the ablation area and for surveillance of recurrence and residual tumors [Citation3]. To ensure complete ablation, it is essential to improve the ablation techniques and refine the imaging guidance [Citation4]. As more patients undergo renal ablation procedures, the findings of immediate post-ablation imaging are becoming increasingly significant to avoid tumor relapse.
MRI can provide higher tissue contrast resolution and allow three-dimensional scanning, especially because of its unique sensitivity to temperature changes, making it the most ideal image monitoring method [Citation5]. At present, there are no detailed reports on the immediate efficacy evaluation of renal tumor ablation under MR guidance. Therefore, this study aimed to assess the immediate changes on MR images after rabbit kidney VX2 tumor ablation. In addition, we compared the ablation size between tissue specimens and MR images obtained after ablation in order to determine MRI-pathology correlation.
Materials and methods
Establishment of the rabbit VX2 renal tumor model
The research protocol was approved by the animal ethics review committee of Fujian Medical University. Twelve male New Zealand white rabbits (age range, 12–16 weeks; Wu’s Animal experimental center, Minhou county, Fujian Province) weighing between 2.1 and 2.5 kg were used in this study. The VX2 cell line used for tumor implantation was provided by Shanghai Aolu Biotechnology Co., Ltd. For all experiments and procedures, anesthesia was induced by using an intramuscular injection of ketamine (50 mg/mL, 1 mL/kg, Fujian Gutian Pharmaceutical Co., Ltd.). The VX2 cell line stored in dry ice was quickly thawed by incubating in a 37 °C water bath for 2 min. After centrifugation at 1000 r/s for 3 min, the frozen stock solution was removed. The tumor mass was resuspended in phosphate-buffered saline (PBS) on a sterilized bench, transferred onto a plate, and cut into approximately 1 mm3 blocks using a pair of surgical scissors. After resuspension in 1 mL of PBS, the VX2 tumor cells were transferred into a syringe with a No. 9 needle (diameter = 1 mm), and then injected into the thigh muscle of the rabbits.
After 2–3 weeks, tumors were formed in the rabbit legs. After anesthesia, skin preparation, and sterilization, the rabbits were positioned on an operating table. After routine disinfection and toweling, the skin and fascia were cut, while the muscle fibers were bluntly separated to expose the tumor. The fish-meat-like tumor tissues were excised; the necrotic tissue and part of the fibrous connective tissue were removed; and the tumor was placed in a culture dish containing penicillin and saline in a 1:40 ratio. The tumor tissues were repeatedly sheared into 1 mm3 tissue blocks by using a pair of ophthalmic surgical scissors.
All 12 rabbits were fasted for 6 h before puncture. After ketamine injection for anesthesia, the fur on both sides of the rabbit spine was removed. The rabbits were placed on a CT (Somatom Emotion, Siemens, Germany) scan bed, and positioned with a self-made positioning fence. To reduce the mortality and infection rates following the puncture wound, all rabbits received implantation in only one kidney. After scanning in the positioning phase, the self-made positioning fence was used to select the best puncture point, followed by the determination of the puncture path and direction and accurate measurement of the distance from the puncture point to the predetermined implanted tumor position. For implantation of tumors in the renal cortex, we attempted to implant the tumor tissue block in the upper or lower pole of the kidney (). After routine disinfection and draping, a 17G puncture needle (GALLINI S.r.l) was gradually inserted at a predetermined angle.
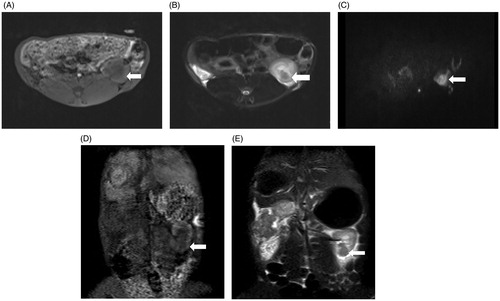
Figure 1. CT-guided implantation process. (A) Self-made positioning fence. (B) Self-made positioning fence (white arrow) displayed on a CT image. (C) The axial scan showed that the puncture needle had punctured into the lower pole of the kidney. (D) Coronal reconstruction indicates the full length of the needle and a more intuitive display of the needle tip position.
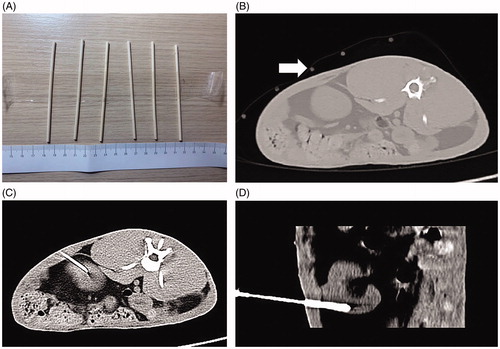
Multiple scans were conducted during the operation, and the needle was gradually punctured until it reached the predetermined position. After pulling out the needle core, the needle was fixed, and three to five pieces of freshly prepared tumors were transferred into the needle sheath with the assistance of an ophthalmology clip. A needle core was used to push the tumor blocks into the kidney tissue, and the core was then pulled out after injecting 1 mL of saline to seal the needle track. A CT scan was performed again to observe the occurrence of complications, including subcapsular hematoma and perirenal hematoma. After 2–3 weeks, the rabbit kidneys were scanned with MRI to monitor tumorigenesis. Two rabbits carrying renal VX2 tumors were randomly assigned for sacrificing and subsequent pathological examination.
Ablation procedure
The microwave unit (MTC-3C, Weijing, Nanjing, China) is capable of producing 100 W (maximum) of power at 2450 MHz. The needle antenna (MTC-3CA-II24, Weijing, Nanjing, China) has a diameter of 2 mm (14 gauge) and a length of 15 cm. The magnetic resonance scanners and sequences were as follows: ablation treatment was performed in a 1.5 T MR scanner (Magnet Espree, Siemens, Germany), and a circular surface coil was placed over the rear flank. MR images were obtained using 3D-volumetric interpolated breath-hold examination T1-weighted imaging (3D-VIBE-T1WI) sequence (TR = 5.04 ms, TE = 2.39 ms, flip angle [FA] = 10°, field of view [FOV] = 20 cm × 20 cm, slice thickness = 3 mm, acquisition time = 12 s, number of excitation [NEX] = 1), fat suppression turbo spin-echo T2-weighted imaging (FS-TSE-T2WI) sequence (TR = 2000 ms, TE = 78 ms, FA = 150°, FOV = 20 cm × 20 cm, slice thickness = 3 mm, acquisition time = 59 s, NEX = 2), and diffusion-weighted imaging (DWI) sequence (TR = 1500 ms, TE = 94 ms, b = 50–800 s/mm3, FOV = 20 cm × 20 cm, acquisition time = 75 s, NEX = 6).
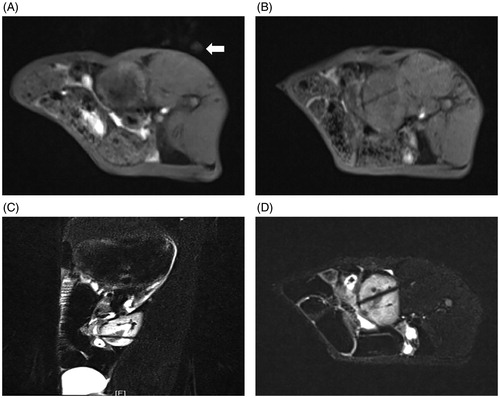
Body surface localization was performed by administering a vitamin E capsule into tumor-bearing rabbits following general anesthesia. After MR scanning, an ablation plan was made to determine and record the puncture point on the body surface. The angle and depth of needle insertion were measured simultaneously. After routine disinfection and draping, under MRI guidance, a disposable magnetic compatible water-cooled needle antenna was used to gradually insert the needle at the predetermined angle and depth. Subsequently, FS-TSE-T2WI oblique transverse and oblique-coronal scans were performed along the long axis of the needle antenna in order to confirm the depth and direction of the microwave antenna and the relationship between the needle tip and tumor location. The renal collecting system was avoided during the puncture process. After verifying that the microwave antenna was located at the center of lesion and penetrated the lesion (), the microwave antenna was fixed, water-cooled circulation was connected to the coaxial cable, and the water-cooled circulation hose was prepared with 500 mL of normal saline. Then, the power supply and circulating water pump of the MWA therapeutic apparatus were turned on; the microwave output power was set at 50–60 W; and MWA was conducted for approximately 3–5 min. After completing MWA treatment, the power supply, water cooling cycle, and coaxial cable were disconnected. MRI scanning was performed immediately to determine the MRI signal characteristics of the ablation lesions, and the immediate efficacy of MR-guided MWA was evaluated.
Figure 2. MR-guided puncture of renal tumors. (A) Preoperative surface localization by a vitamin E capsule (white arrow). (B) The 3D-VIBE-T1WI axial scan revealed that the needle antenna was punctured into the kidney, but its relationship with the lesion could not be distinguished. FS-TSE-T2WI oblique-coronal (C) and oblique-axial (D) scans obviously indicated that the needle antenna was positioned within the renal tumor.
MRI and pathological examination after ablation
The criteria for evaluating the immediate effects of ablation were as follows: (i) the ablation area was completely covered; and (ii) more than 0.5 cm beyond the edge of the tumor. If the low-signal or high-signal area on 3D-VIBE-T1WI and FS-TSE-T2WI sequences could not completely surround or cover the original tumor or less than 0.5 cm beyond the edge, incomplete ablation was considered and supplementary ablation was performed.
Eight experimental rabbits were sacrificed by air embolism procedure under anesthesia. Then, pedestrian-shaped incisions were made along the costal margin of both sides to expose the abdominal cavity, open the retroperitoneum, expose the ablated kidney, and cut off the renal arteriovenous and ureter. The specimen was collected and washed thoroughly with normal saline. Gross pathological examination was performed, after which the specimens were paraffin-embedded and cut into slices. After hematoxylin-eosin (HE) staining, the pathological changes in the specimens were observed under a microscope.
Measurement and calculation methods
The gross specimens of rabbit kidney tumors were taken out from the sacrificed rabbits, and the ablation areas were incised along the MWA needle path. Subsequently, the maximal longitudinal, anteroposterior, and transverse diameters that were orthogonal to the needle path, including the ablation zone and tumor coagulation necrosis area within the ablation zone, were measured. Likewise, the data of the high-signal area and the central low-signal area after ablation on the 3D-VIBE-T1WI sequence, the low-signal area covering the lesion on the FS-TSE-T2WI sequence after ablation, and the FS-TSE-T2WI low-signal area before ablation were determined using multiplanar direct image acquisition with MRI. Both tumor and ablation zone volumes were calculated using the equation for a biplane ellipsoid model:
where D1, D2, and D3 represent the maximal longitudinal, anteroposterior, and transverse diameters, respectively.
Statistical analysis
Statistical analyses were performed using SPSS version 22.0 software (Chicago, IL). All data were presented as mean ± standard deviation (SD) values. One-way analysis of variance (ANOVA) was used to compare the differences in the volume among the tumor coagulation necrosis areas within the ablation zone of tissue specimens, the central low-signal area after ablation on the 3D-VIBE-T1WI sequence, and the FS-TSE-T2WI low-signal area before ablation. In the same way, the differences in the volume of ablated zone among the 3D-VIBE-T1WI sequences, FS-TSE-T2WI sequences, and tissue specimens were compared. p Values less than 0.05 were considered statistically significant.
Results
Growth and pathological examination of VX2 tumors
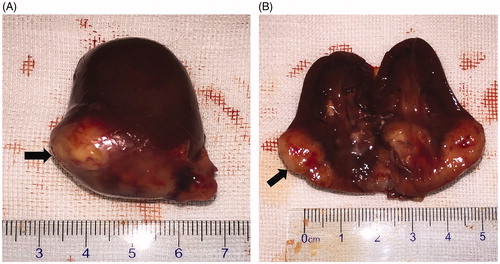
Among the 12 experimental rabbits, intrarenal VX2 tumors were successfully implanted in 11 rabbits, with a tumor formation rate of 91.7% (11/12). Specifically, three lesions were noted on the left kidney and the remaining eight were on the right kidney. The results of gross pathological examination before MWA are presented in . The VX2 tumor implanted in renal tissue was white in color on the cut surface, and the boundary between the normal renal parenchyma and tumor was not clear.
Figure 3. Gross pathological examination before MWA. (A) The tumor was located in the lower pole of the kidney (arrow). (B) The tumor was white in color on the cut surface (arrow).
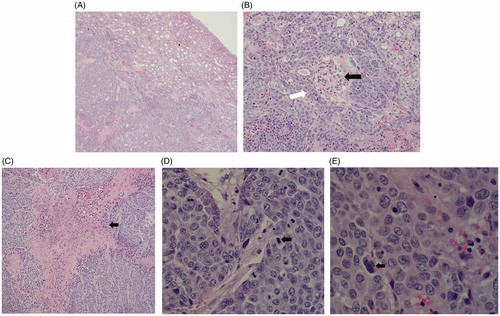
The light microscopic appearance on HE staining before ablation in the rabbit kidney is shown in . The tumor cells were nest-arranged and invaded into normal renal parenchyma, and coagulation necrosis was observed at the center of the cancer nest. Specifically, the chromatin of the nucleus was coarse granular, and an obvious nucleolus could be seen. A few intercellular bridges could be seen between the cells, but no keratinized beads were found.
Figure 4. Histopathological findings for the VX2 tumor in HE staining. (A) The tumor cells were nest-arranged and invaded the normal renal parenchyma. (B) Residual glomerulus (black arrow) was destroyed partially by tumor cells (white arrow). (C) Coagulation necrosis was found in the center of the cancer nest. (D) Pathological mitotic figures of tumor cells could be seen (black arrow). (E) Tumor giant cell was found (black arrows).
Preoperative MR imaging findings
In MRI assessments, the tumors showed a heterogeneous iso-low signal on the 3D-VIBE-T1WI sequence; a circular low signal on the FS-TSE-T2WI sequence; and a high signal on the DWI sequence, as presented in .
Figure 5. MRI findings of the VX2 tumors in the left kidney. (A) The 1.5-Tesla 3D-volumetric interpolated breath-hold examination T1-weighted imaging analysis showed a heterogeneous iso-low signal. (B) The VX2 tumor showed a circular low signal, as indicated by 1.5-Tesla fat suppression turbo spin-echo T2-weighted imaging analysis. (C) Diffusion-weighted imaging analysis showed that VX2 tumors exhibited a high signal. 3D-VIBE-T1WI (D) and FS-TSE-T2WI coronal (E) scans revealed that the tumor was located in the lower pole of the left kidney.
As verified by the MRI scans, one experimental rabbit that received tumor implantation in the left kidney showed no obvious change in tumor formation and was thus considered to show implantation failure. One lesion was large in size (volume = 56.78 cm3) and invaded the entire normal kidney and perirenal tissue. Considering its excessive growth, this lesion was excluded from the experimental group. The average volume of the other 10 lesions was 1.03 ± 0.31 cm3 (range: 0.44–1.38 cm3). Moreover, the anatomical characteristics of the 10 renal tumors on MRI were quantified according to the nephrometry scoring system (R.E.N.A.L Nephrometry Score) [Citation6], (; ). No complications such as subcapsular hematoma and perirenal hematoma were found in the rabbits. Thus, eight lesions from eight experimental rabbits were included in this analysis ().
Figure 6. Explanation of the nephrometry scoring system. (A) R (radius): tumors ≤4 cm are assigned 1 point, those >4 but <7 cm are assigned 2 points, and those >7 cm are assigned 3 points. (B) E (exophytic/endophytic): tumors that are 50% or more exophytic are assigned 1 point, tumors that are less than 50% exophytic are assigned 2 points, those that are completely inside the renal cortex are assigned 3 points. (C) N (nearness): Tumors that are ≥7 mm far from the collecting system or sinus are assigned 1 point, tumors that are >4 but <7 mm far from the collecting system or sinus are assigned 2 points, and those <7 mm far are assigned 3 points. (D) A (anterior): If the tumor is located on the ventral surface, the suffix “a” is assigned; if it is located on the dorsal surface, the suffix “p” is assigned; and if it is not possible to clearly identify the location of tumor, the suffix “x” is assigned. (E) L (location): If tumors are entirely located above or below the polar lines, then 1 point is assigned, tumors that exceed the polar lines but within <50% are assigned 2 points, and those that exceed >50% or entirely between the upper polar line and lower polar line are assigned 3 points.
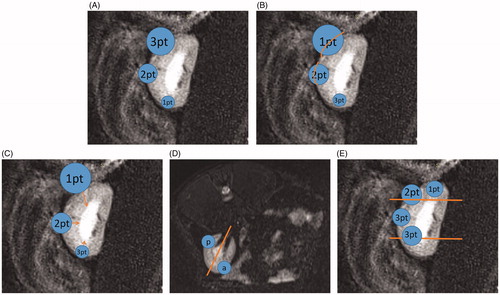
Figure 7. Flow chart of the study.
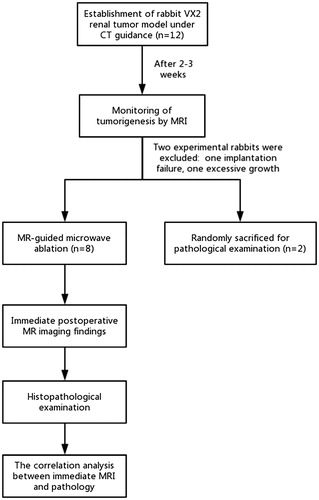
Table 1. Score assignment for the 10 successfully implanted tumors.
Immediate postoperative MR imaging findings
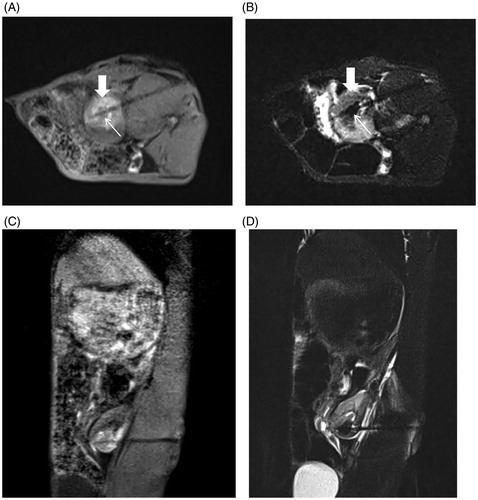
The immediate MRI findings for rabbit renal VX2 tumors after MWA on the 3D-VIBE-T1WI sequence indicated a typical “target sign.” Notably, the original tumor in the center of the ablation zone showed a low signal intensity surrounded by high signal intensity in the ablation zone with a clear boundary. On the FS-TSE-T2WI sequence, the signal intensity of the original tumor was lower than that before, and the ablation zone displayed a low signal intensity and completely covered the lesion with an unclear boundary. On the DWI sequence, the ablation zone showed a high signal intensity ().
Figure 8. Immediate efficacy of postoperative MR-guided MWA. (A). 3D-VIBE-T1WI sequence typically indicated a “target sign.” Notably, the original tumor in the center of the ablation zone showed low signal intensity (thin arrow), and a high signal intensity completely surrounded the primary tumor with a clear boundary in the ablation zone (thick arrow). (B) On FS-TSE-T2WI, the signal intensity of the primary tumor was lower than that before (thin arrow), while the lesion with an unclear boundary was completely covered with a low signal intensity in the ablation zone (thick arrow). 3D-VIBE-T1WI (C) and FS-TSE-T2WI (D) oblique-coronal scans clearly revealed the location of the ablation zone.
Pathological examination of the ablation zone
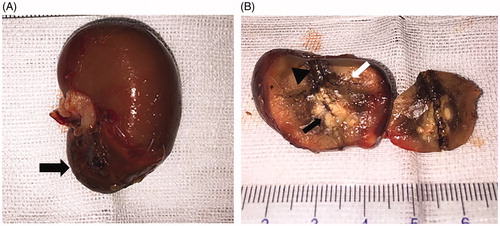
The results of gross pathological examination after MWA are presented in . Notably, the ablative change showed a black carbonized needle track along the microwave antenna path with yellow-white coagulation necrosis in the center of original tumor and another gray-yellow coagulation necrosis area beside the tumor. Moreover, a dark red band congestion and edema area were detected around the ablative lesion.
Figure 9. Gross pathological examination after ablation. (A) Ablated tumor was located in the lower pole of the left kidney (black arrow). (B) The ablative change showed a black carbonized needle track along the microwave antenna path (black triangle) with yellow-white coagulation necrosis in the center of the original tumor (black arrow). Another gray yellow coagulation necrosis area was also found besides the tumor (white arrow). Moreover, a dark red band congestion and edema area was detected around the ablative lesion.
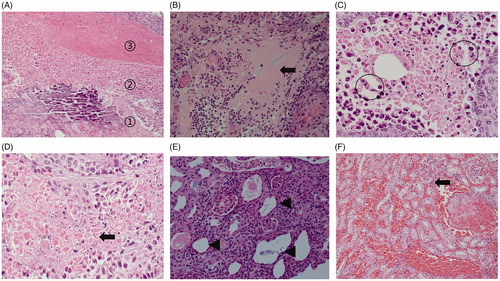
The light microscopic appearance of HE staining after VX2 tumor ablation in rabbit kidney is shown in . The ablation zone was divided into coagulation necrosis of tumor nests, coagulation necrosis of normal renal parenchyma, and the congestion and edema band, from the inside to outside. The coagulation necrosis area of the tumor showed a residual cell outline with karyolysis. In addition, pink exudate was found in the coagulation necrosis area of normal renal parenchyma. Moreover, the peripheral congestion and edema band showed diffuse hemorrhage and infiltration of lymphocytes.
Figure 10. Histopathological findings of the renal ablation zone determined by HE staining. (A) The ablation zone was divided into three different zones: coagulation necrosis of tumor nests ①, coagulation necrosis of normal renal parenchyma ②, and congestion and edema band③. (B) Pink exudate was found in the coagulation necrosis area of normal renal parenchyma (black arrow). (C) Markedly dilated spaces between the cords of neoplastic cells (circles). (D) Coagulation necrosis area of the tumor showed a residual cell outline with karyolysis (black arrow). (E) Tubular dilatation was found in the tumor coagulation necrosis area (black triangle). (F) Infiltration of lymphocytes (black arrow) in the hemorrhagic zone (A, ×4; B, E, and F, ×20; C and D, ×40 magnification).
Measurement results
For tissue specimens, the mean volume of the ablation zone was 2.51 ± 0.82 cm3, while that of the tumor coagulation necrosis area within the ablation zone was 1.01 ± 0.29 cm3. On the 3D-VIBE-T1WI sequence, the mean volume of the high signal intensity ablation zone after MWA was 2.27 ± 0.82 cm3, whereas that of the central low-signal area after MWA was 0.93 ± 0.27 cm3. On the FS-TSE-T2WI sequence, the mean volume of the low-signal area of the ablation zone after MWA was 2.38 ± 0.91 cm3; and that of the low-signal area corresponding to the primary tumor before MWA was 0.98 ± 0.33 cm3 ( and ). There was no significant difference in the volume of the FS-TSE-T2WI low-signal area of the primary tumor before MWA, the central low-signal area on 3D-VIBE-T1WI after MWA, and the tumor coagulation necrosis area within the ablation zone on tissue specimens (p > 0.05). Similarly, no significant difference was found in the volume among the ablation zone on tissue specimens, the high-signal area around the tumor lesion in 3D-VIBE-T1WI, and the low-signal area in FS-TSE-T2WI (p > 0.05).
Table 2. Comparison of the volume of tumors between MR images and tissue specimens.
Table 3. Comparison of the ablation zone size between MR images and tissue specimens.
Discussion
Microwaves are an electromagnetic radiation categorized between infrared and radio waves, and their frequency ranges from 300 MHz to 30 GHz in the electromagnetic spectrum, including the most two common frequencies used for microwave ablation: 915 MHz and 2.45 GHz. When electromagnetic energy from microwave antenna is applied to tissue, the molecules (e.g., water) with an intrinsic dipole moment are forced to rotate. This rotation results in an increase in kinetic energy, and eventually, an increase in temperature between tissues [Citation7,Citation8].
US and CT are the most commonly used image guidance methods for MWA of renal tumors. However, due to the high-echoic water vapor generated by high temperature during ultrasound-guided MWA, it is difficult to evaluate the immediate efficacy of ablation treatment. In CT-guided thermal ablation, the changes in the ablation zone on unenhanced CT images, such as perinephric fat stranding and perirenal fascial thickening, are too subtle, making it difficult to monitor the completeness of ablation [Citation9]. In comparison with US and CT guidance, the use of MRI-guided ablation offers unique advantages: (i) MRI does not exhibit ionizing radiation and, like US, confers no radioactive damage to both patient and operator, and some open MRI devices can guide puncture in real time; (ii) MRI allows high-resolution determination of soft tissue, shows no bone and gas artifacts, and is superior to US and CT for the detection of small lesions, especially in the renal collecting system; (iii) MRI scanning can be performed in any direction and plane, thus displaying the total length of needle antenna and its three-dimensional spatial relationship with the lesion. In this experiment, oblique-coronal scanning was used to detect the location of the lesion and the ablation area, as well as the total length of the microwave antenna. (iv) The greatest advantage of MRI-guided renal tumor ablation therapy is that it allows accurate immediate evaluation of a specific MWA procedure, which can help detect the viable tumor tissue more sensitively than CT and US.
During scanning sequence selection, the MR sequence used for interventional therapy should maintain the balance between imaging speed and tissue resolution, which is different from a diagnostic sequence. The VIBE sequence was first reported by Rofsky et al. [Citation10] in 1999 as an imaging sequence for abdomen diagnosis. It is an approximately isotropic spoiled phase gradient echo 3D-T1WI sequence via a combination of K-space interpolation and frequency-selective fat saturation pulse technology. The advantages of this imaging sequence are short acquisition time, low vascular pulse artifacts, and high signal-to-noise ratio. In this study, the time taken for a single 3D-T1WI sequence MRI scan was only 12 s, and the ablation antenna caused moderate artifacts in this sequence. However, due to its poor visualization of the implanted VX2 tumors, this sequence could only be used for monitoring of the needle insertion process and for assessment of postoperative ablation efficacy. When the ablation antenna was inserted into the kidney, the 3D-VIBE-T1WI sequence did not reveal the relationship between the ablation antenna and the lesion. Interestingly, FS-TSE-T2WI multiplane imaging could be used to examine this relationship. The FS-TSE-T2WI sequence significantly shortened the acquisition time by continuously acquiring multiple echoes after a 90° pulse excitation. However, the acquisition time under the original parameters was 150 s, which had not yet achieved the requirements for an interventional operation. For this reason, we modified its relevant parameters to shorten the acquisition time while ensuring the image quality. After optimizing some parameters related to this sequence, the scan time was successfully reduced to 75 s, which greatly reduced the time for puncture guidance.
Some scholars have explored MR-guided techniques for thermal ablation of renal tumors, such as radiofrequency ablation, laser ablation, cryoablation, etc. [Citation11,Citation12], and most of them adopted low-field open MR-guided ablation. This equipment has the advantage of a large operating space, and it uses MR fluoroscopy to achieve real-time guidance of percutaneous puncture. Moreover, the open MRI allows easy contact between the operator and patients during intraoperative scanning. In this study, 1.5T high-field closed MR was used to guide microwave ablation of VX2 tumors in rabbit kidney. In contrast, closed MR did not support operator interaction with the patient during scanning. During an actual operation, only intermittent operation was performed outside the magnet, while imaging was performed inside the magnet [Citation13], leading to increased task difficulty and puncture risk. Nevertheless, the high-field closed MR enhanced image quality and accelerated imaging speed, which could be beneficial for the operator to accurately delineate the tumors, determine the anatomical relationship among various tissues, and evaluate the efficacy after ablation.
In this study, MR scanning was performed immediately after ablation. The ablation zone displayed a “target sign” on the 3D-VIBE-T1WI sequence, where the primary tumor focus area in the ablation zone showed low signal intensity, and the peripheral high-signal area surrounded the primary tumor. In the FS-TSE-T2WI sequence, the signal intensity of the primary tumor was lower than before, and the ablation lesion exhibited low signal intensity to completely cover the lesion. This imaging feature can provide a more intuitive evaluation of the immediate efficacy. In addition, we individually compared the volume of the central low-signal area after MWA on the 3D-VIBE-T1WI sequence, the FS-TSE-T2WI low-signal area before MWA, and the tumor coagulation necrosis area on the tissue specimens. No significant differences were found among these three groups, which indicated that the tumor coagulation necrosis area on tissue specimens corresponds to the low-signal area on the postoperative 3D-VIBE-T1WI sequence and the low-signal area on the preoperative FS-TSE-T2WI sequence. Moreover, the volume of the high-signal area after MWA on the 3D-VIBE-T1WI sequence, the low-signal area covering the lesion on the FS-TSE-T2WI sequence after MWA, and the ablated zone on tissue specimens were compared individually, and there was no statistically significant difference among these three groups, which indicated that the ablated zone on tissue specimens corresponds to the low-signal area covering the lesion on the FS-TSE-T2WI sequence after MWA and the high-signal area after MWA on the 3D-VIBE-T1WI sequence. These results indicate that the high-signal area around the tumor on the 3D-VIBE-T1WI sequence and the low-signal area on the FS-TSE-T2WI sequence after ablation can accurately and intuitively evaluate the immediate efficacy of MR-guided MWA in renal tumors.
Before ablation, two rabbits carrying renal VX2 tumors were randomly assigned for sacrifice and subsequent pathological examination, including assessment of macroscopic and microscopic characteristics, to not only confirm the VX2 tumor but also compare the pathological findings after ablation. On macroscopic assessments, the tumor after ablation no longer appeared white in color but appeared as a yellow-white tumor nodule. Coagulative necrosis was also observed in normal renal parenchyma, which is represented by a gray-yellow coagulation necrosis area around the tumor coagulation necrosis zone. In microscopic assessments, the coagulation necrosis area of the tumor showed a residual cell outline with karyolysis. Notably, the space between the cords of neoplastic cells was obviously dilated. Normal renal parenchyma also showed coagulation necrosis after ablation, including a pink exudate protein and tubular dilatation. These findings confirmed the immediate efficacy of microwave ablation. Under the light microscope, we confirmed the existence of the three pathological zones noted on the macroscopic assessment, which were the tumor coagulation necrosis area followed by the coagulation necrosis area and congestion and edema band, from inside to outside. The consistency between the macroscopic and microscopic findings for pathological division made the comparison between imaging and pathological findings more objective.
Nevertheless, this study has some limitations. In addition to the limited number of samples, there was no normal rabbit kidney representing the control group for MWA treatment. Moreover, during statistical analysis, sampling errors could have easily occurred due to the small sample size. Since the rabbit kidney is smaller than other organs and its renal cortex is thin, the renal capsule near the tumor could be completely ablated, resulting in a poor imaging feature of the ablative margin near the renal capsule. Furthermore, the rabbits were sacrificed immediately after ablation; thus, the study could not accurately estimate the long-term efficacy and survival rate. Likewise, it is impossible to dynamically observe the imaging kinetics and pathological changes in the prognosis of ablated tumors and kidney tissues.
In conclusion, the MRI signal intensity changes in rabbit renal VX2 tumors after MWA exhibit certain characteristics that are strongly correlated with the pathological findings. MRI is an effective method for immediate efficacy evaluation of rabbit renal VX2 tumors after MWA, which can serve as a valuable reference for the clinical assessment of postablative renal tumors.
Research involving animals participants informed consent
This experiment was approved by the animal ethics review committee of Fujian Medical University (the decision number: 2017-0115).
Disclosure statement
The authors report no conflicts of interest. The authors alone are responsible for the content and writing of the article.
References
- Laguna MP, Algaba F, Cadeddu J, et al. Clinical Research Office of the Endourological Society Renal Mass Study. Current patterns of presentation and treatment of renal masses: a clinical research office of the endourological society prospective study. J Endourol. 2014;28(7):861–870.
- Lane BR, Babineau DC, Poggio ED, et al. Factors predicting renal functional outcome after partial nephrectomy. J Urol. 2008;180(6):2363–2368; discussion 2368–2369.
- Davenport MS, Caoili EM, Cohan RH, et al. MRI and CT characteristics of successfully ablated renal masses: imaging surveillance after radiofrequency ablation. AJR Am J Roentgenol. 2009;192(6):1571–1578.
- Floridi C, De Bernardi I, Fontana F, et al. Microwave ablation of renal tumors: state of the art and development trends. Radiol Med. 2014;119(7):533–540.
- Fischbach F, Thormann M, Seidensticker M, et al. Assessment of fast dynamic imaging and the use of Gd-EOB-DTPA for MR-guided liver interventions. J Magn Reson Imaging. 2011;34(4):874–879.
- Kutikov A, Uzzo RG. The RENAL nephrometry score: a comprehensive standardized system for quantitating renal tumor size, location and depth. J Urol. 2009;182(3):844–853.
- Carrafiello G, Laganà D, Mangini M, et al. Microwave tumors ablation: principles, clinical applications and review of preliminary experiences. Int J Surg. 2008;6(Suppl 1):S65–S69.
- Simon CJ, Dupuy DE, Mayo-Smith WW. Microwave ablation: principles and applications. Radiographics 2005;25(Suppl 1):S69–S83.
- Wile GE, Leyendecker JR, Krehbiel KA, et al. CT and MR imaging after imaging-guided thermal ablation of renal neoplasms. Radiographics 2007;27(2):325–339; discussion 339–340.
- Rofsky NM, Lee VS, Laub G, et al. Abdominal MR imaging with a volumetric interpolated breath-hold examination. Radiology. 1999;212(3):876–884.
- Boss A, Clasen S, Kuczyk M, et al. Magnetic resonance-guided percutaneous radiofrequencyablation of renal cell carcinomas: a pilot clinical study. Invest Radiol. 2005;40(9):583–590.
- Kariniemi J, Ojala R, Hellström P, et al. MRI-guided percutaneous laser ablation of small renal cell carcinoma: initial clinical experience. Acta Radiol. 2010;51(4):467–472.
- Silverman SG, Tuncali K, vanSonnenberg E, et al. Tumors: MR imaging-guided percutaneous cryotherapy–initial experience in 23 patients. Radiology. 2005;236(2):716–724.