
 ?Mathematical formulae have been encoded as MathML and are displayed in this HTML version using MathJax in order to improve their display. Uncheck the box to turn MathJax off. This feature requires Javascript. Click on a formula to zoom.
Abstract
Purpose: A control algorithm for radio-frequency-induced intestinal tissue fusion was developed to explore the effects of different control parameters on intestinal tissue fusion.
Materials and methods: Radio-frequency-induced fusion was performed on ex vivo small intestine tissue. The effect on the fusion was observed by changing the control parameters (power, interval time, and terminal impedance) in the algorithm. The quality of fusion was evaluated using the burst pressure and thermal damage measurement. Histological evaluation was used to assess the fusion quality indirectly.
Results: A maximum burst pressure of 8.460 ± 0.2674 KPa was acquired when the power was set to 100 W, the interval time was set to 2000 ms, and the terminal impedance was set to 50 Ω. Moreover, the thermal damage range increased with an increase in power but decreased with an increase in the interval time and terminal impedance. Furthermore, the thermal damage range and temperature were presumably related.
Conclusions: For an ex vivo small intestine tissue, the appropriate control parameters could be set when the power was approximately 100 W, the interval time was approximately 2000 ms, and the terminal impedance was approximately 50 Ω. This study could provide a basis for the selection of control parameters for intestinal tissue fusion.
1. Introduction
In surgical reconstruction of the digestive tract, it is often necessary to remove the pathological tissue and then fuze the healthy tissue to realize normal functioning of the digestive tract. The conventional methods used for this purpose include manual suture and stapler anastomosis. However, both of these are non-continuous tissue fusion methods that may lead to the incidence of bleeding and anastomotic leakage [Citation1]. In recent years, new anastomotic methods have been developed, such as nickel–titanium shape memory alloy compression anastomosis clip (CAC), compression anastomosis ring (CAR) [Citation2,Citation3], and magnetic compression anastomosis [Citation4,Citation5]. However, serious consequences can arise if leakage occurs when a CAC or CAR is still in the body. Thus, these tools have not been widely used in clinical practice.
The development of electrosurgical technology has provided possibilities for tissue fusion. The radio frequency (RF)-induced vessel sealing system (Valleylab LigaSure, Medtronic) [Citation6] is a mature technology in which a high-power RF current and certain pressure are applied to the vessel. Under the vessel sealing mechanism based on the RF energy, the collagen in the vessel forms a new hinge to achieve the effect of vessel sealing [Citation7–12]. Because the small intestine tissue contains a certain amount of collagen [Citation13], some scholars suspect that the tissue can be fused by RF energy [Citation6,Citation14–18]. If this method is successful, it would have significant advantages over the traditional manual suture and stapler anastomosis methods. RF-induced tissue fusion can fuze the tissue directly without any implants. Thus, this method may reduce the risk of complications (such as bleeding and anastomotic leakage) that result from implants [Citation19]. Moreover, the method is suitable for tissue closure and fusion and has a simple operation procedure and low cost.
Some studies that have used RF energy to close or fuze small intestine tissues are summarized in the following text. In 2007, Smulders et al. [Citation16] used a special device known as Ligasure Anastomotic Device (Valleylab LigaSure, Medtronic) to perform lateral–lateral anastomosis of the ileum of four living pigs. Granulation tissue healing with non-inflammatory cell infiltration in the RF fusion joint area was observed 7 days after the operation. New collagen was also found in the sub-mucosa and tissue re-epithelialization was observed at the healing boundary. In 2009, Winter et al. [Citation6] developed an RF device with closed-loop temperature control, which was used to fuze porcine colon tissue. They discussed the effects of the pressing pressure, fusion temperature, and fusion time on the anastomotic burst pressure of pig colon tissue and demonstrated that the burst pressure of the anastomosis was significantly affected by the pressing pressure. In 2011, by using the developed RF device, Winter et al. investigated the correlation between the burst pressure and the pressing pressure [Citation18]. They obtained a maximum burst pressure of 41.0 mmHg for a pig colon and 69.5 mm Hg for a rat isolated colon at a pressing pressure of 1125 and 140 KPa, respectively. In 2014, Zhao et al. [Citation15] studied the effects of the pressing pressure and RF energy on the burst pressure of the anastomosis. Their study revealed that the burst pressure cannot be increased effectively by only increasing the pressing pressure or the RF energy. The fusion temperature increases with the pressing pressure, which is not conducive for controlling the thermal damage to the surrounding tissue.
Limited research has been conducted on improving the effect of RF-induced intestinal tissue fusion by optimizing the control algorithm. This study, which is based on a self-developed RF energy generator, proposes a control algorithm for RF-induced intestinal tissue fusion and explores the effects of different control parameters on intestinal tissue fusion.
2. Materials and methods
2.1. Experimental materials
A porcine small intestine was collected for the experiment. The intestine was taken from a freshly slaughtered pig at a slaughterhouse, stored in a cold preservation box at a temperature of approximately 0–4 °C, and transported to the laboratory within 1–2 h. For preparation, the small intestine was first rinsed with normal saline and cut into 6-cm-long segments. Each segment was randomly divided into nine experimental groups (n = 10 per group). Finally, the specimens were covered with a piece of wet gauze soaked in normal saline.
2.2. Fusion system
The fusion system used for intestinal tissue fusion and its schematic are displayed in , respectively. The RF energy generator comprised a human–machine interface (HMI), master control module, feedback control module, switching power module, and RF power amplifier module. The HMI displayed the changes in the various parameters in the intestinal tissue fusion process. Moreover, the operator could set the control parameters through the HMI. The master control module controlled the output parameters of the RF energy in real time during the fusion process. The feedback control, switching power, and RF power amplifier modules formed a closed loop for providing a precise output of RF energy. The RF energy generator was developed by University of Shanghai for Science and Technology. The fusion electrode was a laparoscopic instrument known as LigaSure (Valleylab LigaSure, Medtronic).
Figure 1. (a) Fusion system comprising a RF generator, fusion electrodes, a thermal camera, and a PC. (b) Schematic of the RF-induced intestinal tissue fusion system.
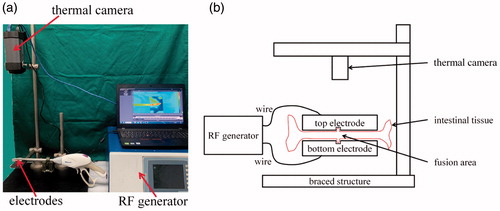
A thermal camera (FLIRA325sc, FLIR Systems) and an analysis software (FLIR ResearchIR Standard, FLIR Systems) installed in a personal computer (PC) comprised the thermal damage measurement system. The tissue was clamped by the fusion electrodes (top and bottom electrodes), and the thermal camera was placed vertical to the electrodes. In the fusion process, the thermal camera recorded the changes in the tissue temperature in real time through video recording.
2.3. Control algorithm
Under the effect of RF energy, the temperature of the tissue increased gradually and the bio-impedance also increased with the loss of water. When the RF energy was applied for a period of time, the bio-impedance was maintained at a certain level [Citation20]. If the RF energy was applied continuously at the moment, then the tissue was charred because of excessive water loss. To reduce the thermal damage to the tissue, the RF energy waveform was supplied in the form of pulses. In the period between every two pulses, a sine wave of very low power was provided for impedance detection. This period is known as the RF output interval time. The tissue bio-impedance was detected at the end of each RF pulse. If the bio-impedance was similar at several times (the difference between the bio-impedance values of two adjacent pulses was within a certain range), the RF output terminal impedance was considered to be attained and the RF output was automatically stopped.
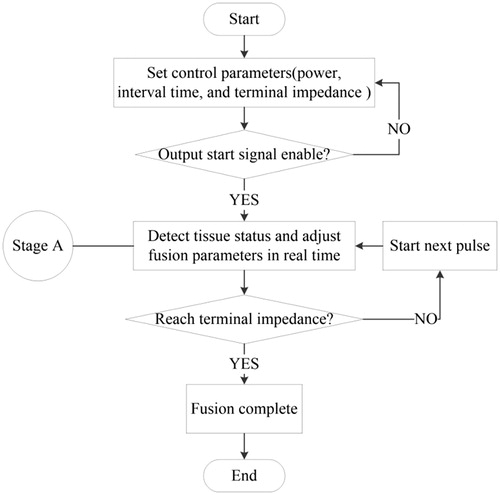
The flowchart of the control algorithm is displayed in . First, a series of control parameters, including the power, interval time, and terminal impedance of the RF energy, were set. When the output start signal was enabled, the device began to output RF energy. The system detected the status of the tissue in real time (stage A) and continuously adjusted the output parameters according to the different statuses of the tissue. The system simultaneously determined whether the status of the tissue reached the RF output terminal impedance. If the RF terminal impedance was attained, fusion was completed and the RF output was automatically stopped; otherwise, the next pulse was initiated.
Figure 2. Flowchart of the control algorithm.
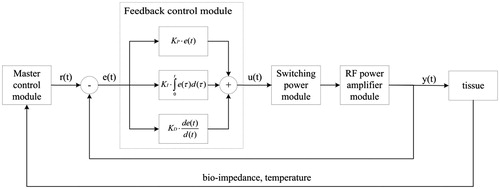
In stage A in , two tasks had to be accomplished. The master control module adjusted the output parameters r(t) according to the different statuses of the tissue (bio-impedance and temperature). The feedback control module detected the output of the RF energy y(t) and adjusted it to be similar to r(t) in real time by using a proportional-integral-derivative (PID) controller, as displayed in . For the PID controller, the relationship between the input e(t) and output u(t) is given as follows:
(1)
(1)
where e(t) = [r(t) − y(t)] is the error signal, KP is the proportional gain, KI is the integral gain, and KD is the derivative gain. The transfer function is given by as follows:
(2)
(2)
where TI = KP/KI is the integral time constant and TD = KD/KP is the derivative time constant.
Figure 3. Schematic of the closed-loop feedback control.
2.4. Burst pressure measurement system
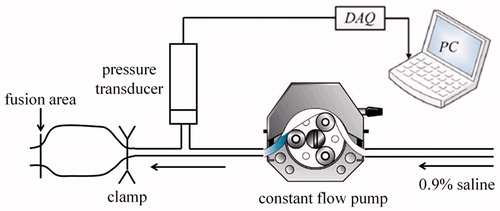
The burst pressure measurement system comprised a T-joint pipe, pressure transducer (MB-HS, Yeli Industrial Control Corporation), constant-flow pump (RSP01-C, Ristron Corporation), data acquisition (DAQ) card (PCI6221, National Instruments Corporation), and PC (). The three ports of the T-joint pipe were connected to the measuring port of the pressure transducer, output port of the constant-flow pump, and injection needle, respectively. The injection needle was inserted into the un-fusion port of the tissue and clamped using hemostatic forceps to ensure that burst occurred at the fusion area of the tissue. The constant-flow pump injected 0.9% saline into the tissue at a constant rate of 2 ml/min [Citation14]. The output voltage signal of the pressure transducer was transmitted to the PC through the DAQ card. The Laboratory Virtual Instrument Engineering Workbench (LabVIEW, NI) was used to display the pressure of the fusion area through a graphical interface in real time.
Figure 4. Schematic of the burst pressure measurement system.
2.5. Experimental process
The effects of the RF output power, interval time, and terminal impedance on tissue fusion are discussed in this subsection. The details of the experimental groups formed and the parameter settings are listed in . The effects of different RF output powers (50, 100, and 150 W) and interval time durations (500, 1000, and 2000 ms) on tissue fusion were studied in groups 1 ∼ 9. The effects of different RF output terminal impedances (25, 50, and 100 Ω) on tissue fusion were studied in groups 5, 10 and 11. It should be noted that some typical groups are listed here, and other relevant data will be showed in the results section.
Table 1. Details of the experimental groups formed and the parameter settings.
During the experiment, the small intestine tissue samples were clamped using the fusion electrodes. After the operator set the initial output parameters on the HMI, the foot switch was switched on and the instrument began to output RF energy. When the output of the instrument stopped automatically, a sample was taken from the fusion electrodes and the burst pressure was measured immediately. The burst pressure measurement tasks for all the experimental samples were completed by the same person. The thermal damage range of all the experimental samples and the highest temperature in the fusion process were then measured using the analysis software supplied with the thermal camera.
2.6. Statistical analysis
In this study, an unpaired sample t test was conducted to analyze the data significantly by using the GraphPad Prism analysis software (Graphpad, California). The burst pressure, thermal damage range, and highest temperature in the fusion process (expressed as mean ± standard deviation) were analyzed to examine whether the data between the groups were significantly different. In the analysis, a p value less than 0.05 was considered to be significant.
2.7. Histological study
Hematoxylin and eosin (H&E) staining was performed for the nine groups of specimens with different control parameters. Typical structures in the section included villi, mucosa, sub-mucosal glands, ring muscles, longitudinal muscles, and serosa. This study focused on the shape of the tissue fusion area to evaluate the influence of different control parameters on tissue fusion.
3. Results
3.1. Effect of different control parameters on the burst pressure
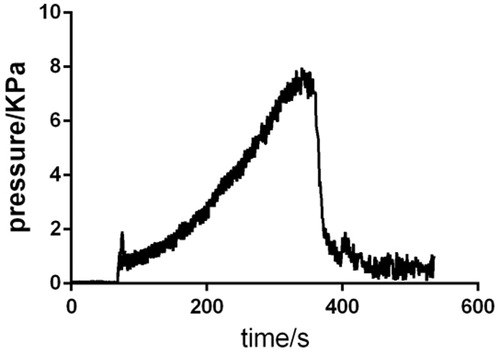
The change in pressure over time during the entire process is displayed in .
Figure 5. Change in pressure over time during the entire process.
3.1.1. Effect of different RF power values on the burst pressure
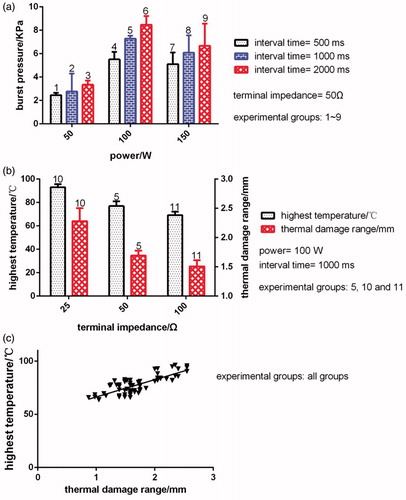
The results for the burst pressure at different RF output power values are illustrated in (experimental groups: 2, 5 and 8). The results reveal that when the RF output power was 50, 100, and 150 W, where interval time is 1000 ms and terminal impedance is 50 Ω, the burst pressure was 2.771 ± 0.5394, 7.288 ± 0.08799, and 6.078 ± 0.5236 KPa, respectively. Significant differences were observed between the burst pressures corresponding to the three different RF output power values (p < 0.05).
3.1.2. Effect of different interval time durations on the burst pressure
The results for the burst pressure at different RF output interval time durations are illustrated in (experimental groups: 4, 5 and 6). The results reveal that when the RF output interval time duration was 500, 1000, and 2000 ms, where power is 100 W and terminal impedance is 50 Ω, the burst pressure was 5.513 ± 0.2280, 7.288 ± 0.08799, and 8.460 ± 0.2674 KPa, respectively. Significant differences were observed between the burst pressures corresponding to the three different RF output interval time durations (p < 0.05).
3.1.3. Effect of different terminal impedance values on the burst pressure
The results for the burst pressure at different RF output terminal impedance values are not showed in . The experimental data indicate that when the RF output terminal impedance was 25, 50, and 100 Ω, where power is 100 W and interval time is 1000 ms, the burst pressure was 5.242 ± 0.1033, 7.288 ± 0.08799, and 5.307 ± 0.1702 KPa, respectively. Significant differences were observed in the burst pressure values between RF output terminal impedances of 25 and 50 Ω and 50 and 100 Ω (p < 0.0001). No significant differences were observed in the burst pressure values for RF output terminal impedances of 25 and 100 Ω (p > 0.05).
3.2. Effect of different control parameters on the thermal damage range
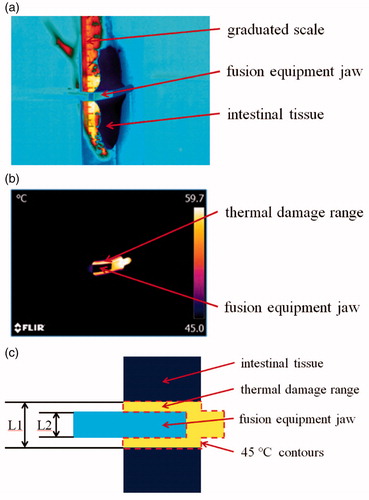
A frame of video taken by thermal camera before tissue fusion is displayed in . The grayscale represents the difference in temperature. The critical temperature above which tangible heat damage can occur to tissue is assumed to be 45 °C () [Citation17,Citation21,Citation22]. Thermal damage range is then calculated by measuring the maximum distance between the 45 °C contours (L1 in ) on the planar projection and then subtracting fusion equipment jaw diameter (L2 in ) to get the total thermal damage range. The average thermal damage range on either side of the fusion equipment jaw is then simply the total thermal damage range divided by 2.
Figure 6. Infrared thermography image. (a) Infrared thermography image before tissue fusion. (b) Infrared thermography image during tissue fusion. (c) Schematic of the infrared thermography image, where L1 is the maximum distance between the 45 °C contours and L2 is the fusion equipment jaw diameter.
3.2.1. Effect of different RF output power values on thermal damage range
The results for the thermal damage range at different RF output power values are not showed in . The experimental data reveal that when the RF output power value was 50, 100, and 150 W, where interval time is 1000 ms and terminal impedance is 50 Ω, the thermal damage range was 1.115 ± 0.08707, 1.625 ± 0.02351, and 1.893 ± 0.1327 mm, respectively. Significant differences were observed in the thermal damage range between the RF output power values of 50 and 100 W and 50 and 150 W (p < 0.0001). No significant differences were observed in the thermal damage range for RF output power values of 100 and 150 W (p > 0.05).
3.2.2. Effect of different interval time durations on the thermal damage range
The results for the thermal damage range at different RF output interval time durations are not showed in . The experimental data reveal that when the RF output interval time duration was 500, 1000, and 2000 ms, where power is 100 W and terminal impedance is 50 Ω, the thermal damage range was 2.203 ± 0.09664, 1.625 ± 0.02351, and 1.400 ± 0.04585 mm, respectively. Significant differences were observed between the thermal damage ranges of the three different RF output interval time durations (p < 0.05).
3.2.3. Effect of different terminal impedance values on the thermal damage range
The results for the thermal damage range at different RF output terminal impedances are displayed in (experimental groups: 5, 10 and 11). The results reveal that when the RF output terminal impedance was 25, 50, and 100 Ω, where power is 100 W and interval time is 1000 ms, the thermal damage range was 2.275 ± 0.09746, 1.625 ± 0.02351, and 1.497 ± 0.04304 mm, respectively. Significant differences were observed between the thermal damage ranges corresponding to the three different RF output terminal impedances (p < 0.05).
3.3. Effect of different control parameters on the highest temperature
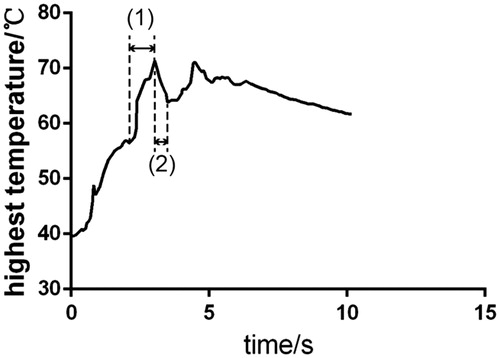
The change in the highest temperature over time during the fusion process is depicted in . Stage (1) and stage (2) of the figure form an RF pulse. Stage (1) represents the RF energy output process, and stage (2) represents the RF energy output interval process. In the experiment, the highest temperature of each sample in the entire fusion process was selected to observe the influence of different RF energies on that temperature.
Figure 7. Change in the highest temperature over time during the fusion process.
3.3.1. Effect of different RF power values on the highest temperature
The results for the highest temperature at different RF output power values are not showed in . The results reveal that when the RF output power value was 50, 100, and 150 W, where interval time is 1000 ms and terminal impedance is 50 Ω, the highest temperature was 66.06 ± 0.7041, 75.86 ± 0.8507, and 80.54 ± 0.9885 °C, respectively. Significant differences were observed between the highest temperatures corresponding to the three RF output powers (p < 0.05).
Figure 8. Effect of different control parameters (power, interval time, and terminal impedance) on intestinal tissue fusion. (a) Results for the burst pressure under different power (50, 100 and 150 W) and interval time (500, 1000 and 2000 ms), where terminal impedance is 50 Ω. (b) Results for the thermal damage range and highest temperature under different terminal impedance, where power is 100 W and interval time is 1000 ms. (c) Relationship between highest temperature and thermal damage range.
3.3.2. Effect of different interval time durations on the highest temperature
The results for the highest temperature at different RF output interval time durations are not showed in . The experimental data reveal that when the RF output interval time duration was 500, 1000, and 2000 ms, where power is 100 W and terminal impedance is 50 Ω, the highest temperature was 82.86 ± 1.543, 75.86 ± 0.8507, and 76.20 ± 2.060 °C, respectively. Significant differences were observed in the highest temperature between RF output interval time durations of 500 and 1000 ms and 500 and 2000 ms (p < 0.0001). No significant differences were observed in the highest temperature for the RF output interval time durations of 1000 and 2000 ms (p > 0.05).
3.3.3. Effect of different terminal impedances on the highest temperature
The results for the highest temperature in the fusion process at different RF output terminal impedances are displayed in (experimental groups: 5, 10 and 11). The results reveal that when the RF output terminal impedance was 25, 50, and 100 Ω, where power is 100 W and interval time is 1000 ms, the highest temperature was 92.95 ± 0.9634, 75.86 ± 0.8507, and 69.24 ± 1.028 °C, respectively. Significant differences were observed between the highest temperatures corresponding to the three RF output terminal impedances (p < 0.05).
Moreover, the relationship between highest temperature and thermal damage range are showed in .
3.4. Histological observation
displays the results for the tissue samples under different experimental conditions when conducting H&E staining. The fusion electrodes (Valleylab LigaSure, Medtronic) comprised top and bottom electrodes, and each electrode had a gap in the middle, as displayed in . The small intestine tissue was clamped between the top and bottom electrodes. During the fusion process, RF energy was applied to the small intestine tissue through the electrodes on the device. The tissue in contact with the electrodes (fusion area) was fused into one layer due to the pressure and RF energy exerted from the device. Moreover, the tissue in the gap of the electrodes expanded due to its viscoelastic properties, as illustrated in .
Figure 9. Comparison between the histological observations. (a–c) Sample slices with RF output powers of 50, 100, and 150 W, where interval time is 1000 ms and terminal impedance is 50 Ω, respectively; (d–f) sample slices with RF output interval time durations of 500, 1000, and 2000 ms, where power is 100 W and terminal impedance is 50 Ω, respectively; and (g–i) sample slices with RF output terminal impedances of 25, 50, and 100 Ω, where power is 100 W and interval time is 1000 ms, respectively.
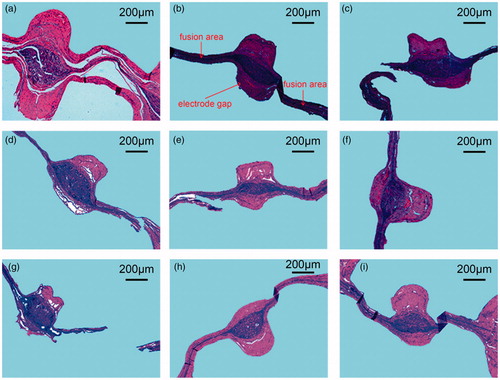
As displayed in , when the RF output power was 50 W, a certain gap existed between the muscle and mucosa layers of the small intestine tissue, which indicates that the tissue did not fuze completely. When the RF output power was increased to 100 W, the muscle and mucosa layers of the small intestine tissue were closely fused into one layer and the fusion area was in good condition. When the power reached 150 W, the structure of the fusion area tore partially. indicates that when the RF output interval was 2000 ms, the microstructure of the fusion area was in the optimal condition. When the interval time was 1000 or 500 ms, the microstructure of the fusion area exhibited a marginal fracture. As illustrated in , for an RF output terminal impedance of 50 Ω, the optimal fusion area was formed and the muscular tissue and mucosa were closely integrated into one layer. When the terminal impedance was 100 Ω, a small spacing was observed between the muscular tissue and the mucosa layer. When the terminal impedance was 25 Ω, the fusion area fractured.
4. Discussion
In digestive tract reconstruction surgery, complications such as anastomotic leakage caused by low-quality tissue anastomosis may lead to death [Citation20]. Conventional methods such as manual suturing and stapler anastomosis are non-continuous tissue fusion methods. In these methods, implants remain in the body, which may lead to anastomotic leakage [Citation1]. Thus, an efficient and safe method for improving the quality of tissue fusion is crucial. The development of electrosurgical technology has provided possibilities for tissue fusion. The RF-induced vessel sealing system (Valleylab LigaSure, Medtronic) [Citation6] is a mature technology in which a high-power RF current and certain pressure are applied to the vessel. Under the vessel sealing mechanism based on RF energy, the collagen in the vessel forms a new hinge to achieve the effect of vessel sealing [Citation7–12]. The small intestine tissue contains a certain amount of collagen [Citation13], which makes it possible to fuze the digestive tract tissue through RF energy. The factors that affect the tissue burst pressure, such as the compression pressure, fusion temperature, and fusion time, have been studied previously [Citation6,Citation15–18]. However, studies are lacking regarding the optimization of the control algorithm based on RF energy to improve the tissue fusion effect. This study is based on a self-developed RF energy generation platform and explores the effects of the RF output power, interval time, and terminal impedances on the tissue fusion effects in the control algorithm based on RF energy, which provides a basis for the selection of control parameters in intestinal tissue fusion.
The effects of different RF output powers on the burst pressure, thermal damage range, and highest temperature during the fusion process are illustrated in (the same interval time under different power). When the power was 100 W, the maximum burst pressure was 8.460 ± 0.2674 KPa. In the study of Winter et al., the maximum burst pressure measured after fusion in an isolated pig colon was only 41.0 mmHg (approximately 5.467 KPa). In the study of Zhao et al., the maximum burst pressure measured after fusion in an isolated pig colon was only 18.2 mmHg (approximately 2.427 KPa). Higher burst pressures were achieved in the present study. The results presented in reveal that if the RF output power is very large or small, the burst pressure of the fusion joint of the tissue decreases, which affects the fusion strength of the tissue. If the RF output power is very small, the power may be insufficient to completely fuze the tissue, thus resulting in a weak joint. As depicted in , space exists between the muscle layer and mucosa layer. Thus, a small external pressure can break the fusion joint. As presented in 3.2.1 and 3.3.1 of the results section, with an increase in power, the thermal damage range and highest temperature of the area increase. Excessive power may cause the temperature of the tissue to be very high in stage (1), as displayed in (during the application of RF energy). Moreover, due to excessive water loss, the thermal damage to the fusion joint can be highly serious. As illustrated in , the tissue of the fusion area will break. In this case, the fusion joint becomes weak and the burst pressure is relatively small. Therefore, to obtain a suitable tissue strength and thermal damage range, the RF output power should be sufficiently large for ensuring that the muscle and mucosa layers are integrated tightly. Simultaneously, when considering the thermal damage of the tissue, the power should not be very high.
The effects of different RF output interval time durations on the burst pressure, thermal damage range, and highest temperature during the fusion process are depicted in (the same power under different interval time), respectively. The figure reveals that the longer the interval time, the higher is the burst pressure of the tissue fusion joint, the smaller is the thermal damage range (3.2.2 of the results section), and the smaller is the highest temperature in the area (3.3.2 of the results section). The RF energy waveform is in the form of a pulse. At the end of each pulse interval (stage (2) in ), the tissue fusion water reflows, thereby reducing the thermal damage of the tissue. The longer the interval time, the more likely is the water to reflow in the fusion joint of the tissue. Thus, the highest temperature in stage (2) () may decrease further, which may reduce the degree of thermal damage. indicates that the longer the interval time, the more complete in form is the tissue of the fusion area and the more closely integrated are the muscle and mucosa layers. However, a long interval time may cause the overall fusion time to be very long, which is inconvenient for a doctor during an operation. Therefore, the interval time must be controlled to a value as low as possible while simultaneously ensuring a sufficiently large burst pressure and low thermal damage.
The effects of different RF output terminal impedance values on the burst pressure, thermal damage range, and highest temperature during the fusion process are illustrated in . The effect of the RF output terminal impedance on the burst pressure of tissue fusion is similar to that of the RF output power. 3.1.3 of the results section indicates that excessively high or low terminal impedance can result in a small burst pressure in tissue fusion. When the RF output terminal impedance was 50 Ω, the highest burst pressure was 7.288 ± 0.08799 KPa. 3.2.3 and 3.3.3 of the results section indicate that the smaller the impedance value set by the terminal impedance, the larger is the tissue thermal damage range and highest temperature of the fusion area. When the impedance value set by the terminal impedance is very small, additional pulses may need to be applied to complete tissue fusion. Thus, the thermal damage to the tissue may be relatively serious and the tissue of the fusion area may tear, as depicted in . When the impedance value set by the terminal impedance is very large, the number of applied pulses may be small, which may be insufficient to complete tissue fusion. indicates that the fusion joint has a marginal gap. Therefore, a more appropriate parameter that is not very large or very small must be selected. Furthermore, indicate that the thermal damage range and temperature were presumably related.
Moreover, the limits of the ex vivo study compared to in vivo results should be concerned. Specifically, the ex vivo study burst pressure measurement immediately after tissue fusion may be different than burst pressure measurements after the fused tissue has been placed back in a hydrated environment for a period of time (like in a closed wound after surgery) prior to testing the burst pressure. Also, the ex vivo study does not take healing effects into account, so optimal results in this setting may not be the same as the in vivo setting where the long-term healing response is important. Actually, this paper is a preliminary study to find the suitable control parameters in the algorithm by ex vivo experiments. And the improved control algorithm and in vivo study will be proposed in the future study.
5. Conclusions
This study investigated the effects of different control parameters (power, interval time, and terminal impedance) on RF-induced intestinal tissue fusion. The results indicate that when the RF output power was 100 W, interval time was 2000 ms, and terminal impedance was 50 Ω, the fusion tissue had the highest burst pressure. The thermal damage range of the tissue increased with an increase in the output power, decreased with an increase in the interval time, and decreased with an increase in the terminal impedance. During the fusion process, the highest temperature increased with an increase in the output power, decreased with an increase in the interval time, and decreased with an increase in the terminal impedance. The RF output power and terminal impedance setting should be moderate to ensure minimum thermal damage to the tissue under a high burst pressure. Simultaneously, the interval time should be sufficiently long to minimize the extent of thermal damage to the tissue. Moreover, the overall fusion time should be considered. This study investigated the effects of different control parameters on RF-induced intestinal tissue fusion. An improved control algorithm and in vivo study will be proposed in the future study because we are expecting to obtain more accurate fusion parameters for achieving a high burst pressure and low thermal damage.
Disclosure statement
No potential conflict of interest was reported by the authors.
Additional information
Funding
References
- Breitenstein S, Rickenbacher A, Berdajs D, et al. Systematic evaluation of surgical strategies for acute malignant left-sided colonic obstruction. Br J Surg. 2007;94(12):1451–1460.
- Zbar AP, Nir Y, Weizman A, et al. Compression anastomoses in colorectal surgery: a review. Tech Coloproctol. 2012;16(3):187–199.
- François C, Catherine S, Marc B, et al. Shape memory alloy clip for compression colonic anastomosis. J Biomech Eng. 2005;127(2):351–354.
- Ko P, Eb J, S H, et al. Magnamosis II: Magnetic compression anastomosis for minimally invasive gastrojejunostomy and jejunojejunostomy. J Am Coll Surg. 2011;212(1):42–49.
- Jamshidi R, Stephenson JT, Clay JG, et al. Magnamosis: magnetic compression anastomosis with comparison to suture and staple techniques. J Pediatr Surg. 2009;44(1):222–228.
- Winter H, Holmer C, Buhr HJ, et al. Pilot study of bipolar radiofrequency-induced anastomotic thermofusion–exploration of therapy parameters ex vivo. Int J Colorectal Dis. 2010;25(1):129–133.
- Zelickson BD, Kist D, Bernstein E, Brown DB, et al. Histological and ultrastructural evaluation of the effects of a radiofrequency-based nonablative dermal remodeling device: a pilot study. Arch Dermatol. 2004;140(2):204–209.
- Wells PB, Thomsen S, Jones MA, et al. Histological evidence for the role of mechanical stress in modulating thermal denaturation of collagen. Biomech Model Mechanobiol. 2005;4(4):201.
- Massarweh NN, Cosgriff N, Slakey DP. Electrosurgery: history, principles, and current and future uses. J Am Coll Surg. 2006;202(3):520–530.
- Heniford BT, Matthews BD, Sing RF, et al. Initial results with an electrothermal bipolar vessel sealer. Surg Endosc. 2001;15(8):799–801.
- Floume T. Optical monitiring of radiofrequency tissue fusion [D]. London: Imperial college; 2009.
- Entezari K, Hoffmann P, Goris M, et al. A review of currently available vessel sealing systems. Minim Invasive Therapy Allied Technol. 2007;16(1):52–57.
- Stumpf M, Klinge U, Wilms A, et al. Changes of the extracellular matrix as a risk factor for anastomotic leakage after large bowel surgery. Surgery. 2005;137(2):229.
- Zhao L, Zhou Y, Song C, et al. Predicting burst pressure of radiofrequency-induced colorectal anastomosis by bio-impedance measurement. Physiol Meas. 2017;38(3):489–500.
- Zhao L, Song C, Wang Z, et al. Novel concave–convex electrode for colonic anastomoses by radiofrequency thermo-fusion. Surg Endosc. 2014;29(7):1–8.
- Smulders JF, Hingh I, Stavast J, Jackimowicz JJ. Exploring new technologies to facilitate laparoscopic surgery: creating intestinal anastomoses without sutures or staples, using a radio-frequency-energy-driven bipolar fusion device. Surg Endosc. 2007;21(11):2105–2109.
- Lim CB, Goldin RD, Elson DS, et al. In vivo thermography during small bowel fusion using radiofrequency energy. Surg Endosc. 2010;24(10):2465–2474.
- Holmer C, Winter H, Kröger M, et al. Bipolar radiofrequency-induced thermofusion of intestinal anastomoses–feasibility of a new anastomosis technique in porcine and rat colon. Langenbecks Arch Surg. 2011;396(4):529–533.
- Lim CBB, Goldin RD, Darzi A, et al. Characterization of materials eliciting foreign body reaction in stapled human gastrointestinal anastomoses. Br J Surg. 2008;95(8):1044–1050.
- Wen-Chin KMD, Shoei K, Jiunn-Lee LMD, et al. New method for predicting efficiency of heating by measuring bioimpedance during radiofrequency catheter ablation in humans. J Cardiovasc Electrophysiol. 2010;12(7):819–823.
- Kröger M, Jaenicke A, Winter H, et al. Reduction of thermal tissue damage caused by bipolar radiofrequency-induced thermofusion. Biomed Eng. 2012;57(SI-1 Track-H):432.
- Campbell PA, Cresswell AB, Frank TG, et al. Real-time thermography during energized vessel sealing and dissection. Surg Endosc. 2003;17(10):1640–1645.