
 ?Mathematical formulae have been encoded as MathML and are displayed in this HTML version using MathJax in order to improve their display. Uncheck the box to turn MathJax off. This feature requires Javascript. Click on a formula to zoom.
Abstract
Purpose
In cardiac radiofrequency (RF) ablation, RF energy is often used to create a series of transmural lesions for blocking accessory conduction pathways. Electrode–tissue contact force (CF) is one of the key determinants of lesion formation during RF ablation. Low electrode–tissue CF is associated with ineffective RF lesion formation, whereas excessive CF may increase the risk of steam pop and perforation. By using finite element analysis, we studied lesion size and features at different values of electrode–tissue CF in cardiac RF ablation.
Materials and methods
A computer-model-coupled electrode–tissue CF field, RF electric field, and thermal field were developed to study temperature distribution and lesion dimensions in cardiac tissue subjected to CF of 2, 5, 10, 20, 30, and 40 g with identical RF voltage and duration.
Results
Increasing CF was associated with an increase in lesion depth, width, and cross-section area. The lesion cross-section area exhibited a linear increase, and the lesion width was significantly greater than lesion depth under the identical ablation condition. The relationship between CF value and lesion size is a power function: Lesion Size = a × CFb (Lesion Depth = 3.17 × CF0.14 and Lesion Width = 5.17 × CF0.14).
Conclusions
This study confirmed that CF is a major determinant of RF lesion size and that electrode–tissue CF affects the amount of power dissipated in tissue. At a constant RF voltage and application time, RF lesion size increases as CF increases.
Introduction
Background
Radiofrequency (RF) catheter ablation is a minimally invasive therapy that is widely used for the treatment of various types of cardiac arrhythmias. Compared with traditional antiarrhythmic drug therapy or the surgical maze procedure, cardiac RF ablation has the advantages of a clear curative effect and little injury [Citation1]. In particular, in atrial fibrillation (AF) RF ablation, circumferential pulmonary vein isolation and linear ablation in the left atrial roof have been demonstrated to be highly effective and reliable interventions against drug-resistant refractory AF [Citation2,Citation3]. The RF ablation technique converts electromagnetic energy into thermal energy that is delivered into the tissue, destroying the tissue by heating it through a process called resistive heating [Citation4]. In the ablation procedure, numerous factors influence thermal lesion formation and size, including RF power, tissue temperature, impedance changes, duration of energy delivery, electrode diameter, cooling saline irrigation and electrode–tissue contact force (CF) [Citation5]. Among these factors, CF value is one key determinant of lesion formation and size. Appropriate electrode–tissue contact facilitates efficient heat energy transfer to target tissue, which is critical to achieve transmural lesion and the success of RF ablation procedures. By contrast, poor CF is unable to produce effective transmural lesion, and excessive CF is associated with excessive deep-tissue heating and an increased risk of deep-steam pop, perforation, and injury outside of the heart, such as esophageal, pulmonary, and phrenic nerve injury. Recently, commercial CF–sensing catheters (SmartTouch, Biosense Webster, USA and TactiCath, St Jude, USA) have been clinically investigated for treating AF [Citation6,Citation7]. The ability to measure and display CF came with the promise of dramatic improvements in safety and efficacy.
Previous experiments based on animal models have proven that electrode–tissue CF affects the lesion size of cardiac tissue. Kuck et al. [Citation8] conducted a multicenter study, namely the Toccata multicenter clinical research project, to evaluate the safety and efficacy of a novel force-sensing catheter. They came to the conclusion that a force-sensing catheter may increase the effectiveness of RF ablations by allowing better control of the RF lesion size.
With the accumulation of clinical trials, most experts advise that controlled CF between 10 and 40 g is safer and more effective than a high CF value (CF > 40 g) in AF RF ablation [Citation9]. Researchers have typically considered CF > 40 g to be a high CF value in AF ablation. The incidence of steam pop and injury outside of the heart increases with both increased CF and higher power. Increasing the RF power of insufficient CF values to achieve effective myocardial thermal lesion, while reducing RF power under the condition of a high CF, prevents complications such as atrial–esophageal fistula. In addition, Shah et al. [Citation10] suggested that it may be prudent to avoid a CF exceeding 100 g during catheter ablation to avoid cardiac tamponade.
The aforementioned clinical research has revealed that the acute ablation success rate and complications of AF are associated with CF value. These clinical studies qualitatively studied the relationship between the magnitude of CF and the ablation effect. However, the quantitative relationship between CF and lesion size of the myocardial thermal injury is unclear. Pathological analysis is the most effective method to assess the necrotic boundary of myocardial cells. However, in human clinical ablation procedures, conducting a pathological analysis to evaluate the size of thermal injury is impossible and assessing the quantitative relationship between lesion size and CF value is difficult. Therefore, the present study investigated the relationship between CF and lesion size (i.e, lesion cross-section area, width, and depth) in cardiac RF ablation by coupling the mechanical model and electro-thermal model in RF ablation by using finite element analysis.
Materials and methods
The present study investigated the effect of electrode–tissue CF on the thermal lesion size of myocardium in cardiac RF ablation by computer simulation. During the ablation procedure, the electrode tip of the catheter applies a CF to the cardiac tissue, resulting in its deformation. There are several different approaches for solving this mechanics problem and simulating myocardial material properties, including modeling the myocardium as line elastic material, viscoelastic material, or hyperelastic material [Citation11]. Compared with the linear elastic material model, the mechanical deformation of myocardium calculated by the hyperelastic material model was more accurate when the stretch ratio of myocardium was greater than 1.05 [Citation12]. Relevant research has shown that the myocardial deformation error calculated by the hyperelastic material model is less than 3% compared with the experimental result [Citation12]. Therefore, in our paper, we used the hyperelastic material model to simulate the mechanical behavior of myocardium because the stress–strain curve of the myocardium could be well fitted by this material model.
In the computational model of biological tissue RF ablation, it is difficult to couple the mechanical model and electro-thermal model directly. Therefore, we coupled the mechanical model and the electro-thermal model in two steps. First, we calculated the depth of electrode insertion and the deformation of the myocardium under different CF values by using the mechanical model. We then constructed the electro-thermal model according to these geometric deformations caused by CF. Finally, the temperature distribution of the myocardium was calculated under different CF values. To highlight the relationship between electrode–tissue CF and lesion size of ablation, the RF voltage and ablation duration in the simulation are fixed at 50 V and 30 s, respectively.
Solid mechanics model and hyperelastic material model
The active electrodes and plastic probe were assumed to be linear elastic, isotropic and homogeneous. The myocardium was assumed to be hyperelastic, isotropic, nearly incompressible, and homogeneous. The governing equations for the structure models are (summation convention) are as follows [Citation13]:
(1)
(1)
where
is the stress tensor,
is the strain tensor,
is displacement tensor, and
is material density. EquationEquation (1)
(1)
(1) is used for myocardium muscle, with parameter values in the constitutive equations adjusted according to the material.
It is generally accepted that the properties of myocardium can be described using the Mooney–Rivlin model. The parameters we selected were based on the myocardial stretch test. The parameters of the Mooney–Rivlin model determine the characteristics of the stress–strain curve of the myocardium, which reflects the deformation processes of the material under force. In our model, the parameter of the hyperelastic material agrees well with the experimental data of the stretch test [Citation14]. The strain energy function for the isotropic modified Mooney–Rivlin model is given by [Citation15]:
(2)
(2)
where
and
are the first and second strain invariants, respectively;
is the right Cauchy–Green deformation tensor;
is the current position;
is the original position;
and
are the material parameters selected to match experimental measurements.
Bio-heat equation
The physical phenomenon for the electro–thermal coupling problem is governed by Penne’s bio–heat transfer equation [Citation16]:
(3)
(3)
where
and
are the temperature, density, specific heat, thermal conductivity, and power density, respectively, and
and
represent blood perfusion and metabolic heat, respectively. The metabolic heat production per volume term is ignored in our study because it is far smaller than that for the other variables [Citation17]. The heat loss caused by blood perfusion was also negligible because there are no large blood vessels in the myocardial tissue, as noted by Yan et al. [Citation18]. The power loss produced by blood flow is modeled by means of forced thermal convection coefficients in the electrodes–blood interface and endocardium–blood interface.
At an RF frequency of 500 kHz, the mechanism of RF current induces myocardium injury is Joule heating and this electrical problem can be set in quasi-static form [Citation19]:
(4)
(4)
where
is electrical myocardium conductivity and
is electric potential. In this study, we used the quasi-static electrical equation to resolve the electro–thermal coupling problem. In this quasi–static approach, the direct–current voltage corresponding with the root mean squared value of the RF voltage is applied to the catheter electrode and a zero voltage is applied to the border.
Construction of the computer model
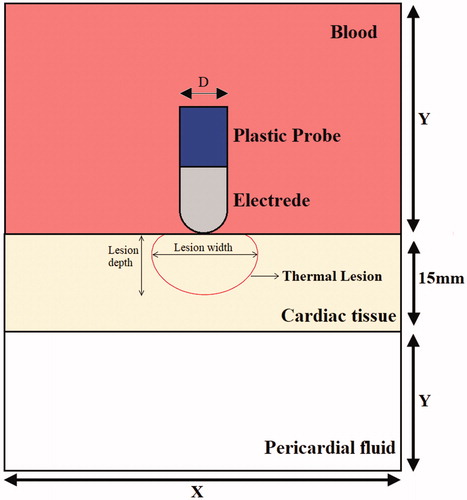
We developed a two–dimensional solid mechanics model and electro–thermal coupled model and used them to represent electrode–tissue CF ablation by applying special boundary conditions. First, the relationship between electrode–tissue CF parameters and cardiac tissue deformation was evaluated using the solid mechanics model. Next, the electro–thermal coupled model was constructed on the basis of the geometry of cardiac tissue deformation to evaluate cardiac tissue thermal lesions. depicts the computational model for cardiac RF ablation (not to scale), which consists of a fragment of cardiac tissue, pericardial fluid, and blood. Blood surrounds active electrode, which is placed perpendicular to the endocardium, as shown in . The cardiac tissue thickness was 15 mm. The electrode diameter (D) was 2.31 mm, and the electrode length (L) was 3 mm. The dispersive electrode was modeled as an electrical boundary condition at a distance from the active electrode. Model dimensions X and Y in the electro-thermal coupled model were calculated using convergence analysis to avoid boundary effects. Additionally, adequate spatial and temporal resolution was estimated using similar convergence tests. The difference of maximal temperature in cardiac tissue less than 0.5% between consecutive simulations was used as the control parameter in the convergence tests [Citation20]. The values determined were as follows: X = 260 mm, Y = 130 mm, and time step = 0.02 s. In this study, we used COMSOL Multiphysics 5.3a to build a finite element model and find a solution.
Figure 1. The geometry of computational model (not to scale).
Material characteristics
The characteristics of the hyperelastic material of cardiac tissue considered in a solid mechanics model were selected to match experimental measurements. The Mooney–Rivlin model, as shown in EquationEquation (2)(2)
(2) , was used to describe the properties of the hyperelastic material with parameter values
= 0.351 kPa,
= 0,
= 0.0633 kPa, and
= 5.3. The stress–strain curves exhibited strong agreement with the stress–strain curves from the dog model given in [Citation14]. The platinum electrode was considered a linear elastic material with Young’s modulus of elasticity (168 GPa) and Poisson’s ratio (0.38).
lists the characteristics of the materials considered in the electro–thermal coupled model (EquationEquations (3)(3)
(3) and (Equation4
(4)
(4) ) [Citation21]. The electrical and thermal conductivity of the myocardium was modeled using the temperature-dependent piecewise function [Citation22]. As the temperature increased up to 100 °C, the electrical conductivity first increased exponentially (1.5%/°C) and then decreased by a factor of 10,000 between 100 °C and 105 °C, whereas the thermal conductivity increased linearly by 1.2%/°C up to 100 °C, following which it remained constant at temperatures exceeding 110 °C.
Table 1. Thermal and electrical characteristics of the elements of the numerical models.
Boundary conditions for the solid mechanics model
illustrates the mechanics boundary conditions of the catheter CF. The force load (CF) was applied to an active electrode. The fixed constraint on displacement was applied to the border of cardiac tissue. The prescribed x–direction displacement was applied to the active electrode and plastic probe. The initial values of the displacement field and structural velocity field were set to zero for the entire model.
Figure 2. Mechanical, electrical and thermal boundary conditions.
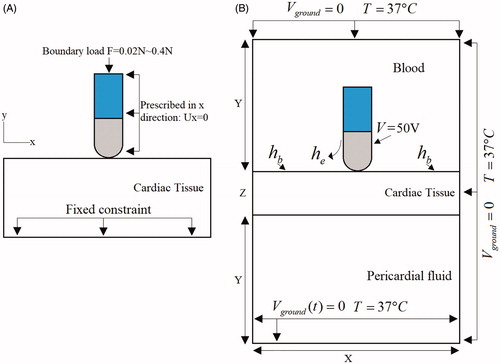
Boundary conditions for the electrical and thermal model
illustrates the electrical boundary conditions of RF ablation modes. A constant zero voltage at the border (mimicking the electrical performance of the dispersive electrode) and a direct–current voltage was applied to active electrodes during the whole ablation time. The thermal boundary condition was a constant temperature of T = 37 °C at the border of all models. The cooling effect produced by blood flow inside the atrium was modeled using two forced thermal convection coefficients—708 and 3636 W/m2K—for the endocardium–blood () and electrode–blood (
) interfaces, respectively [Citation21].
Assessment of thermal injury
Although tissue injury is the result of several complex mechanisms, thermal lesions formed in the cardiac wall can be reasonably assessed using the Arrhenius damage model [Citation23], which associates temperature with exposure time using a first–order kinetics relationship:
(5)
(5)
where
is the degree of tissue injury,
is the total ablation time (s),
is the present concentration of living cells,
is the initial concentration of living cells,
is the universal gas constant,
is the frequency factor (s−1), and
is the activation energy for the irreversible damage reaction (J/mol). For cardiac tissue,
and
were taken from the literature [Citation24]. The tissue damage integral is associated with the percentage volume of cells surviving uniform exposure to a given temperature for a certain amount of time. For instance, the value of
was employed as the critical threshold to represent tissue death, which corresponds to a viable cell concentration of 37%, meaning that there is a 63% probability of cell death.
Results
Myocardial deformation results from the force of electrode–tissue contact
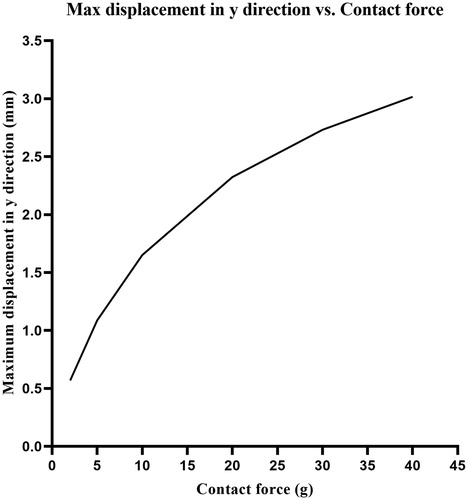
presents the deformation of cardiac tissue and the displacement field distributions corresponding to the boundary conditions of mechanics in . Six sets of CF values were tested through mechanical simulation. The CF was perpendicularly loaded on cardiac tissue of 2, 5, 10, 20, 30, and 40 g, respectively. According to the simulation results, the relationship between the maximum displacement of the electrode and CF is as shown in . We found that the displacement of the electrode in the y direction changed logarithmically with the CF of the electrode. From the results of mechanical simulation, we discovered that the electrode–tissue contact area increased as the CF increased. The adequate electrode–tissue contact area enabled more RF energy to be delivered to the myocardium, thereby increasing the efficiency of the thermal lesion of cardiac RF ablation. Inversely, an insufficient electrode–tissue contact area at low CF caused most of the RF energy to be released into the blood, which led to insufficient ablation of the myocardium.
Figure 3. The deformation of cardiac tissue and the displacement field distributions. (A) F = 2 g, (B) F = 5 g, (C) F = 10 g, (D) F = 20 g, (E) F = 30 g, (F) F = 40 g.
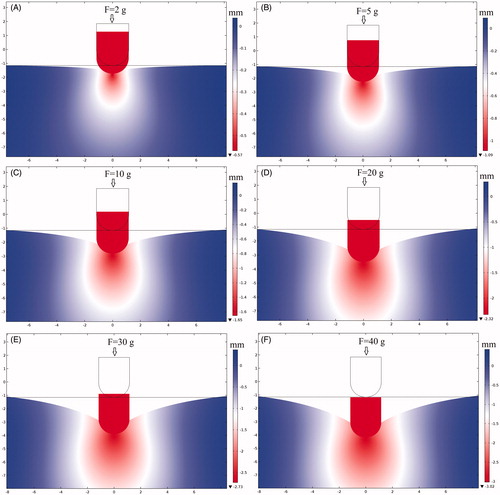
Figure 4. Maximum displacement in y direction vs. contact force.
Electric field intensity, current density and power density distribution
During ablation, the RF power absorbed by tissue is directly converted into heat and is proportional to power density [Citation25]. In this study, we investigated the electric field intensity distribution, current density distribution, and power density distribution in cases of CF = 2 g and CF = 40 g. During cardiac RF ablation, the electrical conductivity of the myocardium changes with temperature, causing the electric field to change in different ablation moments. Therefore, the simulation of the characteristics of the electric field at the same moment was considered. To better observe electric field characteristics, we used a contour line (5 V/mm) to outline electric field intensity distribution, a contour line (5 mA/mm2) to outline current density distribution, and a contour line (25 mW/mm³) to outline power density distribution.
present the electric field intensity distribution at electrode–tissue CF of 2 g and 40 g. The electric field intensity is equal to the voltage potential gradient It can be seen from the simulation results that the electric field intensity inside the metal electrode was zero because of the uniform electrical conductivity of the electrode and the equipotential of the entire electrode. The electric field characteristics of the metal electrode indicated that the metal electrode itself did not generate heat during cardiac RF ablation. Numerical results also indicated that the maximal electric field intensity points occurred at some junctions of the metal electrode and the insulating catheter because of a sudden shift in electrical properties at the boundary.
Figure 5. The distribution of electric field intensity, current density, and power density.
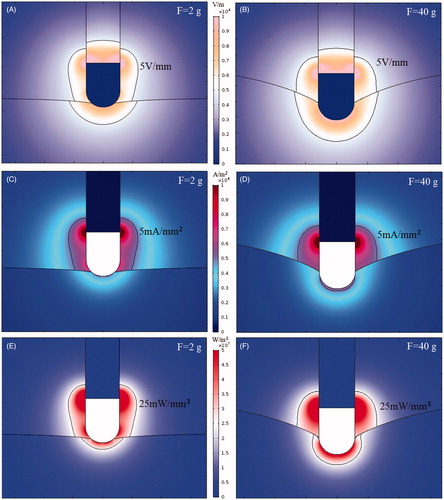
present the distribution of current density. Because the conductivity of the plastic probe was 10−5 s/m, the current density inside the plastic probe was zero. Because the conductivity of the blood (0.99 s/m) was 1.83-times that of the myocardium (0.54 s/m), the current density in the blood was significantly greater than the current density in the myocardium.
present the distribution of power density. Power density is equal to the product of the electric field intensity and the current density (). As can be seen from the bio-heat transfer equation formula (EquationEquation (3)
(3)
(3) ), a region with a higher power density produces a larger power dissipated in the tissue. From the simulation results, we observed that adequate electrode–tissue CF (40 g) enlarged the contact area of the electrode and the myocardium, resulting in a larger distribution of power density in the myocardium.
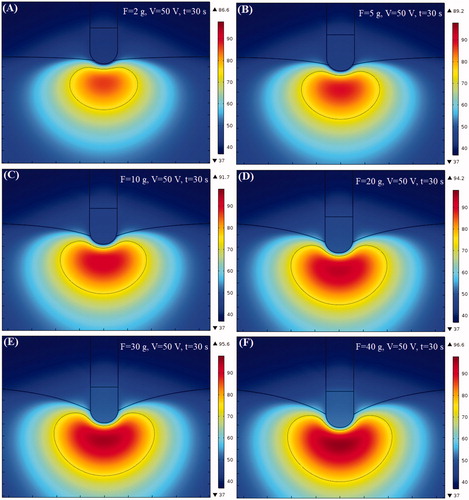
Temperature distribution of myocardium and lesion shape
We studied the effect of CF on thermal lesion size in cardiac ablation. The thermal injury was approximated using the thermal damage borderline: which outlines the width and depth of the lesion. shows the temperature distributions and shapes of the lesions in cardiac tissue at different CF values corresponding to the boundary conditions in . In the simulation, the amplitude of RF voltage was set at 50 V and the ablation time was set at 30 s. From the results, we discovered that the shape of the thermal lesion was symmetrical and that the shape of the lower half of the lesion resembled an ellipse.
Figure 6. Temperature distribution at different CF. (A) F = 2 g, V = 50 V, t = 30 s, (B) F = 5 g, V = 50 V, t = 30 s, (C) F = 10 g, V = 50 V, t = 30 s, (D) F = 20 g, V = 50 V, t = 30 s, (E) F = 30 g, V = 50 V, t = 30 s, (F) F = 40 g, V = 50 V, t = 30 s.
Changes in maximum temperature, impedance, RF power, and lesion size of the myocardium
shows the curve of the maximum temperature point of the myocardium over time at different CF values. We found that the maximum temperature of the myocardium increased quickly during the initial stage of ablation. Subsequently, this increase became less substantial because of the increase in impedance of the myocardium when the ablation time increased. We also found that the maximum temperature of the myocardium produced by ablation at CF = 40 g was 10 °C higher than when ablation occurred at CF = 2 g.
Figure 7. (A) Max temperature of myocardium, (B) lesion area vs ablation time, (C) Myocardial impedance vs ablation time, (D) power vs ablation time.
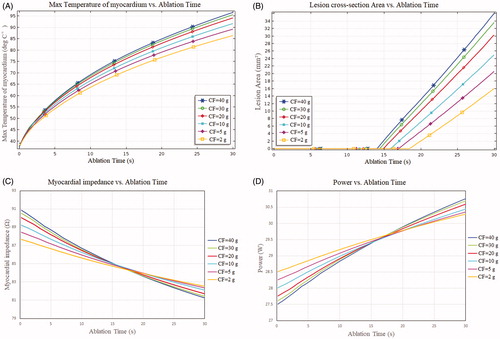
shows the relationship of thermal lesion cross-section area with ablation time at six sets of CF values. We found that the thermal lesion cross section area demonstrated a linear increase and that the rate of increase rose with the increase in CF. As indicated in , the greater the CF, the larger the lesion cross section area after RF ablation. The results indicated that a high CF value was more likely to create a larger lesion cross-section area than was a low CF value (20.62 and 36.04 mm2 for 5 and 40 g CF, respectively, which implied an increase of 74% between 5 g and 40 g). Notably, the lesion cross-section areas were almost identical (33.65 mm2 and 36.04 mm2 for CF = 30 g and CF = 40 g, respectively). These minor differences in lesion cross section area (less than 10%) were due to the minor changes of insert depths of the electrode at CF = 30 g and CF = 40 g.
present the changes in myocardial impedance and power during ablation at different CF values. The results reveal that the impedance decreased and the power increased during heating because of the increase in electrical conductivity of the myocardium with temperature. We observed that the initial impedance of the myocardium increased as the CF value increased. Likewise, we found that the greater the CF, the more the myocardial impedance decreased during ablation (e.g., impedance drop of 9.61 Ω at CF = 40 g vs. impedance drop of 5.13 Ω at CF = 2 g).
present the curves of lesion depth vs. ablation time and lesion width vs. ablation time, respectively, at different CF values. We observed that the lesion depth and lesion width increased faster in the early stages of thermal lesion formation. The rates of increase in lesion depth and lesion width decreased in the middle stages of thermal lesion formation. Increase in CF was associated with increases in lesion depth and lesion width. Lesion depth and width were greater for RF applications with a high CF (40 g) than for those with a low CF (2 g) and were 5.52 mm vs. 3.56 mm and 8.68 mm vs. 5.69 mm, respectively. Another finding was that lesion width was significantly greater than lesion depth in all ablation modes. presents the maximum myocardial temperature, impedance change, lesion cross-section area, lesion depth, and lesion width at different CF values.
Figure 8. (A) Lesion depth vs ablation time, (B) lesion width vs ablation time, (C) max lesion depth vs contact force, (D) max lesion width vs contact force.
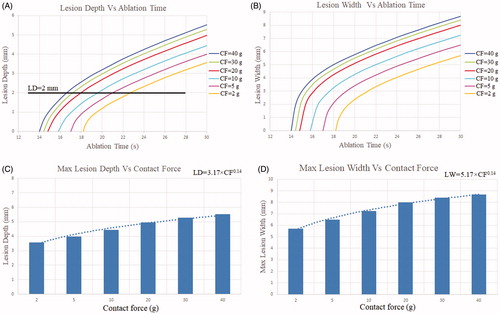
Table 2. Maximum myocardial temperature, impedance change, lesion cross-section area, lesion depth, and lesion width at different CF values.
Discussion
The main objective of this study was to simulate lesion size and features at different electrode–tissue CF values in cardiac RF ablation.
During cardiac RF ablation, electrode–tissue CF is one of the primary determinants of lesion size. The simulation results indicated that at a constant RF voltage and application time, RF lesion size increased with increasing CF. Comparing the ablation conditions of low CF (2 g) and high CF (40 g) revealed that the lesion depth increased by 55%, lesion width increased by 52.5%, and lesion cross section area increased by 124%. From these simulation results, it is clear that the lesion size generated at a high CF (40 g) was significantly greater than the lesion size generated at a low CF (2 g). Moreover, the contact cross section area (1.96 mm2) between the electrode and myocardium of a high CF (40 g) was significantly greater than the contact cross section area (0.26 mm2) of a low CF (2 g), which resulted in more RF power being dissipated in the tissue. When the CF value was 2 g, most of the area of the electrode was immersed in blood, which caused most of the RF energy to be delivered into the blood. It is known that the CF contributes to the formation of larger lesion area and deeper lesion. These findings are consistent with those of Nakagawa et al. [Citation26], who studied CF to create RF lesion size in AF ablation.
Petras et al. [Citation27] introduced a computational model that takes into account tissue elasticity and analyzed deformation and power dissipation in the tissue at different CF values. They found that the stiffness of the cardiac wall affects the amount of power dissipated in the tissue, which in turn has a marked effect on the dimensions of the RF lesion. We obtained a similar conclusion: the magnitude of the CF value affected the size of the RF lesion. In other words, the lesion size increased with the CF value. However, there are some discrepancies between the results reported by Petras et al. and those of our simulation, namely in terms of lesion depth and width, which have two possibly explanations: (1) a linear elastic material model and a constant-power ablation strategy was used in the computer model developed by Petras et al., whereas a hyperelastic material model and a constant-voltage constraint strategy was applied in our computer model, and (2) an external factors board between the tissue and dispersive electrode was included in the model developed by Petras et al., and they tuned the conductivity of the external factors board to match the actual power delivered to the tissue.
An animal model showed that the ablation depth and width reflect a power function relation with CF value. Ablation Index (AI: ) is a novel lesion quality marker that is calculated automatically by the CARTO 3 (Biosense Webster, Inc.) system [Citation28]. The formula used to calculate the ablation index is a complex weighted exponential formula that assigns different weights to power, CF, and time. The constants of a, b, c, and k are proprietary and unpublished. In our simulation, we found that the relationship between lesion size and CF can be fitted to a power function, where lesion size = a × CFb (lesion depth = 3.17 × CF0.14 and lesion width = 5.17 × CF0.14; see ), which is consistent with the lesion size and CF value relationship in the ablation index formula.
We discovered that lesion had a width that was approximately 1.6-times its depth. However, Eduardo et al. [Citation29] reported a ratio of lesion width to lesion depth of approximately 1.54. The difference may be due to their use of a saline irrigation catheter for ablation in their experiment, which reduced the ratio of lesion width to lesion depth. Despite the differences between the simulation and experiment results, it is clear that lesion width is significantly greater than lesion depth during ablation, whether measured during a simulation or experiment.
To improve the success rate of cardiac arrhythmia treatment, complete transmural lesions or deeper lesions are often required to create a 1–3-mm-thick cardiac wall. Some theoretical studies have concluded that unipolar ablation can create discrete lesions and transmural lesions on 1–3-mm-thick myocardium walls, but these studies lack data regarding the effect of CF on thermal lesions [Citation30]. In our simulation model, the effect of CF on lesion size was taken into account, and we discovered that a transmural lesion of >3 mm was created in a myocardium when the CF value was between 10 and 40 g with a voltage of 50 V and duration of 30 s. It has been proven that excessive myocardial thermal lesion or non-transmural point lesion caused by inappropriate catheter CF is a critical cause of atrial–esophageal fistula or incomplete electrical isolation. Therefore, in the case of a thick myocardial wall (such as a ventricular wall), a high CF value (e.g., CF = 40 g), should be applied to achieve a relatively great thermal lesion depth. However, in the case of a thin myocardial wall, such as the posterior wall of the atrium or pulmonary vein antrum, a low CF value should be used to prevent overheating injury or serious complications such as atrial–esophageal fistula.
The results also suggested that adjusting ablation duration in accordance with CF can produce a similar RF lesion size. To achieve lesions of similar lesion depth (approximately 2 mm, see ) in the cardiac tissue despite variation in CF, we increased the ablation duration at sites of low CF (5 g) and reduced the ablation duration at sites of high CF (40 g). In addition, a similar RF lesion size was achieved by modulating RF power in accordance with CF (i.e., high RF power at a low CF value and low RF power at a high CF value).
Leo et al. [Citation31] established an estimation formula for predicting thermal lesion cross section area during RF ablation through in vitro experiments. Their estimation formula for lesion cross section area was as follows: π × (A/2) × (B/2), where A is the lesion depth, and B is the lesion width. We substituted the theoretically calculated lesion depth and lesion width into this estimation formula and found that the maximum difference was 4.5% between the predicted lesion area calculated by the estimation formula and simulation calculation area when CF = 40 g. The difference may be caused by the factor that Leo et al. [Citation31] considered the thermal lesion morphology as an elliptical shape and calculate it by the ellipse area formula. However, in the present simulation study, we discovered that the lesion shape was not elliptical at a high CF value.
Our results revealed that the greater the CF value, the earlier the starting time to denaturation of the myocardium. This means that to create the same lesion depth or lesion width, high CF values have a shorter ablation time than do low CF values. Therefore, in clinical practice, appropriate ablation time should be selected on the basis of CF value. We discovered that the maximum temperature of the myocardium increased with the increase of CF. We also learned that the temperature sensor is usually attached to the bottom of the active electrode to sense real-time temperature; therefore, the target temperature should be set lower to avoid the excessive thermal damage that appears when using a high CF value.
Study limitations
Because accurate control of RF lesions are fundamental to optimizing ablation strategies, the use of a computer model coupled with CF, electric, and thermal fields is a substantial step toward a more realistic description. However, numerous limitations are still present. First, we used the material parameters of a dog heart instead of a human heart to simulate the deformation of the myocardium under CF. In addition, we considered an isotropic and homogeneous cardiac tissue, even though the myocardium structure is highly complex and its surface is not smooth. The systole or diastole of a heart changes the stiffness of the myocardial tissue, and the myocardium is much harder in the systole of a heart; therefore, the electrode is more difficult to embed in the myocardium. Additionally, in the mechanical model, we did not consider the effect of myocardial stiffness changes on myocardial deformation. These limiting factors may have caused the simulated myocardial deformation to differ from the actual deformation.
We used a non-irrigated catheter to perform cardiac ablation. To create complete transmural lesions or deeper lesions in the thick atria, an irrigated catheter should be used [Citation32]. In clinical application, the power delivery protocol is usually based on a constant temperature algorithm, where a voltage boundary condition on the active electrode is adjusted to maintain a constant electrode tip temperature. However, in this study, the RF voltage was fixed at a constant value (50 V) for the entire ablation duration. To obtain comprehensive results, the ablation voltage setting should be tuned rather than set at a value of 50 V.
Blood flow was modeled using a fixed convection coefficient on the electrode–blood and endocardium–blood interfaces, which is only representative of a constant blood flow rate. However, in clinical applications, blood flow rate varies with a heart’s diastolic and systolic variables [Citation33]. A more accurate method of modeling blood flow is to consider blood as a laminar fluid flow with high and low flow velocities instead of using convective boundary conditions [Citation34]. Additionally, the water vaporization of tissue is an important process in RF ablation. The phase change of cardiac tissue should be considered in the model for temperatures greater than 100 °C to simulate water vaporization. However, in clinical practice, the maximum temperature limitation is usually set at 50 °C–55 °C to avoid excessive thermal lesions. From simulation models, we determined that the ablation voltage amplitude and ablation time required to restrict the maximum tissue temperature should be less than 100 °C during the entire procedure. Therefore, we have not considered the phase change in tissue vaporization to simulate its dissection when it reaches a temperature higher than 100 °C.
Conclusion
The simulation results confirmed that CF is a major determinant of RF lesion size and that electrode–tissue CF affects the amount of power dissipated in tissue. At a constant RF voltage and application time, RF lesion size increases as CF increases.
Disclosure statement
The authors alone are responsible for the content and writing of the paper.
Additional information
Funding
Related Research Data
References
- Furberg CD, Psaty BM, Manolio TA, et al. Prevalence of atrial fibrillation in elderly subjects (the Cardiovascular Health Study). Am J Cardiol. 1994;74(3):236–241.
- Wang Y, Liu X, Tan H, et al. Evaluation of linear lesions in the left and right atrium in ablation of longstanding atrial fibrillation. Pacing Clin Electrophysiol. 2013;36(10):1202–1210.
- O'Neill MD, Wright M, Knecht S, et al. Long-term follow-up of persistent atrial fibrillation ablation using termination as a procedural endpoint. Eur Heart J. 2009;30(9):1105–1112.
- Guerra JM, Jorge E, Raga S, et al. Effects of open-irrigated radiofrequency ablation catheter design on lesion formation and complications: in vitro comparison of 6 different devices. J Cardiovasc Electr. 2013;24(10):1157–1162.
- Nilshan A, Kumar S, Thomas SP, et al. Role of contact force sensing in catheter ablation of cardiac arrhythmias. JACC Clin Electrophysiol. 2018; 4(6):707–723.
- Ikeda A, Nakagawa H, Lambert H, et al. Relationship between catheter contact force and radiofrequency lesion size and incidence of steam pop in the beating canine heart: electrogram amplitude, impedance, and electrode temperature are poor predictors of electrode-tissue contact force and lesion size. Circ Arrhythm Electrophysiol. 2014;7(6):1174–1180.
- Reddy VY, Dukkipati SR, Neuzil P, et al. Randomized, controlled trial of the safety and effectiveness of a contact force-sensing irrigated catheter for ablation of paroxysmal atrial fibrillation: results of the TactiCath Contact Force Ablation Catheter Study for Atrial Fibrillation (TOCCASTAR) Study. Circulation. 2015;132(10):907–915.
- Kuck KH, Reddy VY, Schmidt B, et al. A novel radiofrequency ablation catheter using contact force sensing: Toccata study. Heart Rhythm. 2012;9(1):18–23.
- Shah DC, Namdar M. Real-time contact force measurement: a key parameter for controlling lesion creation with radiofrequency energy. Circ Arrhythm Electrophysiol. 2015;8(3):713–721.
- Shah D, Lambert H, Langenkamp A, et al. Catheter tip force required for mechanical perforation of porcine cardiac chambers. EP Europace. 2011;13(2):277–283.
- Chabiniok R, Wang VY, Hadjicharalambous M, et al. Multiphysics and multiscale modelling, data–model fusion and integration of organ physiology in the clinic: ventricular cardiac mechanics. Interface Focus. 2016;6(2):20150083–20150024.
- Yang C, Tang D, Haber I, et al. In vivo MRI-based 3D FSI RV/LV models for human right ventricle and patch design for potential computer-aided surgery optimization. Comput Struct. 2007; 85(11–14):988–997.
- Tang D, Yang C, Geva T, et al. Multi-physics MRI-based two-layer fluid–structure interaction anisotropic models of human right and left ventricles with different patch materials: cardiac function assessment and mechanical stress analysis. Comput Struct. 2011;89(11):1059–1068.
- Tang D, Yang C, Geva T, et al. Two-layer passive/active anisotropic FSI models with fiber orientation: MRI-based patient-specific modeling of right ventricular response to pulmonary valve insertion surgery. Mol Cell Biomech. 2007;4(3):159–176.
- Tang D, Yang C, Geva T, et al. Image-based patient-specific ventricle models with fluid–structure interaction for cardiac function assessment and surgical design optimization. Prog Pediatr Cardiol. 2010;30(1–2):51–62.
- Penns HH. Analysis of tissue and arterial blood temperatures in the resting human forearm. J Appl Physiol. 1948;1(2):93–122.
- Irastorza RM, Trujillo M, Martel VJ, et al. Computer modelling of RF ablation in cortical osteoid osteoma: assessment of the insulating effect of the reactive zone. Int J Hyperthermia. 2016;32(3):221–230.
- Yan S, Wu X, Wang W. A simulation study to compare the phase-shift angle radiofrequency ablation mode with bipolar and unipolar modes in creating linear lesions for atrial fibrillation ablation. Int J Hyperthermia. 2016;32(3):231–238.
- Doss JD. Calculation of electric fields in conductive media. Med Phys. 1982;9(4):566–573.
- Yan S, Wu X, Wang W. Theoretical and experimental analysis of amplitude control ablation and bipolar ablation in creating linear lesion and discrete lesions for treating atrial fibrillation. Int J Hyperthermia. 2017;33(6):608–616.
- Gonzalez-Suarez A, Trujillo M, Koruth J, et al. Radiofrequency cardiac ablation with catheters placed on opposing sides of the ventricular wall: computer modelling comparing bipolar and unipolar modes. Int J Hyperthermia. 2014;30(6):372–384.
- Trujillo M, Berjano E. Review of the mathematical functions used to model the temperature dependence of electrical and thermal conductivities of biological tissue in radiofrequency ablation. Int J Hyperthermia. 2013;29(6):590–597.
- Pearce JA. Comparative analysis of mathematical models of cell death and thermal damage processes. Int J Hyperthermia. 2013;29(4):262–280.
- Jacques SL, Gaeeni MO. Thermally induced changes in optical properties of heart. International Conference of the IEEE Engineering; Seattle, WA; 1989. 4: p. 1199–1200.
- Arenas J, Perez JJ, Trujillo M, et al. Computer modeling and ex vivo experiments with a (saline-linked) irrigated electrode for RF-assisted heating. Biomed Eng Online. 2014; 13(1):164–179.
- Nakagawa H, Jackman WM. The role of contact force in atrial fibrillation ablation. J Atr Fibrillation. 2013;7(1):79–84.
- Petras A, Leoni M, Guerra JM, et al. A computational model of open-irrigated radiofrequency catheter ablation accounting for mechanical properties of the cardiac tissue. Int J Numerical Methods Biomed Eng. 2019;35(11):e3232.
- Das M, Loveday JJ, Wynn GJ, et al. Ablation index, a novel marker of ablation lesion quality: prediction of pulmonary vein reconnection at repeat electrophysiology study and regional differences in target values. Europace. 2017;19(5):775–783.
- Eduardo F, Rodriguez MD, Roberto M, et al. Contact force-sensing catheters: performance in an ex vivo porcine heart model. J Interv Cardiac Electrophysiol. 2018;53(2):141–150.
- Perez JJ, D’Avila A, Aryana A, et al. Electrical and thermal effects of esophageal temperature probes on radiofrequency catheter ablation of atrial fibrillation: results from a computational modeling study. J Cardiovasc Electrophysiol. 2015;26(5):556–564.
- Leo G, Shah D, Lambert H. Method and apparatus for controlling lesion size in catheter-based ablation treatment. US Patent US 20100298826 A1. 2016.
- Ana G-S, Perez JJ, Berjano E. Should fluid dynamics be included in computer models of RF cardiac ablation by irrigated-tip electrodes? Biomed Eng Online. 2018;17(1):1–14.
- Tungjitkusolmun S, Vorperian VR, Bhavaraju N, et al. Guidelines for predicting lesion size at common endocardial locations during radio-frequency ablation. IEEE Trans Biomed Eng. 2001;48(2):194–201.
- Gonzalez-Suarez A, Berjano E. Comparative analysis of different methods of modeling the thermal effect of circulating blood flow during RF cardiac ablation. IEEE Trans Biomed Eng. 2016;63(2):250–259.