
Abstract
Purpose
The aims of this study were to evaluate a semi-automatic segmentation software for assessment of ablation zone geometry in computed tomography (CT)-guided microwave ablation (MWA) of liver tumors and to compare two different MWA systems.
Material and Methods
27 patients with 40 hepatic tumors (primary liver tumor n = 20, metastases n = 20) referred for CT-guided MWA were included in this retrospective IRB-approved study. MWA was performed using two systems (system 1: 915 MHz; n = 20; system 2: 2.45 GHz; n = 20). Ablation zone segmentation and ellipticity index calculations were performed using SAFIR (Software Assistant for Interventional Radiology). To validate semi-automatic software calculations, results (2 perpendicular diameters, ellipticity index, volume) were compared with those of manual analysis (intraclass correlation, Pearson’s correlation, Mann–Whitney U test; p < 0.05 deemed significant.
Results
Manual measurements of mean maximum ablation zone diameters were 43 mm (system 1) and 34 mm (system 2), respectively. Correlations between manual and semi-automatic measurements were r = 0.72 and r = 0.66 (both p < 0.0001) for perpendicular diameters, and r = 0.98 (p < 0.001) for volume. Manual analysis demonstrated that ablation zones created with system 2 had a significantly lower ellipticity index compared to system 1 (mean 1.17 vs. 1.86, p < 0.0001). Results correlated significantly with semi-automatic software measurements (r = 0.71, p < 0.0001).
Conclusion
Semi-automatic assessment of ablation zone geometry using SAFIR is feasible. Software-assisted evaluation of ablation zones may prove beneficial with complex ablation procedures, especially for less experienced operators. The 2.45 GHz MWA system generated a significantly more spherical ablation zone compared to the 915 MHz system. The choice of a specific MWA system significantly influences ablation zone geometry.
Introduction
Microwave ablation (MWA) is increasingly recognized as a minimally invasive, curative treatment in patients with primary hepatic tumors and liver metastases who are unfit for surgical procedures [Citation1–3]. Potential advantages over radiofrequency ablation (RFA) include higher intratumoral temperatures, associated with reduced treatment time, and less susceptibility to the heat sink effect [Citation4,Citation5]. A variety of systems have become available (915 MHz or 2.45 GHz), with high-frequency systems promising faster heating times and higher sphericity of the ablation zone [Citation6]. Today, most MWA systems produce an ovally shaped ablation zone [Citation7,Citation8], which may be unfavorable for example in spherical shaped tumors. However, an ovally shaped ablation zone (e.g. using a 915 MHz system) may be of advantage in a small subcapsularly located tumor treated using a tangential antenna approach [Citation9].
Conventional treatment planning without software-assistance depends on pre-procedural image data rather than interactive real-time imaging and visualization of ablation zones. A trajectory or applicator path is planned to include different factors like surrounding risk structures and an ablative margin of at least 5–10 mm in case of a curative treatment [Citation10]. When visually comparing the resultant ablation zone with the extent of the targeted tumor, one has to take into consideration that tissue shrinkage after MWA may be asymmetrical in all three dimensions [Citation8]. Therefore, the expected geometry and size of the ablation zone are an essential part of the planning process. This task can be challenging, especially for the less experienced interventional radiologist. If the ablation zone does not fully encompass the targeted tumor with a sufficient margin, there is a higher risk for local tumor progression [Citation11]. On the contrary, an ablation zone that is too large could endanger nearby structures and unnecessarily compromise liver function [Citation10]. Software-assisted treatment planning could prove beneficial especially in complex cases. Examples include the treatment of subcapsular located tumors abutting nearby structures, tumors that need to be treated with more than one applicator position, and also for operators with limited experience [Citation12–14]. Software-assisted assessment of therapeutic response could further improve peri-procedural safety and outcome by providing visualization of the ablation zone with regard to a sufficient ablative margin [Citation14,Citation15]. Visualization tools for post- and peri-ablative therapy assessment have been introduced for RFA [Citation16] but are still limited for MWA. Due to differences in RFA and MWA regarding heat propagation and associated tissue shrinkage, algorithms are not readily transferable in general. However, the basic algorithms for segmentation and registration, as needed in this work, are transferable to MWA by taking care of the correct interpretation [Citation17,Citation18].
The purpose of our present study was twofold: first, to evaluate a semi-automatic segmentation analysis for assessment of ablation zone geometry. And second, to compare ablation zone geometry in CT-guided MWA of liver tumors using two different MWA systems (915 MHz and 2.45 GHz).
Materials and methods
Patients
This study was approved by the local Institutional Review Board with a waiver of patient consent granted. Respective interventions were selected retrospectively and consecutively from a database of patients that were treated by CT-guided MWA. Inclusion criteria were as follows: tumors treated with a single ablation position and a single antenna; MWA performed with a curative intent; technically successful ablation procedure; adequate coagulation status (activated prothrombin time < 50 s, INR/Quick > 50%, platelet count > 50,000 µL).
Finally, 27 patients treated between 2011 and 2016 (21 male, 6 female; median age 66 years, range 24–90 years) with 40 hepatic tumors (hepatocellular carcinoma (HCC) n = 17, cholangiocarcinoma (CCA) n = 3, metastases n = 20) were included in this study. Patient demographic data is presented in detail in .
Table 1. Patient and tumor characteristics of hepatic MWA performed using two different MWA systems.
CT-guided MWA
Ablations were performed under general anesthesia and CT guidance (16 slice scanner; Lightspeed GE Healthcare, Milwaukee, WI, USA) using the SmartStep mode (single low dose slices acquired intermittently during antenna placement). Pre- and post-interventional biphasic imaging was performed with acquisition in the arterial and portal-venous phase (60 ml contrast agent, Imeron 300®, Bracco Imaging GmbH, Konstanz, Germany) injected at a flow of 4 ml/s. MWA was performed using one of two systems: Evident™ (n = 20) or Emprint™ (n = 20) Microwave Ablation Systems (both Medtronic Inc., Minneapolis, MN, USA, formerly Covidien). The lower-output Evident™ system consists of a 915 MHz generator with a maximum power of 45 W, while the higher output Emprint™ system (2.45 GHz) can generate a maximum power of 100 W. The use of different ablation systems throughout the study period resulted from changes in clinical routine with a newer generation system becoming available. Ablations were performed according to the manufacturer’s recommendations. Recommended ablation time for the low output system varied between 7 and 10 min and for the high-output system between 1 and 10 min, respectively. All ablations were adapted to tumor size, with an anticipated ablative margin of at least 5 mm. Track ablation was performed in all tumors. Post-interventional CT was used to evaluate treatment success and assess immediate complications. Complications were assessed according to the CIRSE Classification System [Citation19]. Follow-up imaging included either contrast-enhanced CT or MRI, 6–8 weeks after the ablation procedure and after that every 4 months within the first year, followed by 6-month interval.
Image analysis
In all cases, image analysis and evaluation of ablation zone geometry were performed semi-automatically and manually on post-interventional portal-venous phase images, which were acquired within five minutes after the end of the ablation procedure.
A. Semi-automatic assessment
Semi-automatic evaluation of ablation zone geometry was performed using SAFIR (Software Assistant For Interventional Radiology), software supporting clinical studies for ablation planning, simulation and evaluation based on the platform MeVisLab (MeVis Medical Solutions AG and Fraunhofer MEVIS, Bremen, Germany). This software has been first implemented and described for image-guided therapies using RFA, and may be used for other thermal ablation techniques including laser-, cryo- and MWA. Please refer to the previously published literature [Citation20] for more information.
Pre-intra- and post-interventional CT datasets were uploaded to the software, which was installed on a commercially available laptop. The semi-automatic workflow is outlined in and included the following steps. First, the position of the antenna was superimposed virtually on the intra-interventional image, whereby the position and angulation of the antenna corresponded to the actual position captured on the image. A line corresponding to the maximal diameter of the ablation zone was then manually drawn on an axial post-interventional image. The software then automatically performed three-dimensional segmentation of the whole ablation zone. Note that the underlying segmentation algorithm is not specific to MWA or other ablative techniques, and could also be used for tumor segmentation [Citation21]. If necessary, manual adjustments correcting ablation zone boundaries on single slices using a brush tool or a contour tool were possible, with updated results being interpolated between the slices. An example of a semi-automatic segmentation using SAFIR is provided in . In addition, automatic calculation of ablation volume and of maximal ablation zone diameters in perpendicular planes (diameter 1 (d1) and diameter 2 (d2)) and ellipticity index (EI = d1/d2) was performed, the latter as proposed previously [Citation24] and as demonstrated in . An ellipticity index of 1 indicated a perfect spherical ablation zone, while indices smaller or greater one than 1 implied an oval-shaped ablation zone.
Figure 1. Workflow for manual (left column) and semi-automatic (right column) assessment of the ablation zone.
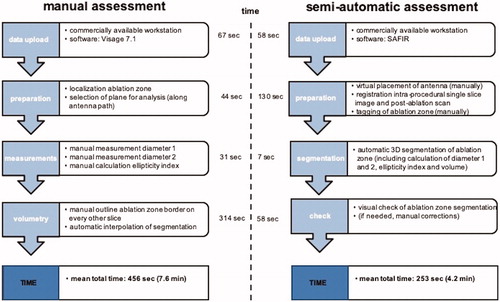
Figure 2. Comparison of semi-automatic (A–C) and manual (D) ablation zone assessment after MWA of a tumor located in the hepatic dome. SAFIR provides a VRT visualization including the position of the virtual antenna in the upper left window and multiplanar reformations (MPR) in the remaining viewer windows. (A) A line (red) corresponding to the maximal diameter of the ablation zone is drawn manually on an axial post-interventional image. In addition, transient hyperemia (white arrows) surrounding the actual ablation zone can be appreciated. (B) Initial results after automatic ablation zone segmentation (yellow) with superimposed antenna position. Notably, there is obvious incongruence between the real and the automatically segmented ablation zone, as the surrounding hyperemia has been mistakenly accounted for part of the ablation zone. (C) Final semi-automatic ablation zone segmentation result (yellow) after manual adjustments of ablation zone boundaries. (D) Manual evaluation of the ablation zone (highlighted in red) in the same patient.
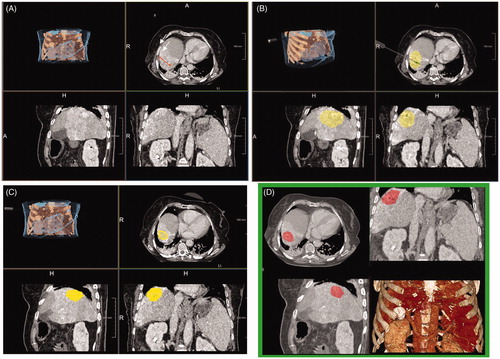
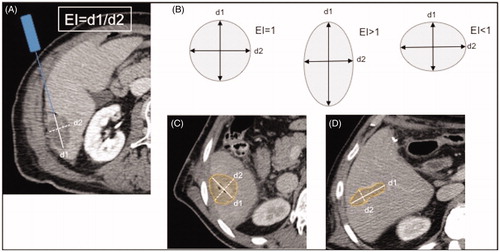
Figure 3. Ellipticity index calculation based on the maximal diameter of the ablation zone along the inserted antenna (d1, white line) divided by the maximal diameter perpendicular to the former (d2, white dashed line; A). An ellipticity index of 1 indicates a perfect spherical ablation zone, while indices smaller or greater one than 1 implies an oval-shaped ablation zone (B). MWA (10 min at 100 W) of an HCC in a 50-year-old male patient using the 2.45 GHz system (C). The ablation zone is shaped nearly perfectly spherical, as reflected by an ellipticity index of 1.1. MWA (10 min at 45 W) of a colorectal liver metastasis in a 75-year-old male patient using the 915 MHz system (D). In comparison, the resultant ablation zone has a distinct oval configuration with a respectively ellipticity index of 3.3.
B. Manual assessment
Manual segmentation and evaluation of ablation zone geometry were performed on a commercially available workstation (Visage 7.1, Pro Medicus Inc., Melbourne, VIC, Australia) in consensus by one board-certified radiologist (12 years of experience in abdominal imaging and percutaneous ablation) and one radiology resident (third year), respectively. Maximal ablation zone diameters in two perpendicular planes were measured as described above for the calculation of ellipticity indices. In addition, ablation zone volumetry was performed separately by each reader for interrater comparison of measurements four weeks after the initial analysis. The time needed for ablation zone volumetry was noted.
Statistical analysis
Statistical analysis was performed using SPSS software (version 22; IBM Corporation, New York, USA). Patient and tumor characteristics between interventions performed with the two different ablation systems were compared using t-tests, Χ2 tests and Mann–Whitney U tests, respectively. Comparison of ablation zone diameters and ellipticity indices between the two different systems was performed using Mann–Whitney U tests. Manual and semi-automatic measurements were compared using Pearson correlation (two readers in consensus vs. semi-automatic) and intraclass correlation coefficient (reader 1 vs. reader 2 vs. semi-automatic). A value of p < 0.05 was considered statistically significant for all analyses.
Results
Patients
With regard to patient age, sex, and tumor size, there were no significant differences between the groups treated with different ablation systems. However, in the group treated with the higher output system (group 2), there were significantly more patients with liver cirrhosis and HCC (both p < 0.0001; ).
CT-guided MWA
Mean ablation time between both groups was significantly different (p < 0.0001, Mann–Whitney U test): 10 min for the low output system, and mean 5.5 min (range 1.5–10 min) for the high-output system, respectively. Ablations utilizing the 915 MHz system were all carried out with a power of 45 W, whereby ablations utilizing the 2.45 GHz ablation power varied between 75 and 100 W (mean 97.5 W), resulting in a significant difference between both groups (p < 0.0001, Mann–Whitney U test).
Technical success was 100% in both groups. All tumors were treated according to the protocol and covered completely by the respective ablation zone, as confirmed on post-interventional contrast-enhanced biphasic CT. Regarding complications, there was no significant difference between patients treated with the two systems (p = 0.698, Χ2-test). In both groups, two small pneumothoraces (resulting from a transpleural approach) were observed, which resolved spontaneously without the need for treatment (grade 1 according to the CIRSE classification) [Citation19]. At clinical follow-up, local tumor progression was not significantly different (30% for the 915 MHz system versus 25% for the 2.45 GHz system at a mean time of 296 versus 139 days; p = 0.938).
Comparison of MWA systems and ablation zone geometry
Use of the 915 MHz system resulted in ablation zones significantly longer in the plane of the antenna path (d1) as compared to ablations performed with 2.45 GHz system (mean 42.9 vs. 34 mm; p < 0.01), but not in the plane perpendicular to the antenna (d2). Consecutively, the high-output system-generated ablation zones with an ellipticity index closer to 1, indicating a more spherical configuration. This was true not only for manual analysis of ablation zone geometry, but also for the semi-automatic analysis ( and ).
Table 2. Comparisons of ablation zone geometry using two different MWA systems.
Comparison of manual and semi-automatic measurements
Manual and semi-automatic measurements of ablation zone dimensions and volumes correlated well, as reflected by correlation coefficients between 0.66 and 0.98 (), even though there was a slight underestimation of ablation volume at semi-automatic analysis. Comparison of manual and semi-automatic measurements, also considering the different MWA systems, is presented in more detail in . Similarly, very good correlations for manual and semi-automatic measurements could be observed at the subgroup analysis (), which looked specifically at patients with underlying cirrhosis and differentiated between primary and secondary liver tumors. All measurements showed a statistically significant correlation, except the ellipticity index in the cirrhotic liver and in the case of primary liver tumors, respectively. Looking at the specific measurements in more detail, diameter and volume measurements both tended to be slightly lower at software calculation as compared to manual analysis ().
Figure 4. Scatter plot demonstrating the results of the semi-automatic analysis on the y-axis and the results of the manual analysis on the x-axis. Shown are the respective results for ablation zone diameter 1 (A), ablation zone diameter 2 (B) and ablation zone ellipticity index (C), distinguishing also between ablations performed with the 915 MHz system (Δ) and ablations performed with 2450 MHz system (•).
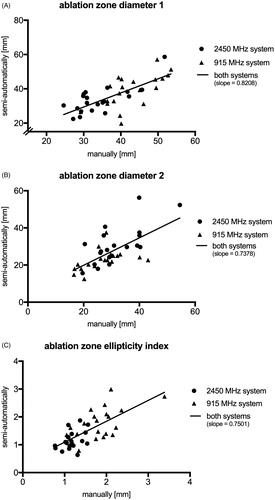
Table 3. Pearson correlation of ablation zone evaluation at manual and semi-automatic analysis in specific subgroups of patients.
Interrater agreement between the two readers regarding ablation volume measurements was excellent with a correlation coefficient of 0.924 (p < 0.05). Volume measurements by both readers tended to be larger than the software calculated ablation volume. Reader 1 needed significantly more time per dataset to manually segment the ablation volume compared to the more experienced reader 2 (mean 513 versus 98 s, p < 0.001) (). Mean time for semi-automatic assessment was 7 s. The semi-automatic segmentation algorithm worked well in all cases, using the same images as for manual analysis. Of note, minor manual adjustments correcting ablation zone boundaries were necessary in every case. The workflow comparing manual and semi-automatic assessment of the ablation zone including the time needed for each step is presented in detail in .
Table 4. Interrater agreement regarding ablation volumetry and comparison with semi-automatic analysis.
Discussion
In the present study, we demonstrated that semi-automatic assessment of ablation zone geometry using a software solution called SAFIR is feasible, and correlates well with manual measurements. Semi-automatic ablation zone evaluation worked well for primary and secondary liver tumors, in cirrhotic as well as non-cirrhotic livers. Furthermore, it was shown that the choice of a specific MWA system has a significant impact on ablation zone geometry. Specifically, the high-output 2.45 GHz system used produced ablation zones significantly closer to a spherical shape as compared to the 915 MHz system. This emphasizes the fact that not only the expected size but also the expected geometry of the resultant ablation zone needs to be taken into account in treatment planning. In this context however, frequency is just one parameter that characterizes a specific MWA system. It is important to keep in mind that other parameters, including applied energy and antenna design may also contribute to differences in ablation zone size and morphology when comparing different systems [Citation22].
Our results regarding differences in ablation zone morphology are in line with a previous study published by Vogl and colleagues [Citation23] even though the methods of ablation zone geometry measurements were varying. Different approaches for assessment of MWA zone geometry have been described, including a sphericity evaluation on a slice-per-slice basis [Citation24] or the calculation of a sphericity index as volume deviation from the perfect sphere calculated on a slice-per-slice basis [Citation23]. As the ellipticity index considers the antenna trajectory in the calculation, which is not always parallel to the axial plane of image reconstruction, this might be a more fitting parameter to objectively describe ablation zone geometry. Also, tissue shrinkage after MWA may be asymmetrical in all three dimensions [Citation8], possibly making image interpretation of ablation zones post-treatment more difficult. Therefore, it is crucial to always assess ablation zone geometry in relation to the original antenna position and pre-interventional images [Citation24–26]. As such, an evaluation strictly based on axial images should be interpreted with caution.
Liver segmentation in general has been discussed extensively in the literature, including manual, semi-automatic and fully automatic methods. However, the segmentation of individual hepatic lesions and post-therapeutic changes remains challenging [Citation27]. In the case of MWA, evaluation of the ablation zone in the immediate post-interventional setting may be aggravated by reactive hyperemic changes, which can be observed regularly (see also ) [Citation10,Citation24]. In addition, low-contrast boundaries may impair differentiation of the ablation zone and surrounding parenchyma, especially for automatic threshold-based-techniques, and as well as for less experienced interventional radiologists. Especially in the cirrhotic liver, segmentation can prove difficult due to inhomogeneous parenchyma contrast. In the present study, we were able to demonstrate that SAFIR consistently enables semi-automatic assessment of the ablation zone also in the case of underlying liver cirrhosis. However, even these results always should be validated by a radiologist to avoid misinterpretation of software-based segmentations. Of note, there was a slight underestimation of both diameter measurements as well as volume calculations at semi-automatic analysis. Both readers independently confirmed this tendency of larger ablation zone volume calculations at manual analysis. This deviation may be related to varying causes. One possible factor is the circumstance that the specific CT slice selected for measurement of maximum ablation zone diameters was not necessarily identical at manual and semi-automatic analysis, as these approaches were not performed side by side. Secondly, the underlying techniques for volume calculations differed. For the manual approach, the border of the ablation zone was determined and outlined manually based on the macroscopically detectable color change of the coagulated tissue, as described in previous studies [Citation5]. In the semi-automatic approach, on the other hand, volume calculations were performed voxel-based on all slices, probably resulting in a slightly different distinction of the ablation zone border, as compared to manual analysis. In this context, also intrarater variance may contribute to a small deviation of ablation zone depiction and therefore calculated volumes, as segmentations were not performed side by side.
Manual 3 D measurement of the ablation zone, including calculation of the ellipticity index taking into account needle trajectory, may be very time-consuming and especially for the less experienced radiologist. Therefore, software-assistance may prove beneficial in objectively assessing the ablation outcome in terms of morphology. Not surprisingly, in our study the less experienced radiologist needed a significantly larger amount of time to manually segment the ablation volume. In this context, a good volume correlation is only a minor part of a successful segmentation. For example, a segmentation can be exceptionally elliptical and still have the same volume as a sphere. Therefore, evaluation of ablation zone shape as assessed by diameters and ellipticity index are more reliable parameters for evaluation of the segmentation success, and should be preferably used for comparison of ablation results.
This study has some limitations. It is a retrospective study, and the number of patients and ablations included is small. Tumor volumes and absolute ablation duration varied between both systems, as ablations were carried out according to the manufacturer’s instructions and adapted to tumor size. Group 1 (915 MHz system) consisted mostly of treated liver metastases, while in group 2 (2.45 GHz system) mostly HCC were treated, consequently with a significantly higher proportion of underlying cirrhosis. This difference in lesion distribution between both groups was accidental due to a change of the utilized the MWA system within the study period. Looking at the ellipticity index specifically in patients with underlying cirrhosis as compared to patients without cirrhosis, there were significant differences at semi-automatic analysis (p < 0.01). This bias may have in addition contributed to the differences of ablation zone geometry between both applied MWA systems. Furthermore, the change of MWA systems resulted in different mean follow-up times (296 versus 139 days). Nevertheless, there was no significant difference regarding local tumor progression.
In conclusion, semi-automatic assessment of ablation zone geometry using SAFIR is feasible, and may aid in objective evaluation of technical outcome after hepatic MWA. Semi-automatic results need to be validated by radiologists to avoid misinterpretation of reactive hyperemic changes surrounding the actual ablation zone. Except for timesaving, one major advantage of semi-automatic image evaluation is an overall more objective assessment of ablation outcome, which can support especially the less experienced interventional radiologist. Further benefits may include image-based reconstructions of the antenna path, instant 3 D segmentation, and measurements including automated statistical analysis for clinical databases. Ablation zones generated by different systems may be assessed readily. In this context, the choice of a specific MWA system has a significant impact on the geometry of the ablation zone, which should be taken into account in treatment planning.
Disclosure statement
No potential conflict of interest was reported by the author(s).
Additional information
Funding
References
- Liang P, Wang Y. Microwave ablation of hepatocellular carcinoma. Oncology. 2007;72 Suppl 1 (Suppl 1):124–131.
- Jones C, Badger SA, Ellis G. The role of microwave ablation in the management of hepatic colorectal metastases. Surgeon. 2011;9(1):33–37.
- Gillams A, Goldberg N, Ahmed M, et al. Thermal ablation of colorectal liver metastases: a position paper by an international panel of ablation experts, The Interventional Oncology Sans Frontières meeting 2013. Eur Radiol. 2015;25(12):3438–3454.
- Meloni MF, Chiang J, Laeseke PF, et al. Microwave ablation in primary and secondary liver tumours: technical and clinical approaches. Int J Hyperthermia. 2017;33(1):15–24.
- Ringe KI, Lutat C, Rieder C, et al. Experimental evaluation of the heat sink effect in hepatic microwave ablation. PLoS One. 2015;10(7):e0134301.
- Lopresto V, Pinto R, Farina L, et al. Treatment planning in microwave thermal ablation: clinical gaps and recent research advances. Int J Hyperthermia. 2017;33(1):83–100.
- Simon CJ, Dupuy DE, Iannitti DA, et al. Intraoperative triple antenna hepatic microwave ablation. AJR Am J Roentgenol. 2006;187(4):W333–40.
- Farina L, Weiss N, Nissenbaum Y, et al. Characterisation of tissue shrinkage during microwave thermal ablation. Int J Hyperthermia. 2014;30(7):419–428.
- Vo Chieu VD, Werncke T, Hensen B, et al. CT-guided microwave ablation of liver tumors in anatomically challenging locations. Cardiovasc Intervent Radiol. 2018;41(10):1520–1529.
- Ahmed M, Solbiati L, Brace CL, et al.; Standard of Practice Committee of the Cardiovascular and Interventional Radiological Society of Europe. Image-guided tumor ablation: standardization of terminology and reporting criteria-a 10-year update. J Vasc Interv Radiol. 2014;25(11):1691–1705 e4.
- Shady W, Petre EN, Do KG, et al. Percutaneous microwave versus radiofrequency ablation of colorectal liver metastases: ablation with clear margins (A0) provides the best local tumor control. J Vasc Interv Radiol. 2018;29(2):268–275 e1.
- Altrogge I, Preusser T, Kroger T, et al. Multiscale optimization of the probe placement for radiofrequency ablation. Acad Radiol. 2007;14(11):1310–1324.
- Schenk A, Haemmerich D, Preusser T. Planning of image-guided interventions in the liver. IEEE Pulse. 2011;2(5):48–55.
- Kaye EA, Cornelis FH, Petre EN, et al. Volumetric 3D assessment of ablation zones after thermal ablation of colorectal liver metastases to improve prediction of local tumor progression. Eur Radiol. 2019;29(5):2698–2705.
- Puijk RS, Ruarus AH, Scheffer HJ, et al. Percutaneous liver tumour ablation: image guidance, endpoint assessment, and quality control. Can Assoc Radiol J. 2018;69(1):51–62.
- Rieder C, Weihusen A, Schumann C, et al. Visual support for interactive post-interventional assessment of radiofrequency ablation therapy. Computer Graphics Forum. 2010;29(3):1093–1102.
- Amabile C, Farina L, Lopresto V, et al. Tissue shrinkage in microwave ablation of liver: an ex vivo predictive model. Int J Hyperthermia. 2017;33(1):101–109.
- Facciorusso A, Di Maso M, Muscatiello N. Microwave ablation versus radiofrequency ablation for the treatment of hepatocellular carcinoma: a systematic review and meta-analysis. Int J Hyperthermia. 2016;32(3):339–344.
- Filippiadis DK, Binkert C, Pellerin O, et al. Cirse quality assurance document and standards for classification of complications: the cirse classification system. Cardiovasc Intervent Radiol. 2017;40(8):1141–1146.
- Weihusen AT, Preusser T, Zidowitz S, et al. Workflow oriented software support for image guided radiofrequency ablation of focal iver malignancies. In: Cleary KR, Miga MI, editors. Medical imaging 2007: visualization and image-guided procedures 650919. SPIE: San Diego; 2007. p. 1–9.
- Moltz J,L, Kuhnigk JM, Dicken V, et al. Advanced segmentation techniques for lung nodules, liver metastases, and enlarged lymph nodes in CT scans. IEEE J Sel Top Signal Process. 2009;3(1):122–134.
- Curto S, Taj-Eldin M, Fairchild D, et al. Microwave ablation at 915 MHz vs 2.45 GHz: A theoretical and experimental investigation. Med Phys. 2015;42(11):6152–6161.
- Vogl TJ, Basten LM, Nour-Eldin NA, et al. Evaluation of microwave ablation of liver malignancy with enabled constant spatial energy control to achieve a predictable spherical ablation zone. Int J Hyperthermia. 2018;34(4):492–500.
- Mulier S, Ni Y, Frich L, et al. Experimental and clinical radiofrequency ablation: proposal for standardized description of coagulation size and geometry. Ann Surg Oncol. 2007;14(4):1381–1396.
- Mulier S, Ni Y, Jamart J, et al. Local recurrence after hepatic radiofrequency coagulation. Ann Surg. 2005;242(2):158–171.
- Mulier S, Ni Y, Miao Y, et al. Size and geometry of hepatic radiofrequency lesions. Eur J Surg Oncol. 2003;29(10):867–878.
- Gotra A, Sivakumaran L, Chartrand G, et al. Liver segmentation: indications, techniques and future directions. Insights Imaging. 2017;8(4):377–392.