
 ?Mathematical formulae have been encoded as MathML and are displayed in this HTML version using MathJax in order to improve their display. Uncheck the box to turn MathJax off. This feature requires Javascript. Click on a formula to zoom.
Abstract
Background
The thermally-induced urine flow can generate cooling that may alter the treatment outcome during hyperthermic treatments of bladder cancer. This paper investigates the effects of natural convection inside the bladder and at skin surface during gold nanorods (GNR) - assisted photothermal therapy (PTT) of bladder cancer in mice.
Methods
3D models of mouse bladder at orientations corresponding to the mouse positioned on its back, its side and its abdomen were examined. Numerical simulations were carried out for GNR volume fractions of 0.001, 0.005 and 0.01% and laser power of 0.2 and 0.3 W.
Results
The obtained results showed that cooling due to natural convection inside the bladder and above the skin depends on the mouse orientation. For a mouse positioned on its back, on its side or on its abdomen, the maximum temperature achieved inside the tumour at 0.001% GNR volume fraction and 0.2 W laser power was 55.2°C, 50.0°C and 52.2°C, respectively compared to 56.8°C when natural convection was not considered. The average thermal gradients when natural convection was considered were also lower, suggesting a more homogenous temperature distribution.
Conclusions
Natural convection inside the bladder can be beneficial but also detrimental to GNR-assisted PTT depending on the level of heating. At low levels of heating due to low GNR volume fraction and/or laser power, flow inside the bladder may dissipate heat from the targeted tissue; making the treatment ineffective. At high levels of heating due to high GNR volume fraction and/or laser power, cooling may prevent excessive thermal damage to surrounding tissues.
1. Introduction
Nanoparticle-assisted photothermal therapy (PTT) is a thermal ablation technique that uses nanoparticles as photoabsorbers to generate heat within the tumor tissue upon laser irradiation [Citation1]. Gold nanorods (GNR) represent a suitable choice of photoabsorbers due to their tunable optical properties. By altering the aspect ratio, GNR can be tuned to exhibit peak absorbance over a broad spectral range [Citation2]. This is particularly useful in biological applications as GNR can be tuned to allow peak absorption in the near-infrared (NIR) region (600–1300 nm), also known as the biological window, where light penetration through tissue is at its maximum [Citation3].
Of interest in this study is the treatment of bladder cancer using GNR-assisted PTT. Bladder cancer is the most common form of cancer of the urinary tract and is the ninth most common cancer worldwide [Citation4,Citation5]. Treating bladder cancer is difficult mainly due to an incomplete understanding of the disease biology and the limited availability among current therapeutic systems that can effectively eradicate the disease [Citation6]. Recent studies have confirmed GNR-assisted PTT as an effective method for treating bladder cancer [Citation7–13]. Nevertheless, these studies were carried out in vitro and using animal models as a substitute for the human bladder, with research leading to potential clinical trials still ongoing. Under these circumstances, numerical simulations can play an important role in supplementing vital information toward the advancement of this technique, such as the optical and thermal responses of tissues during treatment.
Models of nanoparticle-assisted PTT have been developed in the past to elucidate the role of various parameters influencing the treatment. For instance, Soni et al. [Citation14,Citation15] developed computational models to investigate the influence of optical coefficients and inhomogeneous GNR distribution inside the tumor on the tissue heating characteristics. Singh et al. [Citation16] investigated the effects of different laser parameters during the treatment of vascularized tissues using gold nanoshells-mediated PTT. Jeynes et al. [Citation17] examined the effectiveness of GNR-assisted PTT for eradicating skin cancer, while Manuchehrabadi and Zhu [Citation18] focused on the development of computational models that facilitated the protocol design for treating prostate cancer.
To ensure that the results obtained from the numerical simulations are reliable, the physics describing the different processes that are involved during the treatment must be given careful considerations. In the case of GNR-assisted PTT of bladder cancer, natural convection inside the bladder due to the thermally-driven flow of urine can potentially affect the accuracy of the model predictions if they are not properly accounted for during the simulations. Studies carried out on regional hyperthermic treatment of the bladder have demonstrated how natural convection arising from the thermally driven flow of urine helps the distribution of heat across the entire bladder [Citation19–21]. However, unlike regional hyperthermia where the whole organ undergoes temperature elevation, heating during GNR-assisted PTT is localized to the region of tumor targeted by the laser beam. As such, the role of natural convection during GNR-assisted PTT may be different from that of regional hyperthermia.
Motivated by this, the present study seeks to develop numerical models of mouse bladder to investigate the role of natural convection during bladder cancer treatment with GNR-assisted PTT. The focus on mouse bladder is deliberate since majority of the experimental studies on GNR-assisted PTT at the tissue level were carried out in mice [Citation10,Citation12,Citation13]. As such, the results obtained from the present study may contribute directly to the ongoing development of the treatment. Different bladder orientations due to the different positions of the mouse during treatment, such as laying on its abdomen, on its back, and on its side, are investigated. Since the different positions of the mouse during treatment also affect the flow of air around the skin, the present study takes into account the thermally-induced air flow and its impact on bladder cancer treatment using GNR-assisted PTT. For each orientation, the effects of different GNR volume fraction and laser power on the treatment outcome are examined. The role of natural convection is determined by monitoring the temperature distribution and the formation of thermal damage during the treatment.
2. Theory and methods
2.1. Model geometry
The model of mouse bladder was constructed based on dimensions obtained through visual examination of the photographic images reported by Reis et al. [Citation22]. The bladder was modeled as an ovoid with dimensions shown in with a uniform thickness of 0.35 mm [Citation23]. It was assumed to be filled with urine at the time of treatment. The bladder model has a volume of 0.1 ml, which is similar to the actual bladder capacity in mice [Citation22]. The tissues surrounding the bladder were modeled as an anatomically homogeneous cuboid of 16 mm width (x-direction), 5.7 height (y-direction), and 10 mm depth (z-direction). The distance from the top surface of the bladder to the skin is approximately 1.2 mm, which is within the range of mouse skin thickness [Citation24]. The natural convection above the skin is modeled using a cuboid with the following dimensions: 16 × 4.05 × 10 mm3.
Figure 1. Geometry of the mouse bladder and the three orientations investigated. (a) The 3D computational domain developed in the present study. The bladder is shown in cyan, while the tumor is shown in red. (b) View of the computational model across the z = 0 plane. The cyan domain represents the urine. (c) The three different bladder orientations considered in the present study with respect to direction of gravity and laser irradiation. All dimensions are in mm.
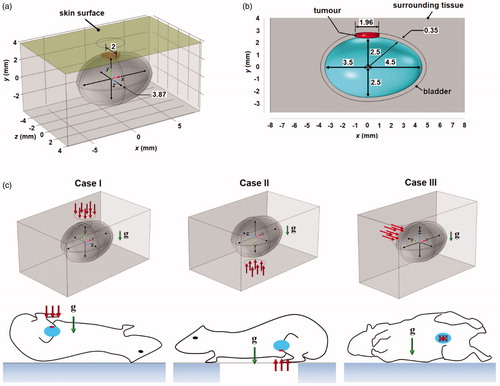
The 3 D model used is shown in . A tumor with dimensions of 1.96 and 2 mm in the x- and z-directions, respectively, and with a thickness equivalent to that of the bladder was assumed to grow at the top side of the bladder. This is shown in . The resulting volume of the tumor domain was 0.991 mm3. A continuous wave laser with a flat top beam profile of radius 3 mm irradiates the skin surface along the centerline of the bladder.
The effects of natural convection during GNR-assisted PTT were investigated for three cases that differ by the bladder orientation. The first case (Case I) has the mouse laying on its back. The second case (Case II) has the mouse laying on its abdomen. The third case (Case III) has the mouse laying on its side. These different bladder orientations are illustrated in . A fourth case (Case IV), which represented the model without natural convection (orientation-independent), was also considered.
2.2. Monte Carlo simulations
In this study, the Monte Carlo method, considered to be the benchmark algorithm for simulating light propagation in biological tissues [Citation25], was used to simulate the tissue optical response during laser irradiation. Details on the implementation of the Monte Carlo algorithm are presented briefly as the implementation has been reported elsewhere [Citation26]. In a typical Monte Carlo algorithm, packets of photons representing the laser beam propagate into the computational domain. Physical processes such as absorption, scattering, transmission, and reflection of the photons at the boundaries and interfaces are described as probability distributions. Typically, millions of photons are used in the algorithm in order to produce an accurate representation of light propagation inside the tissue.
In this study, the Monte Carlo simulations were carried out using ValoMC, an open source mesh-based Monte Carlo algorithm (https://inverselight.github.io/ValoMC/) [Citation27]. With ValoMC, the simulation geometry can be defined using unstructured mesh (triangles in 2D and tetrahedrons in 3D). This allows for a straightforward transfer of information obtained from the Monte Carlo simulations to the finite element heat transfer simulations (see Section Heat transfer model). In order to carry out the Monte Carlo simulations using ValoMC, the algorithm requires four inputs, namely the absorption coefficient (µa), the scattering coefficient (µs), the scattering anisotropic factor (g), and the refractive index (n), for each domain of the computational model. The algorithm provides the spatial distribution of light fluence, which is used to calculate the amount of heat generated inside the tissue due to laser energy absorption.
2.3. Heat transfer model
Heat transfer inside the tumor, the bladder and the surrounding tissue was described using the Pennes bioheat equation [Citation28,Citation29]:
(1)
(1)
where
is temperature,
is time,
and
are density, specific heat and thermal conductivity, respectively,
is blood perfusion rate,
is temperature of the arterial blood that is assumed to be at body temperature of 37 °C,
is tissue metabolic heat generation,
is optical absorption coefficient,
is the light fluence distribution obtained from the Monte Carlo simulations and
is laser power. The subscripts ‘
’ and ‘
’ represent tissue and blood, respectively. In EquationEquation (1)
(1)
(1) , the second and third terms on the right-hand side represent the contributions due to blood flow and tissue metabolism, respectively.
Heat transfer inside the urine and bladder was described using:
(2)
(2)
where u = (u, v, w) is the vector describing the velocity of fluid flow in bladder and air in the x-, y-, and z-directions, and the subscript ‘
’ represents either the urine or the air. In the air domain, the last term on the right-hand-side of EquationEquation (2)
(2)
(2) was set to zero.
By assuming the flow to be laminar, urine and air to be Newtonian fluids, and ignoring viscous dissipation effects, the velocity vector u in EquationEquation (2)(2)
(2) can be obtained from solving the Navier-Stokes equations:
(3)
(3)
(4)
(4)
where ρf and
are the density and dynamic viscosity, respectively, of urine and air,
is pressure and g is a vector representing gravitational acceleration. The last term on the right-hand side EquationEquation (3)
(3)
(3) represents the thermally induced buoyant forces causing convective flow, which can be described by the Boussinesq approximation:
(5)
(5)
where
is the fluid thermal expansion coefficient and
is the reference density evaluated at reference temperature
which in the present study, is equal to body temperature in the urine domain and equal to ambient temperature in the air. EquationEquation (5)
(5)
(5) shows a decrease in urine density of ∼11 kgm−3 when temperature increases from 37 °C to 70 °C (see Section Results).
2.4. Thermal damage model
The formation of thermal coagulation inside both healthy and tumor tissues were described using the thermal damage model of Henriques and Moritz [Citation30]. The model assumes damage to biological tissues due to heat is similar to thermal denaturation, which follows the first-order approximation of the Arrhenius equation. The rate of the thermal denaturation process is given by:
(6)
(6)
where
is a dimensionless parameter that describes thermal damage of healthy and tumor tissues at a given point in space (
) and time,
is frequency factor,
is the activation energy for irreversible thermal denaturation, and
is the universal gas constant.
Once EquationEquation (6)(6)
(6) is solved at all the given points in space, the probability of observing thermal damage,
can be estimated using:
(7)
(7)
According to EquationEquation (7)(7)
(7) , values of
= 0.7, 1.1, and 4.6 would yield a probability of observing thermal damage at a given point inside the tissue of 50, 67, and 99%, respectively. In the present study, it was assumed that all the points within the tumor must have values of
above 99%, which is equivalent to
> 4.6, in order to eradicate the tumor.
2.5. Initial-boundary conditions
Since the timescale for light propagation was assumed to be much smaller than the timescale for heat transfer, steady state Monte Carlo simulations were employed. The initial temperature and flow profile inside the bladder were obtained by solving EquationEquations (1)–(5)(1)
(1) at steady-state, i.e., by setting the time derivative term in the left-hand side of EquationEquations (1)–(3)
(1)
(1) to be zero and by letting
=
= 0, where the latter specifies the condition prior to laser irradiation.
An open thermal boundary condition was applied to the surfaces bounding the air domain (except for the solid surface in Case III, see ):
(8)
(8)
where
is ambient temperature set in this study to 20 °C. EquationEquation (8)
(8)
(8) assumes the surfaces of the bounding air domain to be at ambient temperature if air flows into the domain and to have a zero heat flux if air flows out of the domain. In Case III, zero heat flux condition was prescribed at the surface on which the mouse was placed (see ). The surface at the opposite side of the skin surface was assumed to be sufficiently far from the laser focal zone such that normo-thermoregulation can maintain the temperature at basal level. Therefore, the boundary condition here is given by:
(9)
(9)
For the hydrodynamic model, open boundary condition that allows air to flow in and out of the domain was prescribed across the surfaces that bound the air domain except for the solid surface representing the solid side on which the mouse lay in Case III (see above). Across the solid surface (in Case III) and the inner surfaces of the bladder, the no slip boundary condition was prescribed, such that:
(10)
(10)
2.6. Material properties
2.6.1. Thermal properties
The thermal properties employed in this study are listed in . Except for the tumor domain, the values presented in were obtained from IT’IS database [Citation31]. As there was lack of information on the thermal properties of bladder cancer, thermal properties of liver cancer, which are available in the literature, were used.
Table 1. Thermal properties employed in this study.
Except for thermal conductivity and blood perfusion rate, all other thermal properties employed in the model were assumed to be constant and homogeneous. The thermal conductivity was assumed to increase linearly with temperature at a rate of 1.5% per °C [Citation38]. This assumption was applied to all the domains including the urine.
Studies carried out on porcine kidneys have demonstrated a nonlinear variation in blood perfusion with temperature [Citation33]. At temperatures below 45 °C, tissue responds to temperature rise by increasing blood flow through vasodilation [Citation39]. As temperature continues to increase, blood vessels begin to lose their caliber and vascular stasis starts to occur, thus leading to a decrease in blood perfusion. Cessation of blood flow occurs when complete thermal damage is sustained by the tissue. This temperature-dependent behavior of blood perfusion can be expressed as a piecewise homogeneous function of given by [Citation33,Citation40]:
where
represents the blood perfusion rate at body temperature.
In this study, EquationEquation (11)(1)
(1) was employed to describe the blood perfusion inside the bladder and the surrounding tissue, but not inside the tumor. This is due to the limited ability of tumor tissues to increase blood flow in response to hyperthermia [Citation39]. As an alternative, a step function given by:
(12)
(12)
was used to express the variation in tumor blood perfusion with thermal damage.
2.6.2. Optical properties
The absorption and scattering coefficients of the bladder and the surrounding tissue were obtained from the literature and they are listed in . The scattering anisotropic factors and the refractive indices of all tissues were chosen to be 0.9 and 1.4, respectively [Citation44]. For the urine, the absorption coefficient, scattering coefficient, and refractive index were assumed to be the same as those of water. The scattering anisotropic factor for the urine was chosen to be 1, implying that photons propagate inside the fluid domain but do not undergo scattering [Citation43].
Table 2. Optical parameters and the peak absorption and scattering coefficients for = 0.001, 0.005 and 0.01%.
The absorption and scattering coefficients of tumor with GNR were calculated using the Mie–Gans theory [Citation45], which solves the Maxwell equations based on an electrostatic assumption. This assumption is valid for ≤
/10, where
is the diameter of the GNR and
is the wavelength of the laser. Accordingly, the absorption and scattering coefficients of a medium embedded with GNR can be calculated using [Citation46,Citation47]:
(13)
(13)
and
(14)
(14)
where
represents the imaginary component,
is the volume fraction of GNR,
is the volume of a single nanoparticle calculated by assuming the GNR to be a cylinder capped by hemispheres at both ends and
(for
=1, 2, 3) is the polarization given by [Citation46,Citation47]:
(15)
(15)
where
is the size- and frequency-dependent dielectric function of the GNR,
is the dielectric constant of the surrounding medium and
is the geometrical factor. In the present study, the Kreibig–Vollmer model for calculating the size- and frequency-dependent dielectric function of GNR was adopted, which is given by [Citation47]:
(16)
(16)
where
is the frequency-dependent dielectric constant of bulk gold, and
and
are given by:
(17)
(17)
(18)
(18)
(19)
(19)
where
is the electron density number,
is permittivity of vacuum,
and
are the charge and mass of the electrons, respectively,
is Fermi velocity,
is the surface scattering parameter with an empirical value of 0.3,
is effective radius,
is the surface area of a single nanoparticle, and
is the free damping coefficient defined as the ratio of Fermi velocity and the mean free path of electrons, which for gold is 42 nm [Citation48]. The values of these constants are listed in . It is important to point out here that the EquationEquation (16)
(16)
(16) is expressed in terms of electron volts (eV). The dielectric constant of bulk gold was obtained from data published by Johnson and Christy [Citation49].
The Mie-Gans theory for calculating and
is valid only for spheroidal nanoparticles. In the present study, in order to evaluate
the coefficients for a quadratic fit were employed, which were derived by Prescott and Mulvaney [Citation50,Citation51]. The quadratic fit relates the geometrical factors and the diameter of the nanorods for spherically capped cylindrical nanorods with different radii. The detailed steps are presented in Appendix A.
2.7. Numerical implementation
A mesh convergence study was carried out to determine the optimum number of elements that yield numerical solutions that are independent of the mesh size. The steps carried out in the mesh convergence study are presented in Appendix B. The setting that resulted in 113,718 tetrahedral elements was found to produce mesh-independent results. This mesh was imported into ValoMC. Monte Carlo simulations were carried out by launching 10 million photons into the computational domain to obtain the fluence distribution across the entire model. Once the fluence distribution has been computed, it was imported into the commercial finite element software COMSOL Multiphysics, where heat transfer simulations were carried out. Boundary layer elements were created across the inner walls of the bladder to facilitate convergence of the fluid flow simulations. First-order approximations were used for both heat transfer and fluid flow simulations, while second-order approximations were employed when solving the thermal damage model.
3. Results
A model verification study was carried out to determine the accuracy of the developed numerical model. Details and the results from the model verification study are presented in Appendix C.
3.1. Optical coefficients
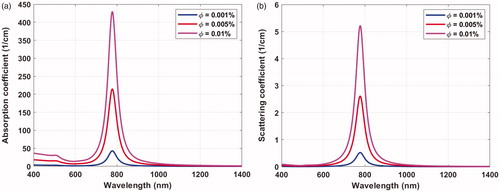
plots the absorption and scattering coefficients against the irradiation wavelength for a monodisperse GNR distribution with diameter and aspect ratio of 10 nm and 3.8, respectively, and volume fractions of 0.001, 0.005, and 0.01%. Peak absorbance occurred at 778 nm wavelength, which matched well the Discrete Dipole Approximation simulations and the experimental results recently reported [Citation52]. Increasing the volume fraction of the GNR led to larger absorption and scattering coefficients; however, the wavelength at peak absorbance was not affected. The absorption and scattering coefficients corresponding to peak absorbance for the different GNR volume fractions investigated are presented in . It is worth noting that the absorption coefficient of the GNR is a few orders of magnitude higher than the absorption coefficients of the bladder and surrounding tissue.
Figure 2. Plots of the (a) absorption and (b) scattering coefficients at different wavelengths calculated for ϕ = 0.001, 0.005 and 0.01%.
3.2. Fluence distribution
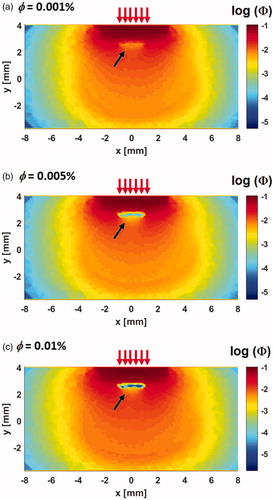
shows the fluence distribution across the z = 0 plane normalized against the laser power for GNR volume fractions of 0.001, 0.005, and 0.01%. The contours are presented in the logarithmic scale for better visualization. The incident irradiation is indicated by the red arrows. The strongly absorbing tumor domain due to the presence of GNR shows very low fluence distribution (see black arrows), which represents one of the distinct features of the contours shown in . As GNR volume fraction increases, the absorption coefficient also increases (see ), which results in greater photon absorption and an even lower fluence distribution.
Figure 3. Fluence distribution across the z = 0 plane. Simulation was performed for three GNR volume fractions (a) = 0.001%, (b)
= 0.005% and (c)
= 0.01%. The black arrows, indicating low fluence, point to the position of the tumor. An increase in volume fraction leads to lower fluence magnitude due to higher photon absorption.
3.3. Effects of natural convection
illustrates the contours of the temperature distribution across the z = 0 plane and the flow pattern inside the air domain obtained 10 min after the start laser irradiation. The temperature distribution inside the bladder is visualized using isothermal surfaces in order to show the flow-induced variation. The red arrows indicate the air flow in response to heating of the skin surface and the different orientations of the bladder. Regions of high temperatures were observed around the tumor and in the surrounding tissue immediately above the tumor. The maximum and minimum temperatures inside the tumor and the maximum temperature on the skin surface are presented in . Peak temperature was found at the surface of the skin, which may be explained by the shortest distance to the radiation source; hence the least attenuation.
Figure 4. Contours of the temperature distribution at x = 0 and z = 0 planes 10 min after laser exposure. (a) Case I, (b) Case II, (c) Case III, and (d) Case IV. The temperature distribution inside the bladder is visualized using isothermal surfaces in order to show the flow-induced variation. Results were obtained for = 0.001% and
= 0.2 W. The yellow arrows show the direction of gravity and the red arrows show the flow field. Figures indicate significant changes in the isotherms inside the bladder due to natural convection under different bladder orientation.
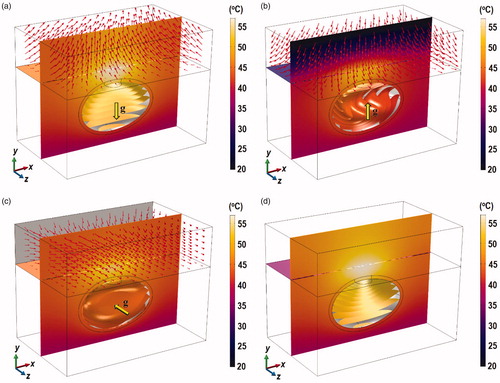
Table 3. Results for the different configurations for = 0.001% and Plaser = 0.2 W .
The different air flow pattern due to the different bladder orientation was found to affect the degree of convective heat transfer from skin surface to the ambient. From , in can be seen that Case II produced the smallest maximum tumor and skin surface temperature. As shown in , gravity in Case II acts in the +y direction. As the skin temperature rises due to laser irradiation, the temperature of air next to the skin surface also increases. Boussinesq approximation states that warm fluid rises due to its lower density, while cold and denser fluid descends. Hence, warm air flows in opposite direction to gravity (−y direction) and impinges on the surface of the skin. The air stream gets diverted across the xz plane, while air at ambient temperature is drawn to the skin surface. This was not observed in Case I because air rises away from the skin surface (see ), while in Case II, the solid surface prevented cool air to be drawn across the skin surface (see ).
The effects of natural convection of the urine are better understood if one compares the average temperature gradients inside the bladder. A lower temperature gradient implies a more homogeneous temperature distribution inside the bladder, which from the point of view of GNR-assisted PTT, may be disadvantageous. A homogeneous temperature distribution indicates that heat, which is supposed to be concentrated around the tumor region, is dissipated into other regions of the bladder. The average temperature gradient magnitude inside the bladder in Case I was 18.07 °C/cm, which was not significantly different from Case IV (18.55 °C/cm). Case II had the lowest temperature gradient magnitude of 10.59 °C/cm, while Case III, it was 13.06 °C/cm. These results suggest that the ability for natural convection to produce a more homogeneous temperature distribution inside the bladder during GNR-assisted PTT is dependent on the orientation of the bladder. The heating heterogeneity is further evaluated by quantifying the heterogeneity coefficient which is defined as [Citation53]:
(20)
(20)
where 10 or 90% of all calculated temperatures at the mesh points are greater or equal to
and
respectively, and
is the initial temperature of 37 °C. A larger value of
implies a more heterogenous system. Values of
obtained from EquationEquation (20)
(20)
(20) are summarized in . The
value of Case I is approximately 1.52 and 1.1 times that of Cases II and III, respectively, which supports the analysis above.
illustrates the iso-surfaces of the velocity magnitude (for z < 0) and the velocity vector of the thermally driven urine flow inside the bladder at t = 10, 20, 30, 60, and 600 s. During treatment, the urine that is next to the tumor is warmer than in the other regions due to absorption of heat inside the tumor. In Case I, the direction of gravity in -y meant that the warmer fluid that is already at the top of the bladder can only move sideways and downwards, which created two vortices that circulate at either side of the bladder. In Case II, gravity acts in the +y-direction. During the initial stages of heating (see t = 10 s in ), the warmer fluid next to the tumor moves in the direction opposite to gravity. As the fluid reaches the opposite wall of the bladder, the flow is diverted sideways and upwards to create two vortices (see t = 20 and 30 s). The asymmetrical shape of the bladder between the x > 0 and x < 0 region led to vortex in the x > 0 region to be larger than that in the x < 0 region. As heating continues, the weaker vortex is integrated into the stronger vortex that ultimately resulted in one large vortex in the counter-clockwise direction around the z-axis. In Case III, the direction of gravity along the z-axis meant that the warmer fluid flows in the +z-direction to generate a clockwise vortex around the x-axis.
Figure 5. Contours of the velocity magnitude in mm/s and the velocity vector inside the bladder plotted for z < 0 at t = 10, 20, 30, 60, and 600 s. (a) Case I, (b) Case II, and (c) Case III.
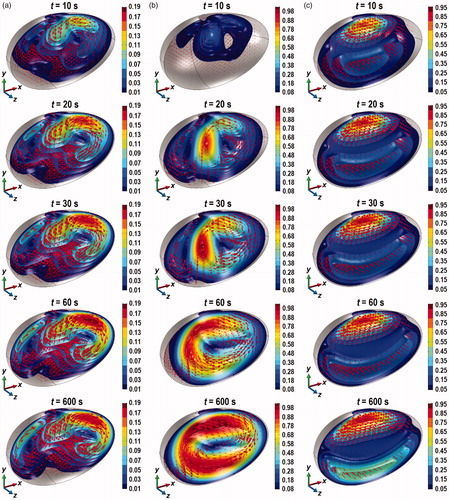
The velocity magnitude in Case I was the lowest, which explains the high urine domain temperature (see ) and the large values of (see ). In Cases II and III, the maximum velocity magnitude was approximately 5 times larger than in Case I, which explains the lower and near homogeneous temperature inside the bladder for these two cases. The increase in the velocity magnitude found in Cases II and III reflect an increase in convective heat transfer compared to Case I. This can be seen in when one compares the average convective heat flux inside the bladder between Cases I, II, and III. As expected, the average convective heat flux in Case II was the highest, followed by Cases III and I.
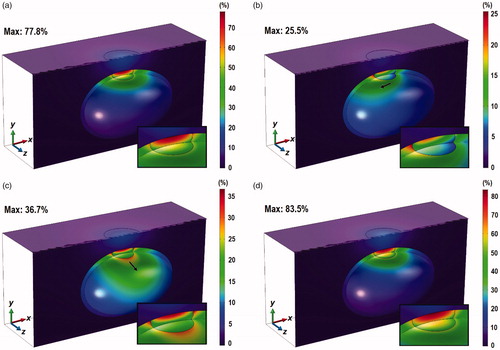
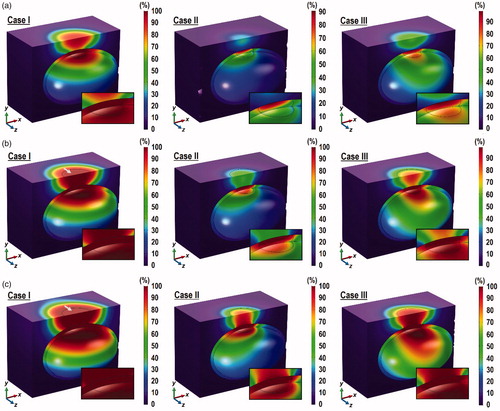
Contours depicting the probability of thermal damage, PD, across the z = 0 and x = 0 planes, and across the inner surface of the bladder 10 min after laser irradiation are shown in . Cooling due to natural convection inside the bladder led to smaller values of PD inside the tumor. Case I, which has the weakest cooling effect, produced the highest probability of observing thermal damage, with the highest value of 77.8%. In Cases II and III, the highest values of PD were 25 and 36.7%, respectively. Additionally, there was a shift in the distribution of PD in these two cases in the direction of the vortex flow, as indicated by the black arrows in . In all the cases considered, the targeted PD > 99% thermal damage across the entire tumor domain was not attained.
Figure 6. Contours of PD across the tumor, the bladder and the surrounding tissue at the z = 0 plane, the skin surface (for z < 0) and the inner wall of the bladder, 10 min after the start of laser irradiation. (a) Case I, (b) Case II, (c) Case III, and (d) Case IV, for ϕ = 0.001% and laser power of 0.2 W. Inset: enlarged view of the tumor and the tissue above it.
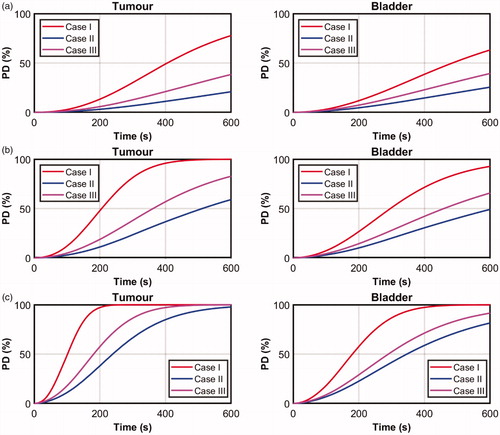
plots the transient variation of the maximum PD values inside the tumor and the bladder. The higher PD in Case I due to the weaker convective heat transfer is clearly demonstrated. Similarly, the highest average convective heat flux (see ) produced the lowest PD values. This suggests different orientations of the bladder can produce different magnitudes of convective heat transfer; some that are sufficiently strong to limit the formation of thermal damage during GNR-assisted PTT of bladder cancer in mice.
Figure 7. Plots of maximum PD values against time inside the tumor and the bladder for (a) = 0.001%, (b)
= 0.005% and (c)
= 0.01% for
= 0.2 W.
3.4. Effects of GNR volume fraction
The failure to obtain PD > 99% across the entire tumor may be overcome by increasing the amount of heat generated inside the tumor. One way this may be achieved is by increasing the volume fraction of GNR embedded inside the tumor. Simulations were repeated for = 0.005 and 0.01%, with the values of all other parameters maintained to be the same as those used in Section 3.3. As shown in , increasing the value of
resulted in significant elevations in the absorption and scattering coefficients, with the former contributing to larger heat generation during laser irradiation. The temperature distribution and the flow profile inside the bladder and in the air domain (results not presented here) were found to be very similar to those presented in and , with the exception of higher temperature and larger velocity magnitude as a result of the increase in the heat generated inside the tissue.
Contours of PD obtained for = 0.005% are presented in . As expected, increasing the value of
led to greater thermal damage inside the tumor. At
= 0.005%, the highest PD approached 99.9% in Case I, while the highest PD for Cases II and III were 59.0 and 80.5%, respectively, which were more than doubled compared to the case with
= 0.001%. Although there was a clear elevation in the values of PD, the targeted PD > 99% across the entire tumor domain was not achieved. In Case I, the threshold of PD > 99% was observed only at the top half of the tumor, while the bottom half remained below 80%.
Figure 8. Contours of PD across the tumor, the bladder and the surrounding tissue across the z = 0 plane, the skin surface (for z < 0) and the inner wall of the bladder after 10 min of 0.2 W laser irradiation. (a) ϕ = 0.005% and (b) ϕ = 0.01%. Inset: enlarged view of the tumor and the tissue above it.
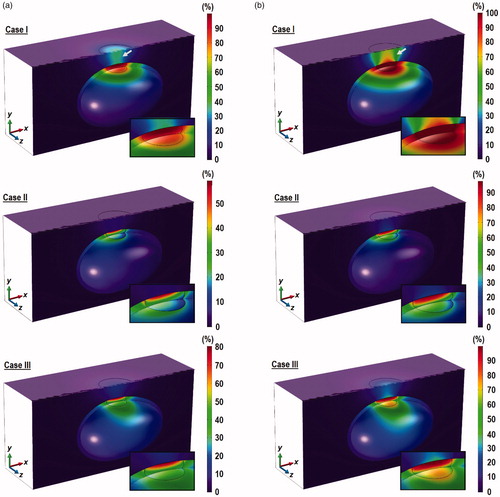
The distribution of PD obtained for = 0.01% are presented in , where complete tumor damage was found for Case I, as indicated by PD > 99% across the entire tumor domain. Although Case III showed values of PD that approached 99%, these were restricted to only the top half of the tumor. The maximum PD value in Case II was the lowest at 97.5% and was concentrated only at the top surface of the tumor. It is noteworthy that the increase in tumor thermal damage due to the increase in
was also accompanied by increases in the damage to the bladder and the surrounding tissue, especially for Case I. This is indicated by the white arrows in . The role of natural convection inside the bladder in the dispersion of heat from the ablated region is further demonstrated by the low PD values in the surrounding tissue for Cases II and III.
plot the transient variation in maximum PD for the tumor and bladder for Cases I–III obtained for = 0.005% and 0.01%, respectively. As heating increases due to larger
values, PD also increases in both the tumor and the bladder. Unlike the case when
= 0.001% (see ), the values of maximum PD in the bladder were not as high as in the tumor. In this case, cooling due to convective heat transfer may have been insufficient to transfer the intense heat, due to the higher GNR concentrations, from the targeted region to the adjacent bladder tissue.
3.5. Effects of laser power
In addition to GNR volume fraction, the heat generated inside the tissue may be elevated by increasing the laser power. To investigate the effects of laser power on thermal damage sustained by tumor, was increased to 0.3 W and simulations were repeated for
= 0.001, 0.005, and 0.01%. The temperature distribution and velocity profiles obtained were similar to those presented in and , apart for their higher magnitudes. Hence, these results are not presented here.
Contours of PD are shown in for = 0.3 W. The results show significantly larger thermal damage inside the tumor in all cases. The threshold of PD > 99% across the entire tumor was achieved for Case I even at
= 0.001%, while Cases II and III failed to achieve the target. The target was attained in Cases I and III at
= 0.005, while Case II was not far off. At
= 0.01%, it would appear that all cases achieved the target of PD > 99% across the entire tumor domain. The combination of high laser power and GNR volume fraction produced very intense heating, such that significant portion of the bladder in Case I experienced thermal damage (PD > 99%) due to the weak convection inside the bladder. Similar effects were observed in Case III with
= 0.005 and 0.01%. On the other hand, such damage to the bladder was not found in Case II likely due to the strong convective heat transfer inside the bladder. It is important to note that the attainment of PD > 99% across the entire tumor may not be clinically acceptable if the nearby bladder tissue is also compromised.
Figure 9. Contours of PD across the tumor, the bladder and the surrounding tissue at the z = 0 plane, the skin surface (for z < 0) and the inner wall of the bladder after 10 min of 0.3 W laser irradiation. (a) ϕ = 0.001%, (b) ϕ = 0.005% and (c) ϕ = 0.01. Inset: enlarged view of the tumor and the tissue above it.
Significant amount of thermal damage was also found in the surrounding tissue above the tumor and on the skin surface in Case I for all the values of and in Case III for
= 0.01%. However, such damage to the surrounding tissue and the skin surface was not observed in Case II regardless of the GNR volume fraction. This may be explained not only by the strong convective heat transfer inside the bladder, but also by the larger cooling induced by the air flow on the skin side, as explained in Section 3.3.
3.6. Sustained thermal damage inside the tumor, bladder, and surrounding tissues
The contours of PD presented in the preceding sections describe the probability of observing thermal damage and their visual examinations provide a qualitative indication on the distribution of thermal insult across the tissue. In order to quantify the amount of sustained thermal damage in each tissue region, the following parameters were introduced:
and
which represent the ratio of volume of thermal damage sustained by the tumor, bladder, and surrounding tissues relative to their total volume. These parameters are defined as:
(21)
(21)
(22)
(22)
(23)
(23)
where
and
are, respectively, the volumes of tumor, the bladder and the surrounding healthy tissues that have been thermally destroyed, i.e., PD > 99% (see Section 2.4), and
and
are the total volume of the tumor, bladder and surrounding healthy tissues, respectively. A value of R = 1 implies that the whole tissue is thermally destroyed, while a value of R = 0 implies that there is no sustained thermal damage inside the tissue. An optimum treatment should ideally maximize
while minimizing
and
Values of
and
calculated using EquationEquations (21)–(23)
(1)
(1) are presented in . When using a laser power of 0.2 W, complete ablation of the tumor (RT = 1) can be attained only for Case I for
= 0.01%, with a 0.1% damage to the bladder (RB = 0.001). When using a laser power of 0.3 W, complete tumor ablation was attained at all GNR volume fractions for Case I and at
= 0.01% for Case III. However, these outcomes may not be acceptable due to the increase in the amount of damage sustained by the bladder and the surrounding tissue.
Table 4. Values of
and
obtained for Cases I, II, and III for different laser power and GNR volume fraction.
For Case III, only the combination of = 0.3 W and
= 0.01% produced complete tumor ablation None of the combination of laser power and GNR volume fraction led to complete tumor ablation for Cases II; clearly indicating the significance of orientation on the cooling induced by natural convection inside the bladder.
4. Discussions
Natural convection inside the bladder during GNR-assisted PTT of bladder cancer in mice was found to produce cooling effect that can affect the outcome of the treatment. The degree of cooling was found to depend on the orientation of the bladder with respect to the laser beam and gravitational field. Placing the mouse on its back, as shown for Case I in , minimizes the cooling effect, while having the mouse on its abdomen, as shown for Case II in , maximizes it. Initially, there were concerns on whether the localized heating of GNR-assisted PTT is sufficiently powerful to produce any meaningful urine circulation inside the bladder. The results obtained indicated that for the case of mice, the effects of natural convection cannot be ignored. This suggests that future experiment in mice of GNR-assisted PTT for bladder cancer treatment of mice must take into consideration the cooling effects due to natural convection inside the bladder.
Depending on the orientation, cooling induced by natural convection inside the bladder can be both detrimental and beneficial to the outcome of bladder cancer treatment. Since heating during GNR-assisted PTT is localized to the targeted tissue, natural convection can be detrimental by distributing heat to other parts of the bladder. This not only causes insufficient heating to the targeted tumor tissue, as can be seen in for Cases II and III, but also raises the temperature of the bladder and the surrounding tissue to levels that may be sufficiently high to induce some degree of thermal damage (see ). On the other hand, in cases where heating is intensive, either due to the selection of large GNR volume fraction or the use of high-powered laser, natural convection can help to reduce the temperature rise in bladder and surrounding tissues in order to minimize the thermal damage to healthy tissue. Achieving a balance between the detrimental and beneficial effects of natural convection during GNR-assisted PTT of bladder cancer is a matter that is worthy of future investigations.
Different orientation of the bladder also affects the degree of convection heat transfer between the air and the skin surface. It was found that the flow pattern of air generated when the mouse is oriented as in Case II, i.e., when laying on its abdomen, resembles that of an impinging jet, which induces stronger cooling effect than those generated by the air flow in Cases I and III. The ability to cool the skin surface is seen as beneficial as it helps to prevent the risk of over-heating that may arise from the use of larger GNR volume fraction or higher laser power. Unfortunately, this orientation also led to strong convective currents inside the bladder that render the treatment ineffective due to the failure in attaining complete tumor ablation.
The findings obtained from the present study may be used to identify an optimal combination of parameters and treatment orientation for the GNR-assisted PTT of bladder cancer in mice. Based on the data in , the combination of = 0.01% and
= 0.2 W with the mouse laying on its back (Case I) is deemed to be optimum as it ensures complete tumor ablation, while minimizing damage to the non-cancerous tissues. In a clinical setting, the orientation pertaining to Case I is akin to the patient in the more natural state of laying down. It is noteworthy that this study does not consider the feasibility of GNR volume fraction (cost, safety etc) in real applications. Should the situation prevent the use of 0.01% GNR volume fraction, then the combination of
= 0.001% and
= 0.3 W a with Case I orientation can be used, though with a slightly higher to the bladder.
It is important to note that the conclusions drawn in the present study were based on investigations in mice. As such, caution must be exercised when interpreting and translating the results from the present study to human patients. The differences in both the size and the shape of human and mouse bladders mean that the effect of natural convection in GNR-assisted PTT of bladder cancer may not scale linearly from mice to humans. If the laser beam diameter remains the same, cooling due to natural convection inside larger bladders, i.e., human bladders, may be more localized and not as significant as in mice bladders. Nevertheless, computational studies remain an integral part of the development of GNR-assisted PTT, particularly at the present stage, where the majority of the experimental studies were carried out in mice [Citation10,Citation12,Citation13].
The two methods considered in this study for overcoming the incomplete tumor destruction due to cooling from natural convection were by increasing the volume fraction of GNR inside the tumor and by increasing the laser power. The former increases the amount of heat generated inside the tumor by increasing the absorption coefficient, while the latter employs a higher intensity laser beam into the tissue. The thermal responses observed were very different for the two methods. Increasing the GNR volume fraction increases the absorption coefficient inside the tumor. Therefore, the tumor experiences higher heat generation and temperature elevation during laser irradiation. The increase in temperature and thermal damage to the bladder and the surrounding tissue were due to conduction of heat from the tumor. Increasing the laser power results in higher energy absorption and heat generation inside the tissue. Since the laser beam is introduced as an external source, the photons will have to travel through the surrounding tissue before arriving at the tumor. The absorption of the photons by the surrounding tissue results in significant elevation in temperature that could lead to severe thermal damage where it is not intended. These results suggest that it may be more acceptable to increase the GNR volume fraction than to increase the laser power when attempting to increase the amount of thermal damage inside the tumor.
The present study identifies some limitations that need to be addressed in future investigations. Firstly, the tumor was assumed to have the same thickness as the bladder, which represents bladder cancer that is at an advanced stage. These cases may be better treated through transurethral resection of bladder tumor [Citation54] or cystectomy [Citation55], although both options are invasive. Secondly, the present study has assumed a spatially homogeneous distribution of GNR. The distribution of GNR is likely to be heterogeneous and the actual distribution will depend on the method employed for introducing the GNR into the tumor. Thirdly, the dimensions of the GNR for a given population are likely to vary over a range instead of being uniform in size. In such cases, one may have to assume a polydisperse distribution of GNR when evaluating the absorption and scattering coefficients using the Mie-Gans theory. Nevertheless, the effects of a polydisperse GNR distribution is expected to affect only the absorption and scattering coefficients, whose effects were investigated in the current study by varying the GNR volume fraction. As such, the use of polydisperse GNR distribution may lead to outcomes that are similar to those found in this study. Finally, conclusions in the present study are based on investigations in mice. While the results obtained are informative, they may not translate well to humans due to differences in anatomy.
5. Conclusions
The present study has demonstrated the effects of natural convection inside the bladder during GNR-assisted PTT of bladder cancer in mice. Although heating is localized, the thermal gradient produced is sufficiently high to induce convective flow inside the bladder causing additional cooling during treatment. The cooling effect can be both favorable and unfavorable, depending on the required level of heating inside the tissue during treatment. The degree of cooling was also found to depend on the orientation of the bladder. Different treatment orientations were found to affect the heat transfer between the skin surface and the surrounding air. The orientation corresponding to the mouse laying on its abdomen induced the strongest cooling between the skin surface and the air, which prevented the formation of thermal damage on the skin, especially when higher laser power was employed. Investigations were also carried out to determine the role of GNR volume fraction and laser power on the level of thermal damage inside the tumor. Increasing the laser power was found to be less favorable due to the extensive thermal damage to the tissue through which the laser beam travels before reaching the tumor.
Disclosure statement
No potential conflict of interest was reported by the author(s).
.
Additional information
Funding
References
- Zou L, Wang H, He B, et al. Current approaches of photothermal therapy in treating cancer metastasis with nanotherapeutics. Theranostics. 2016;6(6):762–772.
- Chen H, Shao L, Li Q, et al. Gold nanorods and their plasmonic properties. Chem Soc Rev. 2013;42(7):2679–2724.
- Smith AM, Mancini MC, Nie S. Bioimaging: second window for in vivo imaging. Nat Nanotechnol. 2009;4(11):710–711.
- Antoni S, Ferlay J, Soerjomataram I, et al. Bladder cancer incidence and mortality: a global overview and recent trends. Eur Urol. 2017;71(1):96–108.
- Wong MCS, Fung FDH, Leung C, et al. The global epidemiology of bladder cancer: a joint point regression analysis of its incidence and mortality trends and projection. Sci Rep. 2018;8(1):1129.
- Mar N, Dayyani F. Management of urothelial bladder cancer in clinical practice: real-world answers to difficult questions. J Oncol Pract. 2019;15(8):421–428.
- Chen CH, Wu YJ, Chen JJ. Gold nanotheranostics: photothermal therapy and imaging of mucin conjugated antibody nanoparticles for urothelial cancer. Biomed Res Int. 2015; (2015):813632.
- Chen CH, Chan TM, Wu YJ, et al. Review: application of nanoparticles in urothelial cancer of the urinary bladder. J Med Biol Eng. 2015;35(4):419–427.
- Chen CH, Wu YJ, Chen JJ. Photo-thermal therapy of bladder cancer with anti-EGFR antibody conjugated gold nanoparticles. Front Biosci (Landmark Ed)). 2016;21:1211–1222.
- Cho SK, Emoto K, Su LJ, et al. Functionalized gold nanorods for thermal ablation treatment of bladder cancer. J Biomed Nanotechnol. 2014;10(7):1267–1276.
- Yang X, Su LJ, Rosa FGL, et al. The antineoplastic activity of photothermal ablative therapy with targeted gold nanorods in an orthotopic urinary bladder cancer model. BLC. 2017;3(3):201–210.
- Maksimova IL, Akchurin GG, Khlebtsov B, et al. Near-infrared laser photothermal therapy of cancer by using gold nanoparticles: computer simulations and experiment. Med Laser Appl. 2007;22(3):199–206.
- von Maltzahn G, Park JH, Agarwal A, et al. Computationally guided photothermal tumor therapy using long-circulating gold nanorod antennas. Cancer Res. 2009;69(9):3892–3900.
- Soni S, Tyagi H, Taylor RA, et al. Role of optical coefficients and healthy tissue-sparing characteristics in gold nanorod-assisted thermal therapy . Int J Hyperthermia. 2013;29(1):87–97.
- Soni S, Tyagi H, Taylor RA, et al. Investigation on nanoparticle distribution for thermal ablation of a tumour subjected to nanoparticle assisted thermal therapy. J Therm Biol. 2014;43:70–80.
- Singh R, Das K, Mishra SC. Laser-induced hyperthermia of nanoshell mediated vascularized tissue-a numerical study. J Therm Biol. 2014;44:55–62.
- Jeynes JCG, Wordingham F, Moran LJ, et al. Monte Carlo simulations of heat deposition during photothermal skin cancer therapy using nanoparticles. Biomolecules. 2019;9(8):343.
- Manuchehrabadi N, Zhu L. Development of a computational simulation tool to design a protocol for treating prostate tumours using transurethral laser photothermal therapy. Int J Hyperthermia. 2014;30(6):349–361.
- Yuan Y, Cheng KS, Craciunescu OI, et al. Utility of treatment planning for thermochemotherapy treatment of nonmuscle invasive bladder carcinoma. Med Phys. 2012;39(3):1170–1181.
- Schooneveldt G, Bakker A, Balidemaj E, et al. Thermal dosimetry for bladder hyperthermia treatment. An overview. Int J Hyperthermia. 2016;32(4):417–433.
- Schooneveldt G, Kok HP, Balidemaj E, et al. Improving hyperthermia treatment planning for the pelvis by accurate fluid modeling. Med Phys. 2016;43(10):5442–5452.
- Reis LO, Sopena JMG, Favaro WJ, et al. Anatomical features of the urethra and urinary bladder catheterization in female mice and rats. An essential translational tool. Acta Cir Bras. 2011;26(suppl 2):106–110.
- Leiria LOS, Monica FZT, Carvalho FDGF, et al. Functional, morphological and molecular characterization of bladder dysfunction in streptozotocin-induced diabetic mice: evidence of a role for L-type voltage-operated Ca2+ channels. Br J Pharmacol. 2011;163(6):1276–1288.
- Takeuchi H, Ishida M, Furuya A, et al. Influence of skin thickness on the in vitro permeabilities of drugs through Sprague-Dawley rat or Yucatan micropig skin. Biol Pharm Bull. 2012;35(2):192–202.
- Prahl SA. A Monte Carlo model of light propagation in tissue. In: Mueller GJ, Sliney DH, Potter RF, editors. Dosimetry of laser radiation in medicine and biology, vol. 10305. International Society for Optics and Photonics, Berlin Germany: SPIE, 102–111; 1989.
- Jacques SL. Monte Carlo modeling of light transport in tissue (steady state and time of flight). In: Welch AJ, van Gemert MJC, editors. Optical thermal response of laser. New York: Springer; 2011. p. 109–144.
- Leino AA, Pulkkinen A, Tarvainen T. ValoMC: a Monte Carlo software and MATLAB toolbox for simulating light transport in biological tissue. OSA Continuum. 2019;2(3):957–972.
- Pennes HH. Analysis of tissue and arterial blood temperatures in the resting human forearm. J Appl Physiol. 1948;1(2):93–122.
- Wissler EH. Pennes' 1948 paper revisited. J Appl Physiol. 1998;85(1):35–41.
- Henriques FC, Moritz AR. Studies of thermal injury: I. the conduction of heat to and through skin and the temperatures attained therein. A theoretical and an experimental investigation. Am J Pathol. 1947;23:530549.
- Hasgall PA, Gennaro FD, Baumgartner C, et al. ITIS Database for thermal and electromagnetic parameters of biological tissues; [cited 2018]. Available from: itis.swiss/database.
- Dimitriou NM, Pavlopoulou A, Tremi I, et al. Prediction of gold nanoparticle and microwave-induced hyperthermia effects on tumor control via a simulation approach. Nanomaterials. 2019;9(2):167.
- He X, McGee S, Coad JE, et al. Investigation of the thermal and tissue injury behaviour in microwave thermal therapy using a porcine kidney model. Int J Hyperthermia. 2004;20(6):567–593.
- He X, Bhowmick S, Bischof JC. Thermal therapy in urologic systems: a comparison of Arrhenius and thermal isoeffective dose models in predicting hyperthermic injury. J Biomech Eng . 2009;131(7):074507.
- Pearce J. Mathematical models of laser-induced tissue thermal damage. Int J Hyperthermia. 2011;27(8):741–750.
- Wright NT. On a relationship between the Arrhenius parameters from thermal damage studies. J Biomech Eng. 2003;125(2):300–304.
- Ooi EH, Ng EYK. Simulation of aqueous humor hydrodynamics in human eye heat transfer. Comput Biol Med. 2008;38(2):252–262.
- Trujillo M, Berjano E. Review of the mathematical functions used to model the temperature dependence of electrical and thermal conductivities of biological tissue in radiofrequency ablation. Int J Hyperthermia. 2013;29(6):590–597.
- Rossmann C, Haemmerich D. Review of temperature dependence of thermal properties, dielectric properties, and perfusion of biological tissues at hyperthermic and ablation temperatures. Crit Rev Biomed Eng. 2014;42(6):467–492.
- Schutt DJ, Haemmerich D. Effects of variation in perfusion rates and of perfusion models in computational models of radio frequency tumor ablation. Med Phys. 2008;35(8):3462–3470.
- Rafailov IE, Dremin VV, Litvinova KS, et al. Computational model of bladder tissue based on its measured optical properties. J Biomed Opt. 2016;21(2):25006.
- Bashkatov AN, Genina EA, Kochube VI, et al. Optical properties of human skin, subcutaneous and mucous tissues in the wavelength range from 400 to 2000 nm. J Phys D Appl Phys. 2005;38(15):2543–2555.
- Wang L, Jacques SL, Zheng L. MCML - Monte Carlo modelling of light transport in multi-layered tissues. Comput Methods Programs Biomed. 1995;47(2):131–146.
- Sandell JL, Zhu TC. A review of in-vivo optical properties of human tissues and its impact on PDT. J Biophotonics. 2011;4(11-12):773–787.
- Gans R. Über die form ultramikroskopischer goldteilchen. Ann Phys. 1912;342(5):881–900.
- Bohren CF, Human DR. Absorption and scattering of light by small particles. Germany: Wiley-VCH; 2004.
- Kreibig U, Vollmer M. Optical properties of metal clusters. Berlin, Germany: Springer-Verlag; 1995.
- Gaponenko SV. Introduction to nanophotonics. New York: Cambridge University Press; 2010.
- Johnson PB, Christy RW. Optical constants of the noble metals. Phys Rev B. 1972;6(12):4370–4379.
- Prescott SW, Mulvaney P. Gold nanorod extinction spectra. J Appl Phys. 2006;99(12):123504.
- Prescott SW, Mulvaney P. Erratum: “Gold nanorod extinction spectra” [J. Appl. Phys. 99, 123504 (2006)]. J Appl Phys. 2008;103(11):119901.
- Gu X, Timchenko V, Yeoh GH, et al. The effect of gold nanorods clustering on near-infrared radiation absorption. Appl Sci. 2018;8(7):1132.
- Van Der Koijk JF, Lagendijk JJW, Crezee J, et al. The influence of vasculature on temperature distributions in MECS interstitial hyperthermia: importance of longitudinal control. Int J Hyperthermia. 1997;13(4):365–385.
- Babjuk M, Burger M, Comperat EM, et al. European Association of Urology Guidelines on non-muscle-invasive bladder cancer (TaT1 and Carcinoma In Situ) – 2019 Update. Eur Urol. 2019;76(5):639–657.
- Witjes JA, Lebret T, Comperat EM, et al. Updated 2016 EAU guidelines on muscle-invasive and metastatic bladder cancer. Eur Urol. 2017;71(3):462–475.
- Terentyuk GS, Ivanov AV, Polyanskaya NI, et al. Photothermal effects induced by laser heating of gold nanorods in suspensions and inoculated tumours during in vivo experiments. Quantum Electron. 2012;42(5):380–389.
Appendix A
Geometrical factors for spherically capped nanorods
The Mie–Gans theory for calculating the absorption and scattering coefficients assumes the GNR to be spheroids. As such, the geometrical factor (for
= 1, 2, 3) in Equation (15) can be calculated using:
(A1)
(A1)
(A2)
(A2)
where
is oriented in the longitudinal axis of the spheroid, while
and
are in the transverse directions, with
due to symmetry. Experimental studies characterizing the morphology of GNR have shown them to resemble cylinders that are capped at the ends by hemispheres, which is far from the spheroidal shape assumed by the Mie-Gans theory. According to Prescott and Mulvaney [Citation50,Citation51], the difference between the actual shape of the GNR and the assumed shape in the Mie–Gans theory can result in the failure to obtain results that match the data from experimental studies.
To overcome this, the same authors derived alternative values of Pi for non-spheroidal nanoparticles that were expressed as quadratic functions of the nanoparticle aspect ratio, given by:
(A3)
(A3)
where
is the aspect ratio of the nanoparticle and
and
are the coefficients of the quadratic function. For a nanorod with morphology that is described by a cylinder capped at the ends by hemispheres, the coefficients of the quadratic function for a nanorod of diameter 10 nm, which is the size considered in this study, are
= 0.3504,
= 2.0809, and
= −0.3035 [Citation50,Citation51]. It is important to point out that EquationEquation (A3)
(3)
(3) is purely empirical and no physical meaning should be inferred from it.
Appendix B
Mesh convergence study
Mesh convergence was examined by systematically decreasing the maximum element size of each domain, starting from the tumor domain, followed by the bladder, the urine, and the surrounding tissue. Convergence was examined for the velocity magnitude and temperature at several points sampled across the solution domain. The solutions were deemed to be mesh-independent when differences in the solutions across the sampled points between two successive mesh settings were less than 5% for velocity magnitude and 1% for temperature. Although the criterion for velocity was less strict, the choice of 5% was deemed to be acceptable due to the nonlinear nature of the Navier–Stokes equations.
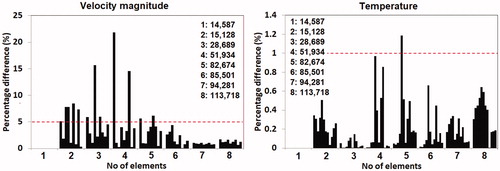
Results from the mesh convergence study are shown in , which plots the percentage difference of the velocity magnitude and temperature sampled at various points between two successive mesh settings. The mesh settings employed led to total number of elements ranging from 14,857 to 113,718 elements. The results in showed that the model with 85,501 elements was sufficiently fine to achieve mesh convergence. Given that the CPU times required for solving the models with 85,501 elements or higher were not significantly different from one another, the mesh employing 113,718 elements was selected for the current study.
Figure B1. Results from mesh convergence study, where the different bars represent the values obtained at different sampled points.
Appendix C
Model verification study
The in vitro experimental study of Terentyuk et al. [Citation56] was adopted for the purpose of the model verification study. In their study, 1.5 ml solutions containing GNR at concentrations of 8 and 100 µg/ml were placed inside Eppendorf tubes and were irradiated with a laser beam of 0.36 W (laser radiation of 1.2 W/cm2 and laser spot area of 0.3 cm2). The GNR has mean diameter and length of 10.2 and 41 nm, respectively.
A 3D model of a standard Eppendorf tube containing 1.5 ml of GNR solution was developed. The governing equations were modified in order to be in agreement with the in vitro conditions of the experiments; in this case, the absence of metabolic heat generation and blood perfusion. A Robin boundary condition similar to EquationEquation (8)(8)
(8) was prescribed along the outer surface of the model. The ambient temperature and the initial temperature of the GNR solution inside the Eppendorf tube were assumed to be 27.5 °C. Since no information was available on the ambient convection coefficient hamb for implementation of the Robin condition, the verification exercise was carried out by first varying hamb to match the numerical results with the experimental results for the solution with 8 µg/ml GNR. The value of hamb that led to good match (less than 5% difference) was then used to verify the model with solutions of 100 µg/ml GNR.
compares the maximum temperature obtained with the computational model and the experimental results from the first to the fifth minute, for the case of 8 µg/ml concentration of GNR. One may observe that a value of hamb of 5 W/m2K yielded percentage difference of less than 10% between the numerical model and the experimental results. When hamb of 5 W/m2K was employed, the percentage difference ranged from 2.1 to 15% for the case of GNR concentration of 100 µg/ml, see . This range is considered to be acceptable for the model verification effort in this study given the uncertainty involved in some of the parameters.
Figure C1. Results from the model verification study for GNR concentration of 100 µg/ml.
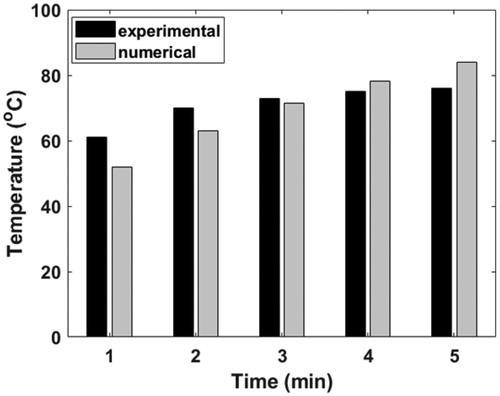
Table C1. Results from the model verification study against the work of Terentyuk et al. [Citation45].