
Abstract
Purpose
The goal of this study was to compare intra-procedural radiofrequency (RF) and microwave ablation appearance on non-contrast CT (NCCT) and ultrasound to the zone of pathologic necrosis.
Materials and methods
Twenty-one 5-min ablations were performed in vivo in swine liver with (1) microwave at 140 W, (2) microwave at 70 W, or (3) RF at 200 W (n = 7 each). CT and US images were obtained simultaneously at 1, 3, and 5 min during ablation and 2, 5, and 10 min post-ablation. Each ablation was sectioned in the plane of the ultrasound image and underwent vital staining to delineate cellular necrosis. CT was reformatted to the same plane as the ultrasound transducer and transverse diameters of gas and hypoechoic/hypoattenuating zones at each time point were measured. CT, ultrasound and gross pathologic diameter measurements were compared using Student’s t-tests and linear regression.
Results
Visible gas and the hypoechoic zone on US images were more predictive of the pathologic ablation zone than on NCCT images (p < 0.05). The zone of necrosis was larger than the zone of visible gas on US (mean 3.2 mm for microwave, 6.4 mm for RF) and NCCT (7.6 mm microwave, 13.9 mm RF) images (p < 0.05). The zone of visible gas and hypoechoic zone on US are more predictive of pathology with microwave ablations when compared with RF ablations (p < 0.05).
Conclusion
When evaluating images during energy delivery, US is more accurate than CT and microwave- more predictable than RF-ablation based on correlation with in-plane pathology.
Introduction
Image-guided percutaneous thermal ablation is increasingly accepted as first- or second-line treatment for certain malignancies [Citation1–4]. The use of contrast-enhanced CT (CECT) is well-established for evaluating ablations following the completion of energy delivery [Citation5], though methods for monitoring during energy delivery are less well-defined. Accurately monitoring ablation progress is critical for safety and efficacy; however, there is currently ambiguity about what imaging features of radiofrequency (RF) and microwave ablations can be used for treatment assessment in real-time. Previous investigators have demonstrated only a weak-to-moderate correlation between RF ablation zones seen by non-contrast CT and ultrasound compared to post-contrast imaging and pathologic specimens [Citation6,Citation7]. While other real-time approaches such as MRI thermometry, ultrasound (US) elastography, ultrasound contrast agents, and serial non-contrast or contrasted-enhanced CT imaging have been evaluated, none are yet in widespread clinical use and all require resources beyond the imaging technique utilized for applicator placement [Citation8–11].
The mechanism of microwave tissue heating may lend itself to excellent visibility of the ablation zone on non-contrast CT and ultrasound. Volume heating rapidly drives temperatures above the boiling point of water to create outgassing and tissue dehydration, and is highly effective at causing thrombosis in draining vessels [Citation12,Citation13]. This results in a high density of gas bubbles surrounding the antenna, which are evident on non-contrast CT and ultrasound [Citation14]. While the appearance of gas produced by microwave heating has been qualitatively described [Citation15], the correlation between the visible gas and extent of tissue necrosis has not been rigorously evaluated, and the visibility of microwave and RF ablation zones on CT and US has not been compared. In addition, the relationship between ultrasound and CT findings has not been elucidated to date, nor has the relative accuracy of these imaging modalities to predict the ultimate zone of necrosis. The purpose of this study was to compare the real-time visibility of RF and microwave ablations with intra-procedural non-contrast CT and ultrasound to in-plane pathologic whole-mount specimens in a porcine liver model.
Materials and methods
Animals
The animal model used in this study was approved by our institutional research animal care and use committee. All husbandry and experimental studies were compliant with the National Institutes of Health Guide for Care and Use of Laboratory Animals. Six female domestic swine pigs were anesthetized, laparotomy performed to allow performance of ablations, the animals euthanized, and postmortem hepatectomy performed as previously described [Citation16].
Experimental/imaging set-up
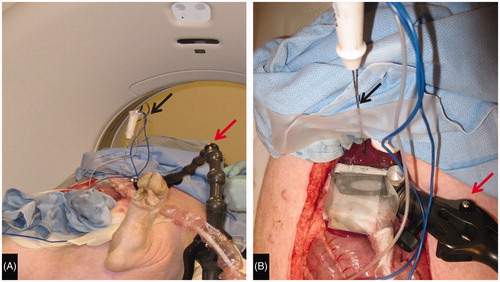
For each ablation, an ultrasound transducer (L15-9 at 10 MHz, ACUSON S2000 [Siemens Medical Solutions USA, Malvern, PA]) fixed to a lockable, articulating arm was placed on the hepatic surface overlying tissue thick enough to perform the planned ablation (). The ablation applicator was placed approximately perpendicular to the transducer and a grayscale US image saved. Ultrasound imaging was performed continuously thereafter. A non-contrast CT (CT 750HD, GE Medical, Waukesha, WI) was performed as a baseline scan. For each ablation, a non-contrast CT through the ablation site was performed at 1, 3, and 5 min during the ablation and at 2, 5, and 10 min post ablation. All CT images were obtained at 1.25 mm slice thickness allowing multiplanar reconstruction in the exact plane of the US transducer. Immediately following each CT examination, the US cine loop was scrolled back 10 s (the mid-point of CT acquisition) and gray scale images saved, allowing time correlation between the acquisition of the CT and ultrasound images. Following the completion of imaging at each ablation site, a spinal needle was placed in the plane of the US transducer and the liver surface marked with cautery along the US transducer face to facilitate tissue sectioning in the imaging plane.
Figure 1. Experimental setup. (A) Swine on CT Table with articulating arm (red arrow) to which ultrasound transducer is affixed extending from table and RF antenna (black arrow) secured in place. (B) View of liver surface with ultrasound transducer (green arrow) affixed to the articulating arm (red arrow) perpendicular to the plane of the RF antenna (black arrow).
Radiofrequency ablations
Seven radiofrequency ablations were performed utilizing a single 17-gauge saline cooled RF electrode (Cool-tip, Covidien, Boulder, CO) with a 3 cm active zone. RF energy was delivered at 200 W (maximum system power) for 5 min using the standard pulsing algorithm based on spikes in tissue impedance [Citation17]. Cooling water maintained at approximately 4 °C was circulated at a rate of 40 ml/min inside of the electrode.
Microwave ablations
A total of 14 microwave ablations were performed utilizing a single 17-gauge gas-cooled antenna (Certus 140 LK15, NeuWave Medical, Madison, WI). All ablations were performed continuously for 5 min, with 7 ablations performed at 140 W (system peak power) and 7 ablations performed at 70 W (half-peak power).
Tissue processing
Following the postmortem hepatectomy described above, the liver at each ablation site was sliced along the spinal needle that had been placed in the US imaging plane. The resultant liver sections were optically scanned (Perfection 2450 Photograph, model G860A; Epson, Long Beach, CA) and saved as electronic images. The liver section was then immersed in nitro blue tetrazolium (NBT, MP Biomedicals, an NADH viability stain) at 100 mg/100 ml prepared with Sorenson phosphate buffer to pH 7.4. NBT stains viable tissue purple, allowing a clear demarcation between non-viable tissue in the ablation zone and the stained tissue. This method has been proven accurate at the microscopic level for ablation procedures [Citation18]. Following viability staining, the liver sections were again scanned.
Image analysis
Multi-planar reformatting of the CT data at each time point was performed such that the resultant CT image was in the exact plane of the ultrasound transducer (Osirix, Pixmeo, Geneva, Switzerland) (). Two imaging surrogates of ablation were measured (ImageJ; National Institutes of Health, Bethesda, MD) for each ultrasound and CT image at each time point by two observers: (1) the width of visible gas (gas zone) which was hyperechoic by ultrasound and hypoattenuating by CT (window level: 100, window width: 200), and (2) the surrounding hypoechoic/hypoattenuating area (pathologically the edema zone) (). The volume of visible gas on CT was directly measured at the completion of each ablation using CT volumetry obtained from a semi-automated definition of the gas zone (Osirix, Pixmeo, Geneva, Switzerland, ). The maximum width of non-viable tissue on pathology specimens at a single level parallel to the ultrasound transducer was measured by a single author (ImageJ; National Institutes of Health, Bethesda, MD).
Figure 2. Sagittal (A), Axial (B), and coronal (C) planes through the ultrasound transducer (arrow A–C) created with multiplanar reconstruction. The coronal plane (C) was used to replicate the ultrasound plane by aligning the axial plane (purple line) with the ultrasound transducer face. This allowed equivalent in plane gas and hypoattenuating zone measurements of the ablation zone (arrowhead A, C).
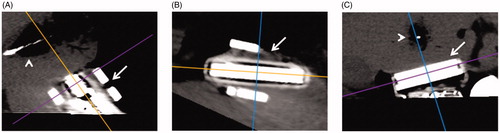
Figure 3. Measurement of gas zones at completion of ablation on CT (A), US (B), and with a corresponding tissue slice stained with NBT (C). A hypodense zone in (A) and hypoechoic zone in (B) are seen to correlate with the pathologic margin in (C) (blue arrows). On NBT-stained whole mount (C) note the difference between tan-brown char of ablation zone (red arrow) and viable red-purple liver (yellow arrow)
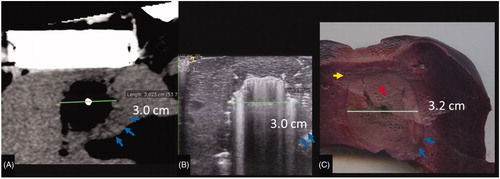
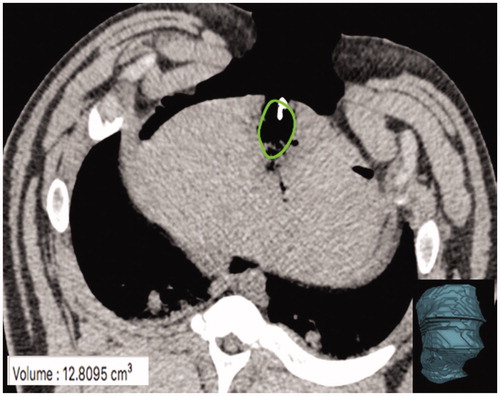
Figure 4. CT slice with MW gas zone outline (green oval). The gas zone was outlined using semi-automated software and edges confirmed on contiguous axial images to define the volumetric extent of the zone of visible gas. A corresponding volume rendered composite (bottom right image) created and the resultant volume output (bottom left corner) was recorded.
Data analysis
The CT and US diameter measurements from each reader were averaged to provide a consensus measurement for each timepoint. Mean and standard deviation (SD) of absolute diameter differences between imaging findings and pathologic analysis were calculated for visible gas, hypoechoic, and hypoattenuating zones by US and CT. Data are reported as mean absolute difference (SD; Range). Comparisons of diameters between ablation energies and US/CT were performed using Student’s t-test. Linear regression analysis was performed to compare the relationship between the imaging diameter measurements at the completion of ablation and pathologic measurements in the same plane. A p-value less than 0.05 indicated a significant difference. Microsoft Excel (Microsoft, Redmond, WA) was utilized for these analyses. In addition, pathology diameter was linearly regressed on imaging diameter for all four combinations of imaging (US-microwave, CT-microwave, US-RF, CT-RF) and zone of hypodensity with all three power settings combined. A likelihood ratio F-test was used to assess whether the slope by power interaction was significant. Bland–Altman 95% limits of agreement were obtained to assess the average difference (bias) between ablation zone diameters measured at pathology and at imaging, and to characterize their discrepancies; repeated measures were accounted for using standard methods [Citation19]. Multiple ablations within the same animal were treated as independent. R software (version 3.1.2, The R Foundation) was used for these analyses.
Results
Ablation zone appearance
Ablations zones comprised a central area of gas surrounding the applicator. By US, the gas was highly echogenic with posterior acoustic shadowing. At CT, the gas was markedly hypoattenuating. A peripheral ring of low attenuation (edema zone) surrounded the central gas on CT with a peripheral ring of hypoechogenicity surrounding the central gas on US. Microwave ablation zones demonstrated a confluent, circumferentially symmetric, and wide area of gas surrounding the antenna whereas RF ablation zones were characterized by less gas overall. The gas in RF ablations appeared less confluent and relatively asymmetric ().
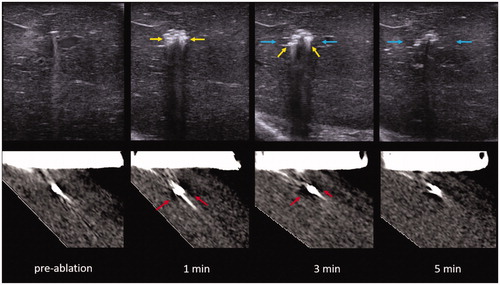
Figure 5. US (top) vs. CT (bottom) intra-procedure images of RF ablation at each point of image recording in the experiment. Note how the zone of visible gas is most pronounced at 1 and 3 min (yellow arrow) with minimal visible gas 5 min into the ablation. Similarly, gas is most notable at 1 and 3 min on CT (red arrows) with more dissipated gas at 5 min. A hypoechoic zone is noted at 3 and 5 min on the ultrasound (blue arrows), while the hypodense zone at CT is difficult to visualize.
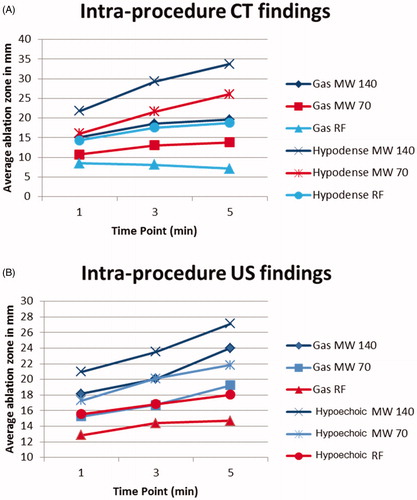
The gas on both CT and US enlarged at each time point during microwave ablations. During RF ablation, the zone of visible gas initially enlarged over time on US images and paradoxically decreased on CT. The hypoechoic/hypoattenuating zone surrounding the gas continually increased at each time point for both CT and US for both RF and microwave ablation ( and ).
Figure 6. US (top) vs. CT (bottom) intra-procedure images of MW ablation. Yellow arrows describe the zone of gas while red arrows indicate the hypoechoic/hypodense zone. Note the easy visibility of gas within the ablation zone on both ultrasound and CT while the hypodense zone is subtle, particularly on CT. These images also demonstrate the continually visible growth of the zone of out-gassing.
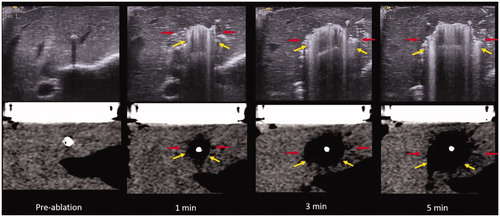
Figure 7. Graph demonstrating change in mean ablation diameter of gas and hypoechoic/hypoattenuating zone on CT (A) and US (B) during the ablation.
Ablation zone size at the completion of energy delivery (Table 1)
CT vs. US comparison
The peripheral hypoechoic zone on US provided the most accurate representation of the pathologic ablation zone, on average 2.5 mm smaller (SD 2.8; range 0.1–12.5 mm). This finding was statistically more accurate than the gas zone on US (p = 0.002), and gas (p < 0.001) and hypoattenuating zones on CT (p = 0.003). On CT, the hypoattenuating zone more closely corresponded to pathology than the gas zone, demonstrating a 5.1 mm underestimation vs. pathology (SD 3.0; range 0.3–12.3, p = 0.003). Comparing the gas zones between CT and US, US was more accurate with an average underestimation of 4.2 mm (SD 4.0 mm; range 0.1–18.1) compared with an average underestimation of 9.7 mm (SD 9.7 mm; range 1.5–23.7 mm; underestimated pathology in 100% of cases) on CT (p < 0.001). With CT at the completion of ablation, the hypoattenuating zone appears to be better-correlated with pathology, while the zone of visible gas is less predictive on linear regression analysis ().
Table 1. Mean absolute difference between imaging findings at the completion of ablation and pathology.
RF vs. microwave comparison
The volume of gas visible on CT was significantly larger for microwave ablation at 140 W (mean 8.9 ml; SD 3.5; range 5.6–14.6) compared to 70 W (3.0 ml; SD 1.1; range 1.7–4.5; p = 0.001). Gas visible during microwave ablation at both 140 W and 70 W was larger than during RF ablation (1.4 ml; SD 1.3; range 0.6–4.3; p < 0.001).
When comparing the diameter of the gas zone on US, microwave more closely matched pathology than RF (p = 0.04). The visible gas zone on ultrasound for MW underestimated pathology by 3.2 mm (SD 1.7; range 0.1–6.4) and RF underestimated pathology by 6.4 mm (SD 6.3; range 0.2–18.1; underestimated pathology in 86% of cases). Similarly, the hypoechoic zone on US during microwave ablation underestimated pathology by 1.5 mm (SD 1.4; range 0.1–4.4) while the same zone during RF ablation underestimated pathology by 4.5 mm (SD 3.8; range 2.1–12.5) (). Linear regression analysis at the completion of ablation demonstrated that gas and hypoechoic zones were better-correlated with pathology for microwave than for RF ablation when monitoring with ultrasound. These modality differences were statistically significant (p-0.007).
With CT, the zone of visible gas was more predictive of the pathology with microwave than RF ablation (p < 0.001). The gas zone on CT underestimated the microwave ablation diameter by a mean of 7.6 mm (SD 3.3; range 1.5–10.9) compared with 13.9 mm (SD 4.6; range 9.9–23.7) for RF ablation.
Post-procedure imaging
The zone of visible gas on US and CT decreased rapidly from the completion of ablation to 2 min for both microwave and RF energies, followed by a continual slow decrease to 10 min (). The hypoechoic/hypoattenuating zone was minimally changed from the completion of ablation to post-ablation time points ().
Figure 8. US (top) vs. CT (bottom) images of the MW ablation zone post-procedure. Yellow arrows describe the zone of gas while red arrows indicate the hypoechoic/hypoattenuating zone. (Note that the hypoattenuating zone is subtle on CT.) Note the relatively rapid resolution of the zone of visible gas on both ultrasound and CT.
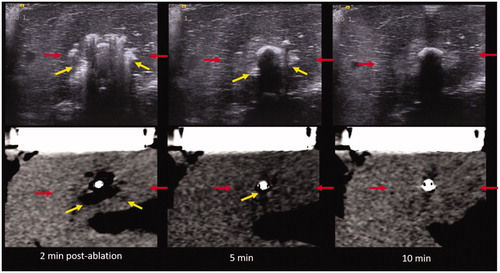
Table 2. Mean diameter (range, mm) at the completion of ablation and at each post-ablation time point (note: MW numbers include ablation performed at 70 W and 140 W).
Discussion
Despite a robust and growing body of literature surrounding the development of RF and microwave ablation devices, techniques and clinical results, there has been less attention paid to real-time imaging findings. The ability to contemporaneously image the growing ablation zone is critically important to customize the power and time necessary to treat a specific tumor and margin while minimizing collateral damage. In this study, CT and US imaging demonstrated that intra-procedural RF and microwave ablation zones were composed of a central gas zone surrounding the ablation applicator and a more peripheral hypoechoic/hypoattenuating zone around the gas zone. Post procedure, there was rapid disappearance of gas over 10 min for both modalities, with no change in the hypoechoic/hypoattenuating zone. Real-time ultrasound appeared to more accurately predict zones of necrosis than non-contrast CT, and the imaging of microwave ablation zones appeared to correlate more closely with zones of necrosis than imaging during RF ablation.
During energy application, both RF and microwave ablation elevate tissue temperatures enough to create outgassing of parenchymal water, which is readily visible by both CT and US imaging. This phenomenon is known to correspond roughly to tissue reaching its boiling point, i.e., slightly more than 100 °C [Citation20]. At these temperatures, tissue becomes necrotic within seconds. The more peripheral band of tissue surrounding the gas zone (the hypoechoic/hypoattenuating zone) appeared to more closely correlate to the ultimate zone of tissue necrosis than the gas zone alone, and therefore likely represents tissue that was heated to temperatures between 60 and 100 °C. Heating tissue is known to decrease CT attenuation in a roughly linear fashion [Citation21]. However, the differences in attenuation between normal and heated tissue have not been enough to exploit in a clinically useful manner. This was explored in this work primarily because many centers use CT guidance alone for percutaneous ablation procedures. We note that the hypoechoic/hypoattenuating zone was a far more subtle imaging finding than the gas zone by both CT and ultrasound and may be difficult to discriminate in a clinical setting due to patient size, artifacts (particularly from the body wall), limited radiation dose, and motion. Therefore, if the gas zone alone is used as a real-time surrogate marker for the zone of necrosis, this finding will be more accurately imaged with US, particularly during microwave ablation, and slightly underestimates the size of the ablation zone.
There is only a limited body of work comparing CT and ultrasound findings during microwave and the resultant zone of necrosis. One previous study of microwave ablation in pigs demonstrated that a calculated ablation measurements on B-mode ultrasound underestimated the ablation zone [Citation22], a finding similar to this study. Another small study in rabbits replicated these results and also concluded that imaging accuracy for microwave is better than for RF ablation [Citation23]. Because the appearance of the specific ultrasound findings used for measurements were not described in either of these studies, comparisons to the current study are limited [Citation22,Citation23]. Another study demonstrated an excellent correlation between color Doppler (a surrogate for moving gas) and the microwave ablation zone. The size of the ablation zone as depicted with color Doppler correlated to within 2 mm with the zone of pathologic necrosis, similar to the findings of this study [Citation24].
Improved visualization of microwave ablations compared to RF was an expected finding given the difference in the mechanism of tissue heating. RF ablation systems are designed to prevent temperatures from exceeding 100 °C since outgassing and desiccation increase impedance and limit RF ablation zone size [Citation25]. Only small amounts of gas are produced. The gas diffuses into the surrounding tissue and is carried away from the ablation zone by patent vessels, decreasing the precision of gas-based imaging findings [Citation26]. Notably, in this study gas visible by CT decreased over time, possibly related to the low density of gas within the zone. In comparison, microwave energy delivery can persist during gas generation, leading to more substantial boiling and outgassing throughout the procedure. Microwave ablation can also be highly effective at causing vascular thrombosis in small vessels, which may delay gas from being cleared from the ablation zone, further increasing visibility [Citation12,Citation13].
This work has the potential to impact the safety and efficacy of clinical ablation procedures. For example, when performing an ablation near a critical structure ultrasound may be utilized to monitor the growth of the ablation and the power adjusted down or ablation discontinued when the gas zone approaches within millimeters of the critical structure. From an efficacy standpoint, an ablation can be monitored to ensure that gas encompasses visible tumor (at least in the near field not obscured by shadowing from gas) prior to cessation of ablation. Based on these real-time imaging findings additional time could be added to the planned ablation if the tumor is not encompassed. While this work was not performed in a tumor model, the margin of an appropriate ablation should be outside of the tumor, within normal liver, improving the applicability of these findings. In addition, there is evidence that MW outperforms radiofrequency ablation in clinical practice [Citation27,Citation28], which may in part be explained by these findings in a non-tumor model. Other methods for monitoring complete necrosis hold promise as well, including diffuse reflectance spectroscopy and fluorescent tissue assessment [Citation29,Citation30]. Overall, adopting a work flow of continuous monitoring of ablations with ultrasound or intermittent monitoring with CT has the potential to improve the safety and efficacy of ablations, though this requires further validation in clinically performed ablations.
The study had certain limitations. First, the data was obtained in a normal live animal model. Ablation zones are known be larger in human tumors (likely due to the decreased vascularity of tumors compared to normal liver) and the visibility of the ablation zone in a tumor may be different than normal liver [Citation31]. Because ablation zones need to be most visible in normal liver if an adequate ablative margin is to be obtained, we do not believe that this is a significant limitation. This study was also not performed in a cirrhotic model like much of the population undergoing RF or microwave ablation. A more important limitation of this study is that the ultrasound data was obtained intraoperatively with the ultrasound transducer placed directly on the liver surface. The lack of respiratory motion and direct scanning in this model makes this a best-possible case scenario for ultrasound. Given the large range of body composition encountered in human clinical practice, the ultrasound results may be difficult to replicate in certain populations, and the peripheral hypoechoic/hypoattenuating zone may not be highly visible. One further limitation of this study is that only one RF and microwave ablation technology was tested at limited times and power settings due to finite resources. The results may be different with other systems, particularly RF systems that operate at lower powers with impedance or temperature control. A notable strength of this study is the precise correlation of an individual CT slice, US scan plane, and pathologic specimen. However, tissue deformation during slicing may have been a source of experimental error.
In summary, ultrasound was more accurate than non-contrast CT for the intraprocedural monitoring of RF and microwave ablation zones in this model. Imaging during microwave ablation appeared to correlate more closely with pathologic coagulation necrosis than imaging during RF, a finding that likely reflects the differing methods of tissue heating. Application of real-time evaluation of ablation zones may improve the safety and efficacy of tumor ablation.
Disclosure statement
Timothy J. Ziemlewicz- Ethicon: Consultant; Histosonics: Consultant, stockholder.
J. Louis Hinshaw- Ethicon: Consultant.
Meghan G. Lubner- Ethicon: Prior grant funding; Philips: Prior grant funding.
Fred T. Lee, Jr.- Medtronic: Patents, royalties; Ethicon: Consulting; Histosonics: Stockholder, board of directors, research support.
Christopher L. Brace- Johnson & Johnson: Consultant; NeuroOne: Consultant; Elucent Medical: Shareholder; Symple Surgical: Shareholder.
Additional information
Funding
References
- Campbell S, Uzzo RG, Allaf ME, Bass EB, et al. Renal mass and localized renal Cancer: AUA Guideline. J Urol. 2017;198(3):520–529.
- European Association for the Study of the L, European Organisation for R, Treatment of C. EASL-EORTC clinical practice guidelines: management of hepatocellular carcinoma. J Hepatol. 2012;56(4):908–943.
- Forner A, Llovet JM, Bruix J. Hepatocellular carcinoma. Lancet. 2012;379(9822):1245–1255.
- Gillams A, Goldberg N, Ahmed M, et al. Thermal ablation of colorectal liver metastases: a position paper by an international panel of ablation experts, The Interventional Oncology Sans Frontières meeting 2013. Eur Radiol. 2015;25(12):3438–3454.
- Ahmed M, Solbiati L, Brace CL, et al. Image-guided tumor ablation: standardization of terminology and reporting criteria-A 10-year update. Radiology. 2014;273(1):241–260.
- Cha CH, Lee FT, Jr., Gurney JM, et al. CT versus sonography for monitoring radiofrequency ablation in a porcine liver. AJR Am J Roentgenol. 2000;175(3):705–711.
- Raman SS, Lu DS, Vodopich DJ, et al. Creation of radiofrequency lesions in a porcine model: correlation with sonography, CT, and histopathology. AJR Am J Roentgenol. 2000;175(5):1253–1258.
- Terraz S, Cernicanu A, Lepetit-Coiffe M, et al. Radiofrequency ablation of small liver malignancies under magnetic resonance guidance: progress in targeting and preliminary observations with temperature monitoring. Eur Radiol. 2010;20(4):886–897.
- Wu H, Wilkins LR, Ziats NP, et al. Real-time monitoring of radiofrequency ablation and postablation assessment: accuracy of contrast-enhanced US in experimental rat liver model. Radiology. 2014;270(1):107–116.
- Wu PH, Brace CL. Analysis of iodinated contrast delivered during thermal ablation: is material trapped in the ablation zone? Phys Med Biol. 2016;61(16):6041–6054.
- Yang W, Ziemlewicz TJ, Varghese T, et al. Post-procedure evaluation of microwave ablations of hepatocellular carcinomas using electrode displacement elastography. Ultrasound Med Biol. 2016;42(12):2893–2902.
- Chiang J, Cristescu M, Lee MH, et al. Effects of microwave ablation on arterial and venous vasculature after treatment of hepatocellular carcinoma. Radiology. 2016;281(2):617–624.
- Lubner MG, Brace CL, Hinshaw JL, et al. Microwave tumor ablation: mechanism of action, clinical results, and devices. J Vasc Interv Radiol. 2010;21(8 Suppl):S192–S203.
- Samimi K, White JK, Brace CL, et al. Monitoring microwave ablation of ex vivo bovine liver using ultrasonic attenuation imaging. Ultrasound Med Biol. 2017;43(7):1441–1451.
- Wells SA, Hinshaw JL, Lubner MG, et al. Liver ablation: best practice. Radiol Clin North Am. 2015;53(5):933–971.
- Lubner MG, Hinshaw JL, Andreano A, et al. High-powered microwave ablation with a small-gauge, gas-cooled antenna: initial ex vivo and in vivo results. J Vasc Interv Radiol. 2012;23(3):405–411.
- McGahan JP, Loh S, Boschini FJ, Paoli EE, et al. Maximizing parameters for tissue ablation by using an internally cooled electrode. Radiology. 2010;256(2):397–405.
- Neumann RA, Knobler RM, Pieczkowski F, et al. Enzyme histochemical analysis of cell viability after argon laser-induced coagulation necrosis of the skin. J Am Acad Dermatol. 1991;25(6 Pt 1):991–998.
- Bland JM, Altman DG. Agreement between methods of measurement with multiple observations per individual. J Biopharm Stat. 2007;17(4):571–582.
- Brace CL. Radiofrequency and microwave ablation of the liver, lung, kidney, and bone: what are the differences? Curr Probl Diagn Radiol. 2009;38(3):135–143.
- Weiss N, Goldberg SN, Sosna J, et al. Temperature-density hysteresis in X-ray CT during HIFU thermal ablation: heating and cooling phantom study. Int J Hyperthermia. 2014;30(1):27–35.
- Correa-Gallego C, Karkar AM, Monette S, et al. Intraoperative ultrasound and tissue elastography measurements do not predict the size of hepatic microwave ablations. Acad Radiol. 2014;21(1):72–78.
- Ziv O, Goldberg SN, Nissenbaum Y, et al. Optical flow and image segmentation analysis for noninvasive precise mapping of microwave thermal ablation in X-ray CT scans - ex vivo study. Int J Hyperthermia. 2018;34(6):744–755.
- Byrd JF, Agee N, McKillop IH, et al. Colour doppler ultrasonography provides real-time microwave field visualisation in an ex vivo porcine model. HPB (Oxford). 2011;13(6):400–403.
- Haemmerich D. Mathematical modeling of impedance controlled radiofrequency tumor ablation and ex-vivo validation. Conf Proc IEEE Eng Med Biol Soc. 2010;2010:1605–1608.
- Varghese T, Techavipoo U, Zagzebski JA, et al. Impact of gas bubbles generated during interstitial ablation on elastographic depiction of in vitro thermal lesions. J Ultrasound Med. 2004;23(4):535–544. quiz 45-6.
- Shady W, Petre EN, Do KG, et al. Percutaneous microwave versus radiofrequency ablation of colorectal liver metastases: ablation with clear margins (A0) provides the best local tumor control. J Vasc Interv Radiol. 2018;29(2):268–275.e1.
- Potretzke TA, Ziemlewicz TJ, Hinshaw JL, et al. Microwave versus radiofrequency ablation treatment for hepatocellular carcinoma: a comparison of efficacy at a single center. J Vasc Interv Radiol. 2016;27(5):631–638.
- Tanis E, Spliethoff JW, Evers DJ, et al. Real-time in vivo assessment of radiofrequency ablation of human colorectal liver metastases using diffuse reflectance spectroscopy. Eur J Surg Oncol. 2016;42(2):251–259.
- Sotirchos VS, Fujisawa S, Vakiani E, et al. Fluorescent tissue assessment of colorectal cancer liver metastases ablation zone: a potential real-time biomarker of complete tumor ablation. Ann Surg Oncol. 2019;26(6):1833–1840.
- Amabile C, Ahmed M, Solbiati L, et al. Microwave ablation of primary and secondary liver tumours: ex vivo, in vivo, and clinical characterisation. Int J Hyperthermia. 2017;33(1):34–42.