
 ?Mathematical formulae have been encoded as MathML and are displayed in this HTML version using MathJax in order to improve their display. Uncheck the box to turn MathJax off. This feature requires Javascript. Click on a formula to zoom.
Abstract
Hyperthermia treatment planning (HTP) is valuable to optimize tumor heating during thermal therapy delivery. Yet, clinical hyperthermia treatment plans lack quantitative accuracy due to uncertainties in tissue properties and modeling, and report tumor absorbed power and temperature distributions which cannot be linked directly to treatment outcome. Over the last decade, considerable progress has been made to address these inaccuracies and therefore improve the reliability of hyperthermia treatment planning. Patient-specific electrical tissue conductivity derived from MR measurements has been introduced to accurately model the power deposition in the patient. Thermodynamic fluid modeling has been developed to account for the convective heat transport in fluids such as urine in the bladder. Moreover, discrete vasculature trees have been included in thermal models to account for the impact of thermally significant large blood vessels. Computationally efficient optimization strategies based on SAR and temperature distributions have been established to calculate the phase-amplitude settings that provide the best tumor thermal dose while avoiding hot spots in normal tissue. Finally, biological modeling has been developed to quantify the hyperthermic radiosensitization effect in terms of equivalent radiation dose of the combined radiotherapy and hyperthermia treatment. In this paper, we review the present status of these developments and illustrate the most relevant advanced elements within a single treatment planning example of a cervical cancer patient. The resulting advanced HTP workflow paves the way for a clinically feasible and more reliable patient-specific hyperthermia treatment planning.
Introduction
Clinical hyperthermia aims at heating the tumor to a temperature of 39–43 °C in order to increase the therapeutic effect of radiotherapy and/or chemotherapy. Several clinical trials have demonstrated that complementing these two standard oncological treatments with hyperthermia improves the tumor response and patient survival for different tumor sites (e.g., cervix [Citation1,Citation2], breast [Citation3], bladder [Citation4], soft tissue sarcoma [Citation5]). In general, a therapeutic thermal dose of 43 °C for 1 h is pursued in the tumor [Citation6,Citation7], in view of the demonstrated thermal dose-effect relationship [Citation8–10]. This desired tumor thermal dose is often not achieved because of treatment limiting hot spots exceeding 45 °C in normal tissue. Achieving optimal tumor heating while avoiding hot spots in healthy tissues is a clinical challenge. Hyperthermia treatment planning (HTP) can be helpful to improve treatment quality, especially for locoregional hyperthermia as applied to deep-seated (pelvic) tumors, for which the use of HTP is recommended by the most recent quality assurance guidelines [Citation11]. Locoregional hyperthermia is usually applied by heating systems consisting of phased-arrays of radiofrequency (RF) antennas, operating at frequencies between 60 and 130 MHz for deep-seated pelvic tumors [Citation12,Citation13], between 300 and 600 MHz for brain tumors [Citation14] and at 434 MHz for head and neck tumors [Citation15]. Thus, some extent of normal tissue heating is inevitable and several degrees of freedom (i.e., the amplitudes and phases of the individual antennas) are available to optimize the temperature distribution. In this respect, HTP can be very useful to predict optimal settings for effective tumor heating during thermal therapy delivery [Citation16–18]. In this introduction, we review the current practice in HTP workflow and the recent research progress made to improve HTP accuracy.
In the typical clinical HTP workflow, an anatomical patient model is generated by segmenting a pretreatment CT or MR image [Citation18–20]. For each segmented tissue, dielectric (or electrical) and thermal tissue properties are normally assigned from tabulated literature data. Then, electromagnetic and thermal simulations are performed to obtain the electric field, power absorption and temperature distribution in the patient’s body for selected phase-amplitude settings. Thermal modeling is generally based on Pennes’ bioheat equation [Citation21], which models the heat transfer from blood to tissue as a heat sink term proportional to the local volumetric blood perfusion and the difference between local tissue temperature and the assumed blood temperature. Subsequently, automatic optimization techniques [Citation16,Citation22–25] predict the phase-amplitude settings for the individual antennas to realize optimal heat deposition in the tumor while preventing overheating of normal tissue. Notwithstanding various studies reported good qualitative agreement between HTP simulations and clinical observations during treatment [Citation26–29], present hyperthermia treatment plans lack quantitative accuracy because of uncertainties in dielectric [Citation30–32] and thermal [Citation25] parameters and because of approximate heat transport modeling of blood flow and heat convection in fluids [Citation33–35]. Furthermore, these hyperthermia treatment plans report only power and temperature distributions, but do not allow easy interpretation of the increased radiosensitization and therefore of the added clinical benefit to the primary treatment. Over the past years, substantial effort has been put into research to improve the reliability of hyperthermia treatment planning.
An important advancement is the measurement and inclusion of patient-specific electrical tissue properties. Indeed, uncertainties (up to 50%) in dielectric properties, in particular in the electrical conductivity, can cause average errors of 20% in the predicted power deposition [Citation30], therefore leading to suboptimal prediction of tumor heating and hot spots outside the target region. Permittivity and conductivity maps were initially obtained from the water and fat content determined using standard MRI sequences [Citation36,Citation37]. A shortcoming of these methods is that they are calibrated on literature values and thus they neglect the impact of heterogeneities in ionic concentration, blood content and tumor pathophysiology in the calculation of the electrical properties. Subject-specific maps of the electrical conductivity were later reconstructed with another MR-based technique, called MR Electrical Properties Tomography (EPT), which relies on measurements of the RF magnetic transmit field, also called B1+, generated within the body during an MR scan [Citation38,Citation39]. Balidemaj et al. [Citation40] reported a substantial effect of including EPT conductivity values in the patient models for HTP, compared to using literature values: differences in the predicted temperature ranged from 0.6 °C to 1.5 °C in five patients. However, the accuracy of EPT at tissue interfaces and its robustness against noise are limited. Lately, Mandija et al. [Citation41] have pioneered an EPT technique exploiting Deep Learning (DL-EPT). In DL-EPT, electrical properties of a body site at a specific field strength are reconstructed by a convolutional neural network trained on large datasets of simulated B1+ distributions. Very recently, a novel DL-EPT method has been developed for reconstruction of in vivo 3D conductivity maps in the pelvic region [Citation42]. Both the in silico validation and the in vivo comparison with a conventional EPT technique demonstrated that this DL-EPT method is able to reconstruct pelvis conductivity maps with high noise-robustness and accuracy at tissue interfaces.
Sophisticated modeling of the thermal impact of blood flow, urine and cerebrospinal fluid has been developed to calculate more accurate temperature distributions during hyperthermia for various tumor sites. Since the substantial heat exchange between individual large blood vessels and the surrounding tissues is ignored in the Pennes heatsink model, thermal models including discrete vessels have been proposed [Citation43–45]. The discrete vasculature model (DIVA) by Kotte et al. [Citation46,Citation47] efficiently represents 3D patient-specific vessel trees within a 3D thermal model. Raaymakers et al. [Citation48] experimentally validated the DIVA temperature prediction, demonstrating that temperature profiles in the vicinity of a large vessel in the heated area corresponded well to the measured temperature profiles, in contrast to the temperature profiles predicted by the simple Pennes model [Citation33,Citation34,Citation49]. Sumser et al. [Citation49] reported maximum temperature differences of ∼1 °C between DIVA and Pennes models for target volumes close to large vessels. In case unbound body fluids, e.g., urine and cerebrospinal fluid, are present in the heated region, convection will influence the temperature distribution. Schooneveldt et al. developed convective fluid models of the bladder [Citation35,Citation50] and cerebrospinal fluid [Citation51] to accurately represent the fluid dynamics during hyperthermia. In the bladder, for example, more realistic and homogeneous temperatures were predicted by the complete fluid thermodynamic model. Compared to the default model, in which the bladder was modeled as a solid perfused (muscle) tissue, mean deviations between temperature predictions and measurements during treatment reduced from 4 °C to 0.6 °C [Citation35].
Several phase-amplitude optimization techniques have been developed to efficiently calculate the effective phase-amplitude steering settings for modern phased-array systems. These techniques are normally referred to as SAR-based [Citation16,Citation23,Citation52,Citation53] or temperature-based [Citation25,Citation54] optimization strategies, depending on whether their optimization principle is applied to the SAR distribution or the temperature distribution. SAR-based optimization typically maximizes the quotient of the absorbed power in the tumor and a weighted energy norm outside the tumor [Citation22]. Additional weight functions can be defined to account for potential hot spot locations, or regions which are known to have a significantly different perfusion. Nonetheless, temperature hot spots can still occur after SAR-based optimization. Temperature-based optimization allows for direct constraints to normal tissue temperatures, but fast thermal computations are essential since many temperature evaluations need to be performed during optimization. For this purpose Cheng et al. [Citation55] proposed a concept called ‘virtual sources’, which uses a weighted combination of pre-calculated phase-amplitude configurations. Das et al. [Citation56] formulated a method based on superposition of pre-calculated temperature distributions, based on Pennes’ bioheat equation. By extending the concept of temperature superposition to DIVA thermal modeling, Kok et al. [Citation57] enabled efficient temperature-based optimization accounting for discrete vasculature.
Recently, biological modeling has been introduced to quantify the radiosensitization effect of hyperthermia. In this regard, Kok et al. [Citation58] presented a method to predict the effect of hyperthermic radiosensitization in terms of equivalent enhanced radiation dose, i.e., the radiation dose yielding the same biological effect as the combined radiotherapy plus hyperthermia treatment. In this model, the equivalent dose calculation is based on an extended version of the linear-quadratic (LQ) model with temperature-dependent radiosensitivity parameters α and ß reflecting the radio-sensitizing effect of hyperthermia. Literature data on the radiobiological parameters of different tumor and normal tissues at hyperthermic temperatures are scarce, therefore α and ß are normally determined based on few studies reporting the α and β values for some specific tumor cell lines at specific temperatures [Citation59,Citation60]. Myerson et al. [Citation61] and van Leeuwen et al. [Citation62] went a step further: Myerson et al. [Citation61] modeled the heat-induced radiosensitization as changes in the α parameter based on results from in vitro hyperthermia studies; van Leeuwen et al. [Citation62] derived the α and β behavior from mathematical modeling based on biological experiments on cervical cancer cell lines. Furthermore, Franken et al. [Citation60] and Datta and Bodis [Citation63] concluded that the rise in tumor temperature during hyperthermia significantly changes the tumor α/β ratio, based on cell survival experiments and on clinical data. Studies in in vivo tumor models [Citation64,Citation65] also demonstrated that hyperthermia is tumor-selective as it does not cause significant radiosensitization in normal tissues, provided radiotherapy and hyperthermia are given sequentially. Hence, normal tissue α and ß values are assumed to be much less temperature-dependent. In general, results from biological modeling in prostate [Citation58], cervical cancer [Citation66], and recurrent pediatric sarcoma patients [Citation67] demonstrated considerable dose escalations for the combined treatment, highlighting the importance to take the synergistic action of radiotherapy and hyperthermia into account during the treatment planning.
Thus, substantial improvements on various aspects of hyperthermia treatment planning have been realized, but these elements should be integrated into a single HTP workflow to fully exploit the benefits of this research. Hence, in this paper we demonstrate how to integrate the most relevant advanced developments in this field into a single workflow, thereby illustrating an example for advanced patient-specific hyperthermia treatment planning.
HTP workflow
We demonstrate the advanced workflow for hyperthermia treatment planning on a cervical cancer patient. The patient underwent a diagnostic MRI examination, after which she was diagnosed with stage IIIB adenosquamous carcinoma of the cervix. The patient received a combined radiotherapy (RT) + hyperthermia (HT) treatment. An external beam radiation dose of 46 Gy (23 × 2 Gy) was given, followed by a 24 Gy brachytherapy boost using pulse dose rate (PDR) brachytherapy. Five weekly hyperthermia treatments were delivered after an external beam RT session, by using the 70 MHz AMC-4/ALBA-4D locoregional hyperthermia system. According to the clinical protocol, a planning CT scan was made for both external beam radiotherapy and hyperthermia. The external beam dose distribution was calculated using Oncentra External Beam (Elekta AB, Stockholm, Sweden). Hyperthermia treatment planning was performed using Plan2Heat [Citation68].
Hereafter, we outline first the clinical imaging acquisition protocols, then we describe the methodologies used for advanced hyperthermia treatment planning, which include DL-EPT patient-specific tissue conductivity values, modeling of large vasculature, an effective thermal conductivity accounting for convection within the urine in the bladder, phase-amplitude optimization and biological modeling. The advanced hyperthermia treatment planning workflow is also schematically illustrated in .
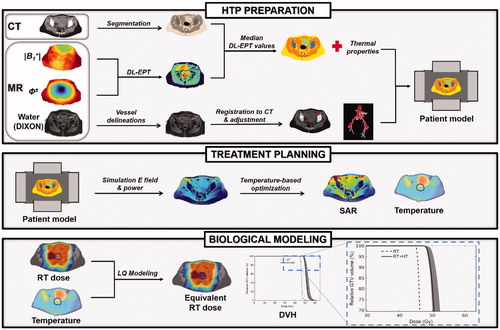
Figure 1. Workflow describing schematically all the methodological steps performed for advanced HTP. In HTP preparation, the patient anatomical model is obtained from CT segmentation. The vasculature, reconstructed from an MR scan and registered to the CT, is also included in this model. The dielectric properties are assigned to each tissue type based on the median DL-EPT values. The thermal properties are assigned from literature values, but an effective thermal conductivity accounting for convective heat transfer in the bladder is assigned. Next, treatment planning is performed, in which the electric field distribution is calculated and phase-amplitude settings for effective tumor heating are optimized. Finally, biological modeling predicts the radiosensitizing effect of hyperthermia in terms of an equivalent enhanced radiation dose.
Imaging protocols
MR
The diagnostic MRI examination was carried out with a 3T clinical scanner (Ingenia, Philips Healthcare, Best, the Netherlands) with a 26-channel torso receive coil. A 3D spoiled gradient echo was acquired with flip angle (FA) = 10°, TR = 5.6 ms, echo train length = 3, SENSE accelerator factor = 1.5 for both phase encoding directions, FOV = 350 × 350 × 98 mm3, resolution = 1.22 × 1.22 × 1.3 mm3, scan time = 1:51 min, and processed according to a generalized two-point Dixon’s method [Citation69]. The resulting water-only image was used for vascular segmentation.
Additionally, a 3D AFI sequence [Citation70] and a 2 D multi-slice spin echo (SE) sequence were performed to reconstruct the amplitude of the B1+ field, |B1+|, and the transceive phase, ϕ±, respectively, which are necessary for EPT reconstruction. AFI was performed with FA = 65°, TR1 = 30 ms, TR2 = 120 ms, TE = 2.5 ms, total scan time = 3:30 min. SE parameters were: imaging FA = 90°, TR = 1200 ms, TE = 6.2 ms. SE was performed twice with opposing readout gradient polarities to acquire an eddy current-free transceive phase map (total scan time = 6:57 min). A FOV = 400 × 280 × 120 mm3 and resolution = 5 × 5 × 7.5 mm3 were used for both AFI and SE.
The duration of the entire MR examination for this patient was ∼50 min. This includes 5–10 min of patient preparation time and 27 min of standard diagnostic MRI. The additional MR-EPT protocol took 10 min.
CT
The planning CT image for external beam RT treatment (RT-CT) was obtained with a Philips Gemini TF 16 PET/CT scanner (Philips, Best, The Netherlands). The RT-CT image was acquired with FOV = 600 × 600 x 363 mm3 and resolution = 1.17 × 1.17 × 3.0 mm3 with the patient in supine position. As part of the clinical protocol, a bowel contrast agent was used during RT-CT scan session in order to allow bowel delineation and sparing during the following radiotherapy treatment planning.
The planning CT image for hyperthermia treatment (HT-CT) was acquired mimicking the hyperthermia treatment setup, i.e., with the patient in supine position on a water bolus and mattresses and with the intravaginal plastic pelotte for temperature monitoring during treatment in situ. The HT-CT image was acquired with a GE LightSpeed RT16 CT scanner (GE Healthcare, USA) with FOV = 650 × 650 × 680 mm3 and resolution = 1.27 × 1.27 × 2.5 mm3.
The durations of the RT-CT and HT-CT examinations were 10–15 min each. For logistic reasons, the HT-CT scan was performed in a separate imaging session after the first hyperthermia treatment. Both the RT-CT and HT-CT could be obtained within a single session; in that case, the HT-CT image should be acquired first, to avoid Hounsfield unit-based tissue segmentation (see next section) being complicated by the presence of bowel contrast.
Preparation of the patient model for HTP
Tissue geometry
The HT-CT scan was semi-automatically segmented based on Hounsfield units with an in-house developed software package, Plan2Heat [Citation68], resulting into fat, muscle, bone and air segmentations. Gross tumor volume (GTV), bladder and the intra-vaginal plastic pelotte were segmented manually (delineation time: ∼20 min).
Vascular structures with diameters ≥∼3 mm were included explicitly in the patient model. External/internal iliac arteries and veins, as well as small blood vessels (with diameter ≥∼3 mm), were manually delineated on the water-only Dixon image, by exploiting the high contrast of vessels with respect to surrounding tissues. Subsequently, these delineations were mapped onto the HT-CT image by deformable registration between the Dixon and CT images. The multi-modal EVolution registration algorithm [Citation71] was used, which maximizes edge alignment between the images being registered. This algorithm requires only contrast between anatomical tissues, preferably present in both image modalities, and assumes deformable/elastic tissues or volumetric tissue changes. The multi-modal EVolution registration algorithm provides a high accuracy in mapping contours between CT and MR images, as demonstrated in a previous abdominal imaging study [Citation72].
The contours of the registered vessels were slightly adjusted on the CT to match the vessel shape in the CT. Furthermore, the vessels registered on the CT only partially covered the patient’s pelvis volume due to the smaller FOV of the water-only Dixon image (∼100 mm in cranio-caudal direction) with respect to the FOV of the HT-CT scan. Thus, the aorta, the renal arteries, the left inferior mesenteric artery, and the common iliac arteries which were identifiable only on the HT-CT image were delineated manually. The common iliac vessels were then manually connected to the registered delineations of the subordinate iliac arteries and veins.
Manual vessel delineation on the MR water-only image takes about 1.5–2.5 h, whereas vessel delineation and adjustment on the HT-CT image may require 3–5 h. Exact times depend on the quality of the image contrast, the image FOV and resolution, the desired minimum diameter of the vascular structures to include in the patient model and the operator’s experience.
Electrical properties of tissues
Recently, Gavazzi et al. [Citation42] have developed a DL-EPT approach for pelvis conductivity mapping where a convolutional neural network infers the conductivity of pelvic tissues from |B1+| and ϕ± maps measured with MRI, after being trained on in silico dielectric pelvic models with realistic conductivity values at 128 MHz. For implementation details, validation and comparison with a conventional EPT method, the reader is referred to reference [Citation42]. The conductivity is reconstructed in ∼10 s on an NVIDIA Tesla P100 GPU with 16 GB RAM.
Electrical properties were assigned a single value for each tissue type in the segmented patient model. The conductivity of fat, muscle, bone, tumor and bladder corresponded to the median DL-EPT conductivity value calculated in manually delineated 3D regions of interest (ROIs) per tissue. Tissue ROI delineation took approximately 30 min. These conductivity values, measured at 128 MHz (the Larmor frequency of the 3T MR system), were decreased by 3% to obtain conductivity values at 70 MHz (the operating frequency of our hyperthermia system) [Citation40]. The tissue permittivity was taken from literature for two main reasons: first, retrieving the permittivity with EPT at 128 MHz has proven challenging for conventional EPT [Citation38,Citation73], and has not been shown yet in the pelvis with DL; second, even large changes in permittivity (e.g., in muscle) affect very little the temperatures predicted by HTP [Citation40]. The electrical properties of blood were also assigned from literature [Citation74,Citation75]. This is justified, since ex vivo electrical properties of blood can be expected to be rather similar to in vivo values. Electrical properties of tissues are reported in , along with thermal properties.
Table 1. Electrical and thermal properties of pelvic tissues at 70 MHz.
Thermal properties of tissues
Thermal properties of tissues were derived from the literature [Citation74,Citation76]. A constant perfusion model was used, with enhanced perfusion values to account for the effect of hyperthermic temperatures, based on experimental data [Citation77]. For the bladder a dedicated modeling approach was adopted. Recent studies have shown that modeling fluid convection has a large impact on the final temperature distribution, yielding more accurate hyperthermia treatment planning [Citation35,Citation50,Citation51,Citation78]. However, modeling convective heat transfer is computationally time-consuming at this moment, which makes it impractical for routine clinical use. A practical and time-efficient alternative is to increase the effective thermal conductivity of the fluid. This strategy was shown to approximate the thermal effect of fluid dynamics fairly well [Citation51,Citation78]. We included this strategy to account for convective heat transfer in the urinary bladder, which we modeled to have zero perfusion and thermal conductivity 10 times higher than the literature value [Citation35,Citation51,Citation78].
Hyperthermia treatment planning
Simulation of the electric field
The dielectric patient model was down-sampled to a resolution of 2.5 × 2.5 × 2.5 mm3 based on the winner-takes-all principle [Citation79]. The patient model was then placed within a model of the ALBA-4D hyperthermia system (Medlogix, Rome, Italy) [Citation80], consisting of 1 ring with 4 waveguides operating at 70 MHz (). Finite Difference Time Domain (FDTD) simulations of the electric field (E-field) were performed with perfectly matched layer boundary conditions [Citation81]. The E-field was computed separately for each antenna with unit amplitude and zero phase and takes 1–1.5 h per antenna on an NVIDIA GeForce GTX 760 GPU. The exact computation time depends on the computational volume, which is determined by the patient size. The electric field maps were used as input for the optimization of amplitude-phase antenna settings. Superposition can be used to calculate the SAR distributions for specified antenna settings.
Thermal modeling and temperature-based optimization
Thermal modeling was based on Pennes’ bioheat equation [Citation21]:
(1)
(1)
In EquationEquation (1)(1)
(1) the temperature change over time in the tissue lies on the left‐hand side, with ct (J kg−1 K−1) the tissue's specific heat per mass, ρt (kg m−3) its mass density, T (K) the temperature, and t (s) the time. On the right side of Equation (1) the first term represents the thermal conduction, with kt (W m−1 K−1) the tissue thermal conductivity; the second term models the perfusion, with cb (J kg−1 K−1) the specific heat per mass of blood, ω (kg m−3 s−1) the volumetric perfusion rate, and Tart the arterial blood temperature; Q (W m−3) is the metabolic heat rate, which is negligible during hyperthermia; the last term is the power absorption induced by the heating system, which is proportional to the SAR.
The delineated blood vessels, representing arteries and veins visible on the water-only Dixon and HT-CT images, have a large diameter (≥∼3mm) and thus also a high flow velocity (≥15 cm s−1(82)). This implies that these vessels do not reach thermal equilibrium with surrounding tissue when reaching and traversing the heated region [Citation82]. Therefore, modeling a constant temperature boundary condition is justified and a 37 °C temperature was imposed to the vessel delineations during the thermal computation.
Based on this thermal model, phase-amplitude antenna settings were optimized to realize a favorable 3D steady state temperature distribution for optimal tumor heating. For efficient calculations during optimization, temperature super-positioning was used to calculate the temperature distribution for any arbitrary set of phases and amplitudes by a vector-matrix-vector multiplication [Citation56,Citation57]. The vector represents the antenna settings and the matrix elements are pre-calculated by decomposition of EquationEquation (1)(1)
(1) . Quadratic programing was used to maximize the cost function, which was defined as the tumor T90 (i.e., the temperature exceeded in 90% of the tumor volume), while constraining the maximum temperature for normal tissues to 45 °C. Further constraints were imposed on the antenna contributions to avoid clinically unrealistic power settings: in particular, each antenna was set to deliver at least 10% and at most 40% of the total power. Calculation of the 11 ((N2+N)/2 + 1; N number of antennas, with N = 4) temperature distributions needed for superposition takes about 30 s each, using an NVIDIA GeForce GTX 760 GPU. The actual optimization takes less than 5 min on an Intel Xeon® E5-1650 v3 3.5 GHz running CentOS 6.8.
Biological modeling
Biological modeling was performed to obtain insight into the radiosensitizing effect induced by hyperthermia, assuming hyperthermia is applied for 1 h once a week, directly after external beam radiotherapy. This effect was expressed in terms of equivalent radiation dose EQDRT, i.e., the radiation dose yielding the same effect as the combined RT + HT treatment. The EQDRT calculation is based on an extended linear-quadratic (LQ) model, which includes temperature-dependent radiosensitivity parameters α(T) and β(T) [Citation58,Citation66]. Calculations were performed using the in-house developed software package, X-Term [Citation83], which determines the EQDRT per voxel from the radiotherapy dose distribution and the temperature distribution. Calculation of the EQDRT is described more in detail in the following sections.
Preparation
Because the equivalent radiation dose is calculated on a voxel-by-voxel basis from the RT dose distribution and from the temperature distribution, these two maps need to be matched on the same reference frame. Therefore, the RT-CT and HT-CT scans were registered with an intensity-based deformable image registration algorithm embedded in Velocity Medical Solutions (Varian Medical Systems, Palo Alto, CA). First, the bony anatomy was rigidly registered between both scans, followed by a deformable registration as described by Crezee et al. [Citation66]. The resulting deformation vector field was then applied to resample the RT dose distribution onto the HT-CT image. This process takes up to 0.5–1 h, including corrections and fine-tuning of the (structure-guided) deformable image registration.
Equivalent radiation dose calculation
The equivalent radiation dose for RT + HT treatments was calculated instantly, by using the following equation [Citation62]:
(2)
(2)
where α(T) and β(T) are the temperature-dependent radiosensitivity parameters, α(37) (Gy−1) and β(37) (Gy−2) are the radiosensitivity parameters at 37 °C, G is the Lea-Catcheside protraction factor accounting for repair during irradiation, D (Gy) is the total dose, dref (Gy) is the fraction dose of the RT treatment (i.e., 2 Gy), ΔS (cal/°C/mol) is the entropy of inactivation and ΔH is the inactivation energy of the critical rate-limiting molecules causing cell death.
The temperature-dependent tumor LQ parameters α and β were applied only within the GTV region, whereas α and β were kept at their normothermic value in the surrounding normal tissue regions. Similar equivalent dose calculations could be applied to normal tissue, but here we calculated only the EQDRT in the tumor region to evaluate the possible effect of the combined treatment. This was motivated by the fact that radiosensitization in normal tissue is much lower compared to the tumor region, not only when hyperthermia is applied within 1–4 h after radiotherapy [Citation64,Citation65], but also for time intervals shorter than 1 h [Citation84].
Similar to [Citation62], the temperature-dependent LQ parameters were obtained from extensive SiHa cervical cancer cell line experiments and increased exponentially with the temperature according to the following expressions
(3)
(3)
(4)
(4)
After inserting EquationEquations (3)(3)
(3) and Equation(4)
(4)
(4) within EquationEquation (2)
(2)
(2) and substituting β(37) = α(37)/[α(37)/β(37)], the equivalent radiation dose becomes:
(5)
(5)
where the values for each parameter in EquationEquation (5)
(5)
(5) are summarized in . The tumor α/β ratio at 37 °C was 17.9 Gy. A confidence interval for the equivalent dose was also calculated as explained by van Leeuwen et al. [Citation62].
Table 2. Parameters and 95% confidence intervals (within brackets) used in the EQDRT calculation expressed in Equation (Equation5(5)
(5) ).
HTP workflow results
HTP preparation results
presents the MR-based reconstruction of the patient-specific conductivity by using DL-EPT. The |B1+| and ϕ± maps given as input to the trained convolutional neural network are shown along with an MR magnitude image. These maps displayed characteristic patterns in the pelvis at 3T. The reconstructed DL-EPT conductivity map exhibited clear tissue conductivity contrasts, noise-robust estimation and sharp muscle/fat interfaces.
Figure 2. DL-EPT. Transverse and coronal cross-section of MR magnitude image from AFI sequence, |B1+| map, transceive phase (ϕ±) map, conductivity map obtained with DL-EPT (σDL). |B1+| and ϕ± maps are given as input to the trained network, which infers σDL. The tumor contour is shown in red. The tumor was delineated by a radiation oncologist on an ADC map (part of the diagnostic MRI protocol) [Citation85,Citation86]. The tumor delineation was then rigidly transferred to the frame of reference of the AFI image.
![Figure 2. DL-EPT. Transverse and coronal cross-section of MR magnitude image from AFI sequence, |B1+| map, transceive phase (ϕ±) map, conductivity map obtained with DL-EPT (σDL). |B1+| and ϕ± maps are given as input to the trained network, which infers σDL. The tumor contour is shown in red. The tumor was delineated by a radiation oncologist on an ADC map (part of the diagnostic MRI protocol) [Citation85,Citation86]. The tumor delineation was then rigidly transferred to the frame of reference of the AFI image.](/cms/asset/80934ca8-3647-4a3e-8572-eefc13b37ae5/ihyt_a_1806361_f0002_c.jpg)
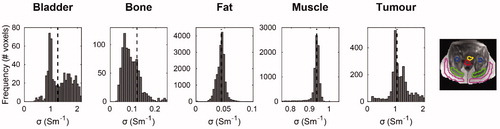
illustrates the conductivity histograms obtained within the 3D tissue ROIs. Narrow conductivity histograms were observed in muscle and fat, indicating a precise estimation. Median conductivity values for muscle and fat were 0.933 Sm−1 and 0.044 Sm−1, respectively. Moreover, muscle conductivity agreed with the in vivo mean value found in a previous study where 20 patients were analyzed with Helmholtz-based EPT [Citation87], whereas it was 29% higher than the tabulated value by Gabriel et al. [Citation75]. Fat conductivity was 19% higher than the literature value for non-infiltrated fat [Citation75]. also depicts the conductivity histograms for bladder, bone and tumor. Bone presented a median conductivity of 0.123 Sm−1, a value in between the average literature conductivity values of cortical and cancellous bone (0.067 Sm−1 vs 0.180 Sm−1, respectively) [Citation75]. However, the bone conductivity histogram was skewed toward lower values, possibly reflecting the heterogeneity of bone tissues. The tumor and bladder median conductivities were 1.050 Sm−1 and 1.255 Sm−1, respectively. A similar conductivity value for cervical cancer was found by Balidemaj et al. (1.02 Sm−1) [Citation87]. The small side tails of tumor conductivity histogram were likely caused by inaccuracies due to motion artifacts, which entered the 3D tumor delineation. Analogously, the broader histogram for bladder content could be explained by breathing ghosts and bowel motion artifacts. Hence, the bladder median conductivity was 28% lower than previously reported urine conductivity [Citation87,Citation88], but still close to the range reported for 10 different patients (1.35 Sm−1 to 2.60 Sm−1) [Citation87]. Such variation in bladder electrical conductivity predominantly depends on urine salinity concentration. Note that the median conductivity values obtained with DL-EPT were obtained at 128 MHz (the Larmor frequency at 3T MR proton imaging). These values were converted to values at 70 MHz and then assigned to the corresponding tissue in the patient model ().
Figure 3. Histograms of DL-based conductivity in pelvic tissues. Conductivity histograms are reported for each tissue along with the median value (black dashed line). Conductivity histograms were based on conductivity values within manually delineated tissue ROIs, depicted on the MR magnitude image (bladder: yellow; bone: blue; fat: magenta; muscle: green; tumor: red).
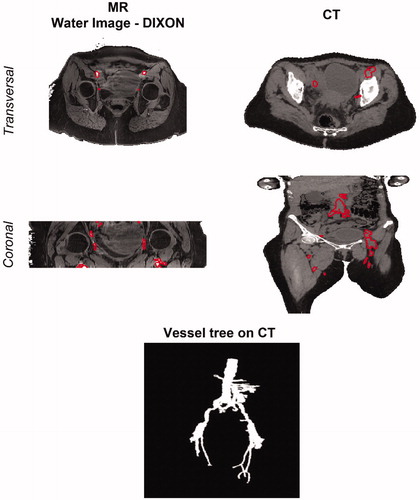
depicts the vessels reconstructed from the water-only Dixon MR image and the HT-CT scan. clearly shows that iliac arteries and veins have high MR signal intensity with respect to the surrounding muscle in the water-only image, which was therefore exploited for vessel delineation. This benefit of using water-only Dixon scan for vascular imaging was also demonstrated in a previous study, highlighting the better image quality and ∼30% higher vessel-to-background contrast provided by water-only Dixon-based contrast-enhanced MR angiography than a conventional MR angiographic technique [Citation89]. After the multi-modal deformable registration with EVolution registering the MR image to the HT-CT frame of reference, the iliac vessel contours were manually adjusted to accurately fit the vessel shape on the HT-CT image. This is represented in the transverse view of HT-CT image. The coronal views of both MR and CT scans in also reveal the different cranio-caudal dimensions in both scans. Because of this, vessels that were outside the MR image FOV, such as the aorta, the renal arteries and common iliac arteries, were manually delineated directly on the HT-CT image. A 3D rendering of the final reconstructed vessel tree is also reported in .
Figure 4. Vessel definition on MR and CT scans. Vessel delineations are shown on the transverse and coronal cross-sections of water image generated with the DIXON method (left) and on the HT-CT scan (right). These delineations were manually adjusted after MR to CT registration (not shown). At the bottom, a 3D rendering of the final vessel tree is shown.
Hyperthermia treatment planning results
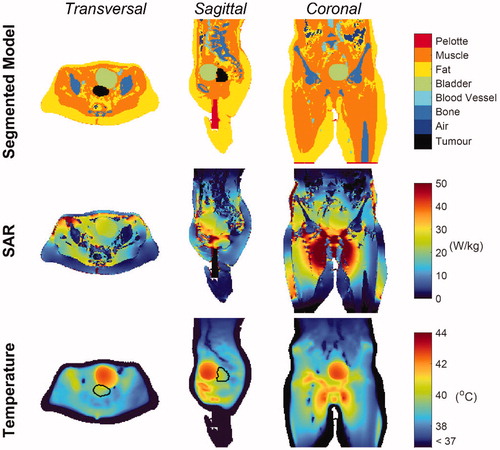
shows the SAR and temperature distribution after temperature-based optimization. The optimized phase settings were top/bottom/left/right = 0°/–23°/92°/72°, and the power ratios were top/bottom/left/right = 0.23/0.10/0.28/0.39. The total power absorbed by the patient was 314 W, of which ∼3.9 W were absorbed by the bladder (149 mL volume), whereas the tumor absorbed 1.77 W (82.6 mL volume). This is caused by the higher bladder electrical conductivity with respect to the tumor conductivity. As far as temperature is concerned, the predicted tumor T90, T50 and T10 (i.e., the temperature exceeded in 90%, 50% and 10% of the tumor volume) were 39.0 °C, 39.8 °C and 40.5 °C respectively. The temperature map shows that the average bladder temperature was 42.15 °C, which is 2.35 °C higher than the average tumor temperature, reflecting the negative impact of urine on the achieved tumor thermal dose. Higher tumor temperatures could not be achieved without overheating normal tissue, since hot spots were arising outside the target region, in particular at muscle/bone and/or muscle/fat interfaces (see, for example, close to the ischium in the sagittal view of ), where tissue temperatures reached the 45 °C constraint. Moreover, the cold tracks induced by the flowing blood in the vessels did not influence the tumor temperature because of their distant location. However, the external iliac artery and vein, as well as the internal iliac artery (visible in the transverse view), contributed to lowering the temperature in the bladder periphery. Furthermore, the external iliac vessels, running down toward the legs (coronal view of ), affected the temperature of potential hot spots occurring around the pubic bone.
Figure 5. Patient model, SAR and Temperature maps. Transverse, sagittal and coronal cross-sections of the segmented model (first row), showing all the tissues included in the patient model, the SAR distribution (second row) and the temperature distribution (third row) in the patient. The GTV contour is indicated in black.
Biological modeling results
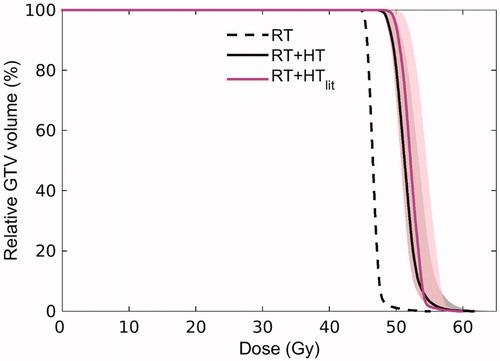
displays the dose distribution related to external beam radiotherapy treatment alone, the temperature distribution and the equivalent radiation dose distribution for the combined treatment (with an assumed fraction dose of 2 Gy, as for RT). The mean RT dose in the GTV was 46.6 Gy. The equivalent radiation dose to the tumor increased on average by 5 Gy when hyperthermia was added, leading to a mean dose value of 51.4 Gy. This 10% increase in dose is attributed to the relatively mild temperature increase achieved in the tumor during HTP. The Dose Volume Histogram (DVH, ) in the GTV indicates that the D95% (i.e., the dose obtained in 95% of the tumor volume) was 45.45 Gy for radiotherapy alone, and 48.9 Gy for the combined RT + HT treatment, with an uncertainty range of 48.6 − 50.3 Gy reflecting the uncertainty in temperature-dependent LQ parameters. The D0.01 cc (the maximum dose received by at least 0.01 cm3 of the tumor volume) was 53.8 Gy and 60.8 Gy for RT alone and RT + HT combination, respectively. In addition, displays the DVH of the effective biological equivalent dose predicted when a routine HTP workflow was performed (RT + HTlit, with literature-based electrical and thermal properties [Citation74–76], bladder modeled as perfused muscle tissue, and no inclusion of blood vessels). This literature-based prediction led to a ∼1 Gy higher mean dose with respect to the advanced RT + HT prediction. The D95% and D0.01 cc for RT + HTlit were 50.0 Gy (uncertainty range: 48.6 − 51.8 Gy) and 58.9 Gy, respectively. The impact of the advanced elements introduced in the proposed HTP workflow is thus also reflected in the predicted equivalent dose. The dose to normal tissue and organs at risk did not change, since radiosensitization in normal tissue was considered negligible [Citation84].
Figure 6. Equivalent dose distributions in radiotherapy and radiotherapy plus hyperthermia. Transverse, sagittal and coronal cross-sections of the radiotherapy (RT) dose distribution (first row), the temperature distribution obtained from hyperthermia treatment planning (second row), and the equivalent dose distribution derived from combining radiotherapy and hyperthermia (third row). The equivalent radiation dose was calculated within the GTV, which is denoted with blue contours. NB: The high-dose region adjacent to the GTV reflects an additional lymph node boost (with mean dose of 54.59 Gy).
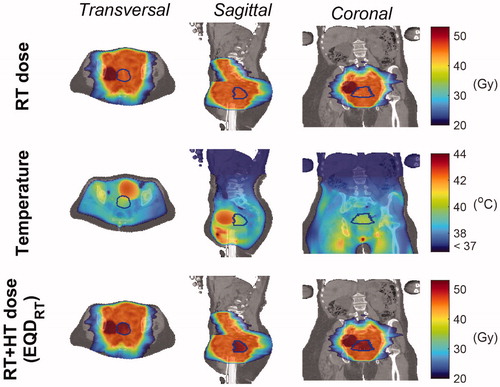
Figure 7. Dose Volume Histogram (DVH) reflecting the dose distribution in the GTV for radiotherapy alone (RT, dashed black line) and the combined radiotherapy and hyperthermia treatment as predicted with the advanced HTP workflow (RT + HT, solid black line). For comparison, the DVH predicted using a routine HTP workflow based on literature dielectric properties is also shown (RT + HTlit, solid magenta line). The shaded area around the DVH for RT + HT and RT + HTlit corresponds to confidence intervals resulting from uncertainty in LQ parameters.
Discussion
We presented a framework for advanced patient-specific hyperthermia treatment planning (HTP) in which we integrated, for the first time, the clinical HTP workflow with all currently available advanced features of HTP: (i) in vivo MR-based conductivity information, (ii) heat transfer modeling of the vasculature, (iii) modeling of heat convection in urine and (iv) modeling of the hyperthermia treatment effect in terms of equivalent radiation dose. As demonstrated in earlier research papers [Citation34,Citation40,Citation48,Citation49,Citation58,Citation66,Citation83], each of these advanced modeling steps influences HTP predictions and ultimately contributes to reliable patient-specific treatment planning. This makes it important to include all developed advanced features into a single clinical workflow. The presented framework fulfilled this scope without excessive additional computational effort compared to the current state-of-art planning procedure. The E-field calculations of 4–6 h are unchanged and remain the most time-consuming computational part of the workflow. Also the computation time of other parts of the HTP process, e.g., temperature based optimization, did not change. For this advanced workflow, an additional 10 min of MRI scanning time is required for the MR-EPT protocol and the following DL-EPT reconstruction takes only a few seconds. Manual delineation of tissues to generate the dielectric model (i.e., for tissue segmentation on the HT-CT image or for DL-EPT median value calculation) did not exceed 30 min. Manual delineation of blood vessels is more time-consuming (on the order of hours) and varies predominantly with image quality, desired vessel diameter and operator’s experience. These manual delineations could be automated in the future, as discussed later. The workflow was illustrated for locoregional hyperthermia of a cervical cancer patient, but a similar pipeline including patient-specific conductivity reconstruction, vasculature modeling and equivalent dose calculation could also be applied for superficial hyperthermia treatment planning.
Including DL-EPT to obtain the patient-specific conductivity represents an important progress toward reliable hyperthermia treatment planning. We have recently shown that DL-based pelvis conductivity maps display high reconstruction accuracy at tissue interfaces, robustness against noise in measured B1+ maps and acceptable sensitivity to conductivity variations [Citation42]. In contrast to DL-EPT, the present state-of-art method for in vivo pelvis conductivity mapping [Citation38,Citation40,Citation87], i.e., conventional Helmholtz-based EPT (H-EPT), suffers from high sensitivity to noise and so-called ‘boundary errors’ at tissue interfaces, which limit its practical use. Among the numerous EPT approaches [Citation38], inverse methods such as CSI-EPT demonstrated reduced noise sensitivity and good accuracy, also at tissue boundaries, in pelvis conductivity simulations [Citation90,Citation91]; nonetheless, in vivo pelvis conductivity maps have not been reported yet. In principle, electrical properties could be obtained with any EPT reconstruction method, but the quality of conductivity maps demonstrated in vivo by DL-EPT is appealing for direct use as input to HTP, thus eventually eliminating the need for Hounsfield-based thresholding of CT scans to create the patient dielectric model. Nevertheless, direct input to HTP is not yet feasible because bowel peristalsis, breathing and pulsatile flow occurring in the pelvis during the MRI acquisition produce imaging artifacts which affect the |B1+| and ϕ± maps (). At locations where these artifacts appear, DL-EPT retrieves an erroneous conductivity value. To date, no EPT method is capable to counterbalance these motion-induced artifacts. Therefore, we implemented a hybrid alternative where median DL-EPT conductivity values were calculated in tissue 3D ROIs and then assigned to a Hounsfield unit-based segmented model. A deterministic EPT approach as the one suggested by Bevacqua et al. [Citation91], where the tissue segmentation serves as representation basis of the unknown electrical properties, may conceptually be simpler than our hybrid strategy if only median EPT values are desired. In this regard, a convolutional neural network could probably be trained to combine segmentation with learning of an average EPT value for each tissue, for the specific use in HTP. Note, however, that our DL-EPT method was originally developed as an EPT approach aiming at a wide range of clinical scopes [Citation38], with HTP as one of the possible applications. Thus, our network was trained to directly reconstruct the whole 3D electrical conductivity distribution. To aim for full 3D conductivity maps as input for HTP, future work in DL-EPT should focus on compensating motion patterns. Furthermore, an in vivo pelvis permittivity map would also be necessary for fully MR-based HTP. EPT-based in vivo permittivity mapping has been proven more challenging than conductivity mapping in the frequency range of 64–128 MHz, corresponding to clinical MR field strengths [Citation38,Citation73]. However, preliminary results from a recent study [Citation41] have shown that a good quality permittivity map could be reconstructed in the brain at 3T with a DL-EPT method. Further research is required to establish whether DL-EPT could reproduce good quality permittivity maps also in the pelvis.
A previous study [Citation40] showed that the true in vivo electrical conductivity values, which are higher than literature values used in clinical HTP, have a profound impact on the power absorbed by the tumor and its achieved thermal dose with optimized antenna settings. This demonstrates the clinical relevance of using DL-EPT in vivo conductivity values in this workflow (). In particular, the tumor SAR was ∼25% lower than the bladder SAR, which was caused by the bladder having a 20% higher electrical conductivity than the tumor. In the present example, the bladder absorbed twice as much power as the tumor, due to its relatively large volume and high conductivity. For a conservative fixed bladder electrical conductivity (1.80 Sm−1), Balidemaj et al. [Citation40] showed that increasing bladder volumes negatively affected the tumor SAR. They further reported that the resulting predicted tumor temperature T90 was diminished by 0.57–1.37 °C from the temperature predicted with the conventional HTP for bladder volumes between 33–497 mL. Considering that similar conditions apply for the patient examined here (augmented bladder electrical conductivity and 149 mL of volume), a negative impact on the tumor temperature of a similar magnitude is expected. Moreover, the in vivo electrical conductivity of the surrounding muscle tissue, which differed by −8% from that of tumor, negatively influenced the tumor SAR. The resulting decrease in tumor temperature can be estimated around 0.40 °C [Citation40].
Another important advantage of using patient-specific conductivity information yielding trustworthy SAR predictions is that the location and magnitude of hot spots will be predicted more accurately, since temperature is correlated with SAR. The electrical conductivity of muscle, being higher than the average literature value, contributed to increase the dielectric contrast at muscle/fat and/or muscle/bone interfaces, therefore aggravating the severity of energy deposition at these locations. illustrates that high SAR values, resulting in potential hot spots, occurred at such tissue interfaces outside the heated region. These predicted arising hot spots, reaching the 45 °C constraint for normal tissue during phase-amplitude optimization, limited a further increase of the tumor temperature.
The effect of convective heat transfer in the urinary bladder was integrated to account for its impact on the tumor temperature distribution, owing to the bladder’s vicinity to the cervical tumor. For a clinically acceptable computation time, fluid heat convection in the urine was accounted for by a higher bladder thermal conductivity, which we set to a value 10 times higher than the literature value. Previous works on bladder HTP showed that using a ten-fold thermal conductivity value approximates the thermal effect of fluid heat convection that can be modeled by a computationally intensive thermophysical model of the bladder [Citation35,Citation78]. As a result of this improved modeling, the mean predicted bladder temperature increases with respect to current clinical HT plans where the bladder is typically modeled as solid perfused tissue. Modeling the bladder as solid tissue was shown to yield errors of 3.8 °C in the median predicted bladder temperature [Citation35,Citation40]. Furthermore, 1 °C temperature differences can be expected also at 1–1.5 cm distance from the bladder [Citation35,Citation50], therefore affecting adjacent tissues such as the cervical tumor and muscle. Considering the realistic bladder electrical conductivity and convection, hyperthermia delivery for cervical cancer patients could be expected to benefit from an empty bladder. A previous study modeling only the electrical in vivo conductivity of urine already suggested this [Citation40]. However, during a 1-h treatment some bladder filling would be unavoidable.
Incorporating a patient-specific network of large blood vessels traversing the heated region in Pennes’ bioheat transfer model represents a further advance in HTP. The Pennes model is commonly used and proved to be valuable but neglects the direction of blood flow and the local heat exchange of vasculature, resulting in deviations in temperature estimations of ∼1–2 °C [Citation34,Citation57]. Explicit modeling of large blood vessels is thus required for accurate temperature predictions. Here we combined manual delineations of blood vessels ≥ ∼3 mm in the pelvic region based on the contrast of water-only Dixon scan with vessel delineations outside the pelvic region directly on the HT-CT image to enable modeling of the largest thermally significant arteries and veins. Further improvements would also include smaller thermally significant blood vessels using the more sophisticated DIVA thermal model [Citation46,Citation47]. This requires a patient-specific discrete vasculature model, knowledge on blood flowrates and directionality and a 3D perfusion map in input. Hence, for future routine applications, additional vessel visualization methods should be acquired, for example angiograms which are typically realized with contrast-enhanced MRI, and (automatic) reconstruction of vessel networks from these angiograms should be incorporated in the clinical workflow [Citation49]. If necessary, available realistic vessel generation software could be used to update incomplete vessel branches automatically [Citation92]. Moreover, flow imaging could be included in the workflow, for example within the MRI protocol, to retrieve functional information on blood flow parameters. Ideally, a quantitative 3D map of the perfusion in the patient would also be required for accurate temperature predictions. It was previously shown that a 25% uncertainty in perfusion parameters of muscle and fat affected the optimized tumor T90 by 0.2–0.4 °C [Citation31]. Furthermore, van den Berg et al. [Citation34] found that the temperature in the prostate was ∼1–2 °C lower when a 3D heterogeneous perfusion was modeled, compared to a homogeneous perfusion model. However, perfusion maps acquired with perfusion CT or MR imaging techniques cannot be obtained during hyperthermia and therefore the increase in perfusion levels at hyperthermic conditions, which can be up to a factor of 10 [Citation93], is not accounted for. Alternatively, thermal decay measurements with standard clinical thermometry probes could be used to estimate the perfusion level [Citation94], but these measurements can only be performed off treatment (i.e., while the power is off, e.g., right after the treatment). The disadvantage of thermal decay measurements is that they provide an indication of the perfusion only at a certain point in time and at the specific locations of these probes (generally within the bladder, the cervix and the rectum).
A temperature-based optimization strategy was applied to predict the antenna settings for optimal tumor heating, while limiting the incidence of treatment-limiting hot spots [Citation54,Citation56,Citation57]. However, the proposed workflow can also be combined with SAR-based optimization, if desired [Citation16,Citation23,Citation24,Citation52,Citation53]. SAR-based optimization techniques generally yield a lower computational cost compared to temperature-based optimization techniques, since the latter typically involve many temperature evaluations for which the Pennes bioheat equation should be solved. Nevertheless, an efficient temperature-based optimization method based on superposition of pre-calculated temperature distributions [Citation56] was used in this workflow. This method allows for temperature-optimization within a few minutes. Here, a temperature-based optimization was preferred as it accounts for physiologically important cooling mechanisms such as perfusion and conduction, as well as bolus cooling. Previous HTP studies in the pelvic region demonstrated that temperature-based optimization is robust to perfusion uncertainty [Citation25] and that simulated temperature changes after phase-amplitude steering correlate with measured temperature changes during HT [Citation95]. Moreover, since tumor temperature and treatment-limiting normal tissue hot spots, which are related to treatment effect, are inherently accounted in the optimization cost function, a temperature-based optimization was also a straightforward choice in light of the subsequent biological modeling.
Biological modeling of the combined radiotherapy and hyperthermia treatment is a beneficial step toward a patient-tailored treatment plan for this treatment combination. We assessed the radiosensitization induced by hyperthermia in terms of equivalent dose by exploiting the extended LQ model [Citation58]. The equivalent dose was calculated for the GTV only, because the radiosensitization in the tumor was shown to be higher than in normal tissue for hyperthermia delivery immediately after radiotherapy [Citation84]. shows that the tumor temperature achieved in this patient escalated the equivalent radiation dose in the GTV by, on average, an extra 5 Gy. Besides, indicates that the advanced modeling steps influencing HTP predictions, as discussed above, also influence the predicted equivalent dose. The hyperthermic radiosensitization effect is reflected in the temperature-dependent α and β parameters. These parameters, obtained from extensive cell line experiments [Citation62], relate to the inhibiting effect of hyperthermia on DNA damage repair and to direct cell kill, but do not account for other mechanisms such as reoxygenation [Citation62,Citation65]. Further (in vivo) research is needed to acquire knowledge on how these physiological effects influence the α and β values [Citation84]. Moreover, LQ parameters for normal tissues should still be investigated, for example by extensive in vivo measurements at different radiation doses, temperature and time intervals [Citation84], especially for organs at risk such as bladder, rectum and bowels. A previous planning study concluded that the hyperthermic radiosensitization in these organs at risk is negligible compared to the tumor region, also because the temperatures were lower [Citation84]. However, a significantly higher bladder temperature is predicted by the advanced HTP. Although in clinical studies for pelvic tumors no enhanced bladder toxicity is observed [Citation96], these higher temperatures might influence the equivalent bladder dose to some extent. In the future, reliable equivalent dose computations in both tumor and normal tissues and prediction of the potential cytotoxicity to organs at risk would become possible with more extensive knowledge on the behavior of LQ parameters under hyperthermic conditions. A next, though very challenging, step in patient-tailored treatment planning would be to directly optimize the equivalent dose distribution of the combined treatment, rather than optimizing the individual treatment modalities separately.
Even though there are still some uncertainties and challenges left in HTP, as discussed above, the advancements achieved with this sophisticated HTP framework will improve the reliability of pretreatment plans compared to the present clinical HTP procedure. Therefore, they are also likely to improve the treatment quality. A previous study demonstrated that, even for clinical pretreatment plans which are only qualitatively reliable, the treatment plan can be adapted on-line in response to patient’s hot spot-induced complaints without significantly diminishing the thermal dose to the tumor [Citation97]. This treatment plan re-optimization is referred to as adaptive HTP. Adaptive HTP can be valuable for both hyperthermia treatments guided by standard thermometry probe feedback and locoregional MR-guided hyperthermia (e.g., using the BSD Sigma Eye MR or the Sigma 30 MR applicator). Instead of thermometry probe feedback, MR-guided hyperthermia uses more detailed MR thermometry information to re-optimize treatment settings. This is feasible for large fixated tumors, as shown for example for treatment of extremity sarcomas [Citation98]. In case of pelvic hyperthermia, nevertheless, MR thermometry information is less reliable due to motion artifacts and standard probe thermometry feedback is still preferable [Citation99]. Ongoing research aims to close the gap toward quantitative temperature monitoring in the pelvic region [Citation100]. In general, it is expected that adaptive HTP will benefit from advanced pretreatment plans, since these plans more accurately predict the magnitude and locations of potential hot spots, which means that the pretreatment plan will be closer to the real optimum. Furthermore, the correlation between the simulated and measured temperature changes during hyperthermia as a result of phase-amplitude steering would be improved [Citation95], which will render adaptive HTP strategies more effective.
Conclusion
A patient-tailored advanced hyperthermia treatment planning workflow was presented, integrating the following novel research elements in the current clinical practice of hyperthermia treatment planning: (i) patient-specific in vivo tissue conductivity reconstructed with DL-EPT from MR measurements; (ii) patient-specific modeling of the thermal influence of large blood vessels; (iii) modeling of the effects of heat convection in urine; (iv) patient-specific assessment of the radiosensitizing effect induced by hyperthermia in equivalent radiotherapy dose. The proposed workflow ensures more accurate predictions of the power deposition and temperature in the patient, as well as a more realistic prognosis of the expected tumor control (through the equivalent radiation dose of the combined treatment) without requiring excessive computational effort.
Acknowledgments
The authors would like to thank Thomas Willigenburg, MD (Radiotherapy Department, University Medical Center Utrecht) for assistance with blood vessel delineation.
Disclosure statement
No potential conflict of interest was reported by the author(s).
Additional information
Funding
References
- Franckena M, Stalpers LJA, Koper PCM, et al. Long-term improvement in treatment outcome after radiotherapy and hyperthermia in locoregionally advanced cervix cancer: an update of the dutch deep hyperthermia trial. Int J Radiat Oncol Biol Phys. 2008;70(4):1176–1182.
- Datta NR, Stutz E, Gomez S, et al. Efficacy and safety evaluation of the various therapeutic options in locally advanced cervix cancer: a systematic review and network meta-analysis of randomized clinical trials. Int J Radiat Oncol Biol Phys. 2019;103(2):411–437.
- Datta NR, Puric E, Klingbiel D, et al. Hyperthermia and radiation therapy in locoregional recurrent breast cancers: a systematic review and meta-analysis. Int J Radiat Oncol Biol Phys. 2016;94(5):1073–1087.
- Colombo R, Salonia A, Leib Z, et al. Long-term outcomes of a randomized controlled trial comparing thermochemotherapy with mitomycin-C alone as adjuvant treatment for non-muscle-invasive bladder cancer (NMIBC). BJU International. 2011;107(6):912–918.
- Issels RD, Lindner LH, Verweij J, et al. Effect of neoadjuvant chemotherapy plus regional hyperthermia on long-term outcomes among patients with localized high-risk soft tissue sarcoma: the EORTC 62961-ESHO 95 randomized clinical trial. JAMA Oncol. 2018;4(4):483–492.
- Sapareto SA, Dewey WC. Thermal dose determination in cancer therapy. Int J Radiat Oncol Biol Phys. 1984;10(6):787–800.
- Van Rhoon GC, Samaras T, Yarmolenko PS, et al. CEM43 °C thermal dose thresholds: a potential guide for magnetic resonance radiofrequency exposure levels. Eur Radiol. 2013;23(8):2215–2227.
- Dewey WC, Hopwood LE, Sapareto SA, et al. Cellular responses to combinations of hyperthermia and radiation. Radiology. 1977;123(2):463–474.
- Dewey WC, Thrall DE, Gillette EL. Hyperthermia and radiation-A selective thermal effect on chronically hypoxic tumor cells in vivo. Int J Radiat Oncol Biol Phys. 1977;2(1–2):99–103.
- Franckena M, Fatehi D, de Bruijne M, et al. Hyperthermia dose-effect relationship in 420 patients with cervical cancer treated with combined radiotherapy and hyperthermia. Eur J Cancer. 2009;45(11):1969–1978.
- Bruggmoser G, Bauchowitz S, Canters R, et al. Guideline for the clinical application, documentation and analysis of clinical studies for regional deep hyperthermia. Strahlenther Onkol. 2012;188(S2):198–211.
- Stauffer PR. Evolving technology for thermal therapy of cancer. Int J Hyperther. 2005;21(8):731–744.
- Bruggmoser G, Bauchowitz S, Canters R, et al. Quality assurance for clinical studies in regional deep hyperthermia. Strahlenther Onkol. 2011;187(10):605–610.
- Winter L, Özerdem C, Hoffmann W, et al. Design and evaluation of a hybrid radiofrequency applicator for magnetic resonance imaging and rf induced hyperthermia: electromagnetic field simulations up to 14.0 Tesla and Proof-of-Concept at 7.0 Tesla. Yacoub E, editor. PLoS One. 2013;8(4):e61661.
- Paulides MM, Verduijn GM, Van Holthe N. Status quo and directions in deep head and neck hyperthermia. Radiat Oncol. 2016;11(1):21.
- Wust P, Seebass M, Nadobny J, et al. Simulation studies promote technological development of radiofrequency phased array hyperthermia. Int J Hyperthermia. 2009;25(7):517–528.
- Canters RAM, Paulides MM, Franckena M, et al. Implementation of treatment planning in the routine clinical procedure of regional hyperthermia treatment of cervical cancer: An overview and the Rotterdam experience. Int J Hyperthermia. 2012;28(6):570–581.
- Kok HP, Wust P, Stauffer P, et al. Current state of the art of regional hyperthermia treatment planning: a review. Radiat Oncol. 2015;10(1):196.
- Verhaart RF, Fortunati V, Verduijn GM, et al. The relevance of MRI for patient modeling in head and neck hyperthermia treatment planning: a comparison of CT and CT-MRI based tissue segmentation on simulated temperature. Med Phys. 2014;41(12):123302
- Wust P, Gellermann J, Beier J, et al. Evaluation of segmentation algorithms for generation of patient models in radiofrequency hyperthermia. Phys Med Biol. 1998;43(11):3295–3307.
- Pennes HH. Analysis of tissue and arterial blood temperatures in the resting human forearm. J Appl Physiol. 1948;1(2):93–122.
- Köhler T, Maass P, Wust P, et al. A fast algorithm to find optimal controls of multiantenna applicators in regional hyperthermia. Phys Med Biol. 2001;46(9):2503–2514.
- Bardati F, Borrani A, Gerardino A, et al. SAR optimization in a phased array radiofrequency hyperthermia system. specific absorption rate. IEEE Trans Biomed Eng. 1995;42(12):1201–1207.
- Wiersma J, Van Maarseveen RAM, Van Dijk JDP. A flexible optimization tool for hyperthermia treatments with RF phased array systems. Int J Hyperthermia. 2002;18(2):73–85.
- de Greef M, Kok HP, Correia D, et al. Optimization in hyperthermia treatment planning: The impact of tissue perfusion uncertainty. Med Phys. 2010;37(9):4540–4550.
- van Haaren PMA, Kok HP, van den Berg CAT, et al. On verification of hyperthermia treatment planning for cervical carcinoma patients. Int J Hyperthermia. 2007;23(3):303–314.
- Sreenivasa G, Gellermann J, Rau B, et al. Clinical use of the hyperthermia treatment planning system HyperPlan to predict effectiveness and toxicity. Int J Radiat Oncol Biol Phys. 2003;55(2):407–419.
- Franckena M, Canters R, Termorshuizen F, et al. Clinical implementation of hyperthermia treatment planning guided steering: a cross over trial to assess its current contribution to treatment quality. Int J Hyperthermia. 2010;26(2):145–157.
- Kok HP, Ciampa S, de Kroon-Oldenhof R, et al. Toward online adaptive hyperthermia treatment planning: correlation between measured and simulated specific absorption rate changes caused by phase steering in patients. Int J Radiat Oncol Biol Phys. 2014;90(2):438–445.
- van de Kamer JB, van Wieringen N, De Leeuw AAC, et al. The significance of accurate dielectric tissue data for hyperthermia treatment planning. Int J Hyperthermia. 2001;17(2):123–142.
- De Greef M, Kok HP, Correia D, et al. Uncertainty in hyperthermia treatment planning: the need for robust system design. Phys Med Biol. 2011;56(11):3233–3250.
- Canters RAM, Paulides MM, Franckena M, et al. Benefit of replacing the Sigma-60 by the Sigma-Eye applicator: a Monte Carlo-based uncertainty analysis. Strahlenther Onkol. 2013;189(1):74–80.
- Van Leeuwen GMJ, Kotte ANTJ, Raaymakers BW, et al. Temperature simulations in tissue with a realistic computer generated vessel network. Phys Med Biol. 2000;45(4):1035–1049.
- Van Den Berg CAT, Van De Kamer JB, De Leeuw AAC, et al. Towards patient specific thermal modelling of the prostate. Phys Med Biol. 2006;51(4):809–825.
- Schooneveldt G, Kok HP, Bakker A, et al. Clinical validation of a novel thermophysical bladder model designed to improve the accuracy of hyperthermia treatment planning in the pelvic region. Int J Hyperthermia. 2018;35(1):383–397.
- Farace P, Pontalti R, Cristoforetti L, et al. An automated method for mapping human tissue permittivities by MRI in hyperthermia treatment planning. Phys Med Biol. 1997;42(11):2159–2174.
- Mazzurana M, Sandrini L, Vaccari A, et al. A semi-automatic method for developing an anthropomorphic numerical model of dielectric anatomy by MRI. Phys Med Biol. 2003;48(19):3157–3170.
- Katscher U, van den Berg CAT. Electric properties tomography: biochemical, physical and technical background, evaluation and clinical applications. NMR Biomed. 2017;30(8):e3729.
- Liu J, Wang Y, Katscher U, et al. Electrical properties tomography based on $B_{{1}}$ maps in MRI: principles, applications, and challenges. IEEE Trans Biomed Eng. 2017;64(11):2515–2530.
- Balidemaj E, Kok HP, Schooneveldt G, et al. Hyperthermia treatment planning for cervical cancer patients based on electrical conductivity tissue properties acquired in vivo with EPT at 3 T MRI. Int J Hyperthermia. 2016;32(5):558–568.
- Mandija S, Meliadò EF, Huttinga NRF, et al. Opening a new window on MR-based electrical properties tomography with deep learning. Sci Rep. 2019;9(1):8895.
- Gavazzi S, den Berg CAT, Savenije MHF, et al. Deep learning‐based reconstruction of in vivo pelvis conductivity with a 3D patch‐based convolutional neural network trained on simulated MR data. Magn Reson Med. 2020;84(5):2772–2787.
- Lagendijk JJW. The influence of bloodflow in large vessels on the temperature distribution in hyperthermia. Phys Med Biol. 1982;27(1):17–23.
- Mooibroek J, Lagendijk JJW. A fast and simple algorithm for the calculation of convective heat transfer by large vessels in three-dimensional inhomogeneous tissues. IEEE Trans Biomed Eng. 1991;38(5):490–501.
- Moros EG, Straube B, Myerson RJ, et al. Finite difference vascular model for 3-D cancer therapy with hyperthermia. In: Roemer RB, editor. Advances in Bioheat and Mass Transfer 199. New Orleans, Louisiana: ASME Winter Annual Meeting; 1993. p. 107–111.
- Kotte A, Van Leeuwen G, De Bree J, et al. A description of discrete vessel segments in thermal modelling of tissues. Phys Med Biol. 1996;41(5):865–884.
- Kotte ANTJ, Van Leeuwen GMJ, Lagendijk JJW. Modelling the thermal impact of a discrete vessel tree. Phys Med Biol. 1999;44(1):57–74.
- Raaymakers BW, Crezee J, Lagendijk JJW. Modelling individual temperature profiles from an isolated perfused bovine tongue. Phys Med Biol. 2000;45(3):765–780.
- Sumser K, Neufeld E, Verhaart RF, et al. Feasibility and relevance of discrete vasculature modeling in routine hyperthermia treatment planning. Int J Hyperther. 2019;36(1):800–810.
- Schooneveldt G, Kok HP, Balidemaj E, et al. Improving hyperthermia treatment planning for the pelvis by accurate fluid modeling. Med Phys. 2016;43(10):5442–5452.
- Schooneveldt G, Trefná HD, Persson M, et al. Hyperthermia treatment planning including convective flow in cerebrospinal fluid for brain tumour hyperthermia treatment using a novel dedicated paediatric brain applicator. Cancers. 2019;11(8):1183.
- Canters RAM, Franckena M, Van Der Zee J, et al. Complaint-adaptive power density optimization as a tool for HTP-guided steering in deep hyperthermia treatment of pelvic tumors. Phys Med Biol. 2008;53(23):6799–6820.
- Bellizzi GG, Drizdal T, Van Rhoon GC, et al. The potential of constrained SAR focusing for hyperthermia treatment planning: analysis for the head & neck region. Phys Med Biol. 2018;64(1):015013
- Kok HP, Van Haaren PMA, Van De Kamer JB, et al. High-resolution temperature-based optimization for hyperthermia treatment planning. Phys Med Biol. 2005;50(13):3127–3141.
- Cheng KS, Stakhursky V, Craciunescu OI, et al. Fast temperature optimization of multi-source hyperthermia applicators with reduced-order modeling of ‘virtual sources’. Phys Med Biol. 2008;53(6):1619–1635.
- Das SK, Clegg ST, Samulski TV. Computational techniques for fast hyperthermia temperature optimization. Med Phys. 1999;26(2):319–328.
- Kok HP, Van Den Berg CAT, Bel A, et al. Fast thermal simulations and temperature optimization for hyperthermia treatment planning, including realistic 3D vessel networks. Med Phys. 2013;40(10):103303–103315.
- Kok HP, Crezee J, Franken NAP, et al. Quantifying the combined effect of radiation therapy and hyperthermia in terms of equivalent dose distributions. Int J Radiat Oncol Biol Phys. 2014;88(3):739–745.
- Pajonk F, Van Ophoven A, McBride WH. Hyperthermia-induced proteasome inhibition and loss of androgen receptor expression in human prostate cancer cells. Cancer Res. 2005;65(11):4836–4843.
- Franken NAP, Oei AL, Kok HP, et al. Cell survival and radiosensitisation: modulation of the linear and quadratic parameters of the LQ model. Int J Oncol. 2013;42(5):1501–1515.
- Myerson RJ, Roti Roti JL, Moros EG, et al. Modelling heat-induced radiosensitization: clinical implications. Int J Hyperthermia. 2004;20(2):201–212.
- van Leeuwen CM, Oei AL, ten Cate R, et al. Measurement and analysis of the impact of time-interval, temperature and radiation dose on tumour cell survival and its application in thermoradiotherapy plan evaluation. Int J Hyperthermia. 2018;34(1):30–38.
- Datta NR, Bodis S. Hyperthermia with radiotherapy reduces tumour alpha/beta: insights from trials of thermoradiotherapy vs radiotherapy alone. Radiother Oncol. 2019;138:1–8.
- Overgaard J. Simultaneous and sequential hyperthermia and radiation treatment of an experimental tumor and its surrounding normal tissue in vivo. Int J Radiat Oncol Biol Phys. 1980;6(11):1507–1517.
- Crezee H, Van Leeuwen CM, Oei AL, et al. Thermoradiotherapy planning: integration in routine clinical practice. Int J Hyperthermia. 2016;32(1):41–49.
- Crezee J, van Leeuwen CM, Oei AL, et al. Biological modelling of the radiation dose escalation effect of regional hyperthermia in cervical cancer. Radiat Oncol. 2016;11(1):14–19.
- Kok HP, Van Dijk I, Crama K, et al. Re-irradiation plus hyperthermia for recurrent pediatric sarcoma; a simulation study to investigate feasibility. Int J Oncol. 2019;54(1):209–218.
- Kok HP, Kotte ANTJ, Crezee J. Planning, optimisation and evaluation of hyperthermia treatments. Int J Hyperthermia. 2017;33(6):593–607.
- Eggers H, Brendel B, Duijndam A, et al. Dual-echo Dixon imaging with flexible choice of echo times. Magn Reson Med. 2011;65(1):96–107.
- Yarnykh VL. Actual flip-angle imaging in the pulsed steady state: a method for rapid three-dimensional mapping of the transmitted radiofrequency field. Magn Reson Med. 2007;57(1):192–200.
- Denis De Senneville B, Zachiu C, Ries M, et al. EVolution: an edge-based variational method for non-rigid multi-modal image registration. Phys Med Biol. 2016;61(20):7377–7396.
- Zachiu C, De Senneville BD, Moonen CTW, et al. Anatomically plausible models and quality assurance criteria for online mono- and multi-modal medical image registration. Phys Med Biol. 2018;63(15):155016.
- Gavazzi S, van den Berg CAT, Sbrizzi A, et al. Accuracy and precision of electrical permittivity mapping at 3T: the impact of three B1+ mapping techniques. Magn Reson Med. 2019;81(6):3628–3642.
- Hasgall P, Di Gennaro F, Baumgartner C, et al. IT’IS Database for thermal and electromagnetic parameters of biological tissues; [cited 2020 Aug 04]. Available from: https://itis.swiss/virtual-population/tissue-properties/overview/. 2018. Version 4.0.
- Gabriel C. Compilation of the dielectric properties of body tissues at RF and microwave frequencies. London (UK): King’s College; 1996.
- Rossmanna C, Haemmerich D. Review of temperature dependence of thermal properties, dielectric properties, and perfusion of biological tissues at hyperthermic and ablation temperatures. Crit Rev Biomed Eng. 2014;42(6):467–492.
- Cheng K-S, Yuan Y, Li Z, et al. The performance of a reduced-order adaptive controller when used in multi-antenna hyperthermia treatments with nonlinear temperature-dependent perfusion. Phys Med Biol. 2009;54(7):1979–1995.
- Yuan Y, Cheng KS, Craciunescu OI, et al. Utility of treatment planning for thermochemotherapy treatment of nonmuscle invasive bladder carcinoma. Med Phys. 2012;39(3):1170–1181.
- James BJ, Sullivan DM. Direct use of CT scans for hyperthermia treatment planning. IEEE Trans Biomed Eng. 1992;39(8):845–851.
- Zweije R, Kok HP, Bakker A, et al. Technical and Clinical Evaluation of the ALBA-4D 70MHz Loco-Regional Hyperthermia System. In: 2018 48th European Microwave Conference, EuMC 2018. Institute of Electrical and Electronics Engineers Inc.; 2018. p. 328–331.
- Berenger JP. A perfectly matched layer for the absorption of electromagnetic waves. Comput Phys. 1994;114(2):185–200.
- Crezee J, Lagendijk JJ. Temperature uniformity during hyperthermia: the impact of large vessels. Phys Med Biol. 1992;37(6):1321–1337.
- van Leeuwen CM, Crezee J, Oei AL, et al. 3D radiobiological evaluation of combined radiotherapy and hyperthermia treatments. Int J Hyperthermia. 2017;33(2):160–169.
- van Leeuwen CM, Crezee J, Oei AL, et al. The effect of time interval between radiotherapy and hyperthermia on planned equivalent radiation dose. Int J Hyperthermia. 2018;34(7):901–909.
- de Boer P, Spijkerboer AM, Bleeker MCG, et al. Prospective validation of craniocaudal tumour size on MR imaging compared to histoPAthology in patients with uterine cervical cancer: the MPAC study. Clin Transl Radiat Oncol. 2019;18:9–15.
- Lim K, Small W, Portelance L, et al. Consensus guidelines for delineation of clinical target volume for intensity-modulated pelvic radiotherapy for the definitive treatment of cervix cancer. Int J Radiat Oncol Biol Phys. 2011;79(2):348–355.
- Balidemaj E, de Boer P, van Lier A, et al. In vivo electric conductivity of cervical cancer patients based on B1+ maps at 3T MRI. Phys Med Biol. 2016;61(4):1596–1607.
- Peyman A, Gabriel C. Dielectric properties of porcine glands, gonads and body fluids. Phys Med Biol. 2012;57(19):N339–44.
- Leiner T, Habets J, Versluis B, et al. Subtractionless first-pass single contrast medium dose peripheral MR angiography using two-point Dixon fat suppression. Eur Radiol. 2013;23(8):2228–2235.
- Balidemaj E, van den Berg CAT, Trinks J, et al. CSI-EPT: a contrast source inversion approach for improved MRI-based electric properties tomography. IEEE Trans Med Imaging. 2015;34(9):1788–1796.
- Bevacqua MT, Bellizzi GG, Crocco L, et al. A method for quantitative imaging of electrical properties of human tissues from only amplitude electromagnetic data. Inverse Prob. 2019;35(2):025006.
- van Leeuwen GMJ, Kotte ANTJ, Lagendijk JJW. A flexible algorithm for construction of 3-D vessel networks for use in thermal modeling. IEEE Trans Biomed Eng. 1998;45(5):596–604.
- Song CW. Effect of local hyperthermia on blood flow and microenvironment: a review. Cancer Res. 1984;44(10 suppl):4721s–44730.
- Waterman FM, Nerlinger RE, Moylan DJ, et al. Response of human tumor blood flow to local hyperthermia. Int J Radiat Oncol Biol Phys. 1987;13(1):75–82.
- Kok HP, Schooneveldt G, Bakker A, et al. Predictive value of simulated SAR and temperature for changes in measured temperature after phase-amplitude steering during locoregional hyperthermia treatments. Int J Hyperthermia. 2018;35(1):330–339.
- van der Zee J, González González D, van Rhoon GC, et al. Comparison of radiotherapy alone with radiotherapy plus hyperthermia in locally advanced pelvic tumours: a prospective, randomised, multicentre trial. Dutch Deep Hyperthermia Group. Lancet. 2000;355(9210):1119–1125.
- Kok HP, Korshuize-van Straten L, Bakker A, et al. Feasibility of on-line temperature-based hyperthermia treatment planning to improve tumour temperatures during locoregional hyperthermia. Int J Hyperthermia. 2018;34(7):1082–1091.
- Stakhursky VL, Arabe O, Cheng K-S, et al. Real-time MRI-guided hyperthermia treatment using a fast adaptive algorithm. Phys Med Biol. 2009;54(7):2131–2145.
- Datta NR, Kok HP, Crezee H, et al. Integrating loco-regional hyperthermia into the current oncology practice: SWOT and TOWS analyses. Front Oncol. 2020;10:819.
- Winter L, Oberacker E, Paul K, et al. Magnetic resonance thermometry: methodology, pitfalls and practical solutions. Int J Hyperthermia. 2016;32(1):63–75.