
 ?Mathematical formulae have been encoded as MathML and are displayed in this HTML version using MathJax in order to improve their display. Uncheck the box to turn MathJax off. This feature requires Javascript. Click on a formula to zoom.
Abstract
Background
Varicose veins are a common disease that may significantly affect quality of life. Different approaches are currently used in clinical practice to treat this pathology.
Materials and methods
In thermal therapy (radiofrequency or laser therapy), the vein is directly heated to a high temperature to induce vein wall coagulation, and the heat induces denaturation of the intramural collagen, which results macroscopically in vein shrinkage. Thermal vein shrinkage is a physical indicator of the efficiency of endovenous treatment. High-intensity focused ultrasound (HIFU) is a noninvasive technique that can thermally coagulate vein walls and induce vein shrinkage. In this study, we evaluated the vein shrinkage induced in vivo by extracorporeal HIFU ablation of sheep veins: six lateral saphenous veins (3.4mm mean diameter) were sonicated for 8 s with 3MHz continuous waves. Ultrasound imaging was performed before and immediately post-HIFU to quantify the HIFU-induced shrinkage.
Results
Luminal constriction was observed in 100% (6/6) of the treated veins. The immediate findings showed a mean diameter constriction of 53%. The experimental HIFU-induced shrinkage data were used to validate a numerical model developed to predict the thermally induced vein contraction during HIFU treatment.
Conclusions
This model is based on the use of the k-wave library and published contraction rates of vessels immersed in hot water baths. The simulation results agreed well with those of in vivo experiments, showing a mean percent difference of 5%. The numerical model could thus be a valuable tool for optimizing ultrasound parameters as functions of the vein diameter, and future clinical trials are anticipated.
1. Introduction
Varicose veins are a common pathology that can lead to many different health complications if left untreated, including blood clots, skin hyperpigmentation, or even ulcers; thus, they significantly affect the quality of life of patients. Several treatment modalities are currently available to reduce symptoms and prevent complications, including surgery, sclerotherapy, and endovenous thermotherapies such as radiofrequency ablation (RFA) or endovenous laser ablation. During endovenous thermotherapy, a catheter or an optic fiber is inserted into the vein and generates a high temperature (>70 °C) to damage the vein wall thermally [Citation1,Citation2]. These methods can be technically challenging since catheter insertion into and maneuvering in a tortuous vein may be arduous [Citation3]. In this context, high-intensity focused ultrasound (HIFU) is a promising alternative means of treating varicose veins as it can induce tissue coagulation noninvasively and reduce operator dependence. In particular, a previous study (described in a companion paper [Citation4]) demonstrated that the temperatures induced at the vein wall during HIFU ablation are similar to those induced by RFA in clinics.
Vein heating has been demonstrated to induce vein wall contraction regardless of the thermal modality (laser therapy or RFA) [Citation5]. Thermal vein shrinkage according to the HIFU energy has been reported in animal models [Citation6–14]. In particular, it was demonstrated in vivo that HIFU could constrict small veins (1.0–1.3 mm), with up to 50% diameter reduction. However, the vein wall reduction following HIFU ablation of veins with a diameter closer to that of human varicose veins (≥3 mm) has never been evaluated. In this study, we investigated the vein wall shrinkage induced by HIFU in medium-sized sheep veins (mean pretreatment diameter of 4.8 ± 1.0 mm).
The simulation of thermal damage induced following HIFU treatment in blood vessels has already been proposed [Citation15]. Nevertheless, such simulations have only accounted for the vascular thermal damage, without modeling the vein wall constriction. This shortcoming may cause underestimation of the thermal damage to the vein, resulting in overtreatment and longer treatment times. In this report, we introduce a numerical model accounting for the lumen narrowing after HIFU thermal exposure. In addition, simulations of actual HIFU treatments performed on sheep are presented and the results are compared with experimental measurements.
2. Materials and methods
2.1. Animal experiments
Six sheep (22–29 months old, 51–65 kg, female) were enrolled in this study. The protocol was approved by the ethical committee for animal experiments ANSES/ENVA/UPEC (agreement number CE16/2017022116542356), and the experiments were performed according to the 2010/63 European directive. Each animal had its left lateral saphenous veins treated with the Echopulse® device (Theraclion, Malakoff, France). The Echopulse® system consists of a motorized treatment head including a piezocomposite therapy transducer and a confocal linear imaging probe connected to an echograph for real-time treatment monitoring. The acoustic field is generated by a spherical therapy transducer (radius of curvature: 38 mm, outer diameter: 56 mm) operating at 3 MHz. A coupling balloon filled with degassed liquid was used to ensure acoustic coupling between the transducers and target. The liquid was cooled to 10 °C during the entire procedure to prevent transducer overheating and skin burns.
Prior to treatment, the sheep were anesthetized with intravenous injection of ketamine (5 mg/kg, Ketamine 1000, Virbac, France) and Diazepam (0.5–1 mg/kg, Diazepam TVM5, TVM Lab, France). Anesthesia was maintained by endotracheal intubation: oxygen (100%) and isoflurane (2–2.5%, Vetflurane, Virbac, France). Intravenous morphine (0.1–0.2 mg/kg, Chlorhydrate de Morphine, Renaudin, France) was injected 5 min before sonication to prevent pain. Electrocardiography, blood pressure, body core temperature, end-tidal CO2, O2 saturation, and respiratory rate and pattern monitoring were performed continuously during the procedure. The animals were installed on the surgical table in the lateral decubitus position to access the lateral saphenous vein, and the left hind limb was slightly elevated to help clear blood from the vein. The hind limbs were shaved with a hair trimmer (Aesculap® Favorita II, B-Braun, Germany), and the thighs were then depilated with a hair-removing cream (Klorane, France). The objectives of this hair-removal procedure were to limit the presence of air bubbles and to improve the ultrasound transmission through the skin.
The ultrasound examination included both B-mode and duplex imaging, which were performed with an Aixplorer® ultrasound system (SuperSonic Imagine, Aix-en-Provence, France) to map and identify the portion of the vein to be sonicated. The diameter of the target vein segment was measured before treatment with the hind leg elevated.
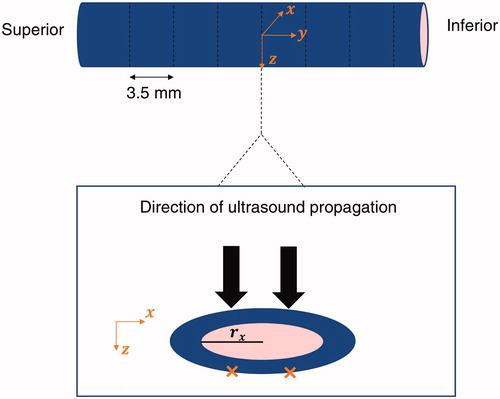
The HIFU transducer was first manually positioned on top of the region of interest (the lateral saphenous vein, ) and then robotically adjusted to position the focus on the exposure spots. Six veins with a mean pretreatment diameter of 4.8 ± 1.0 mm (mean ± SD) were exposed at nine sites along the longitudinal vein axis with a spacing of 3.5 mm between subsequent sites. In each slice, two symmetrical pulses were delivered across the transversal axis of the vein for 8 s and with a derated acoustic power of 45 W at the target. The corresponding acoustic power of the transducer was 61 ± 15 W (mean ± SD) depending on the depth of the target ().
Figure 1. Illustration of the HIFU transducer positioning on the site of interest.
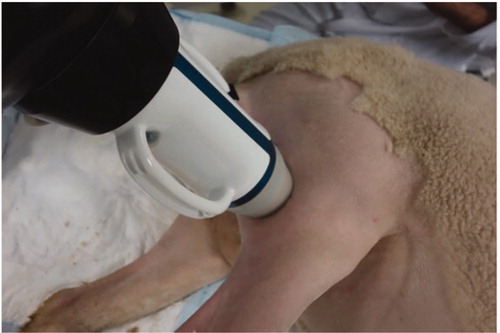
Figure 2. Illustration of the HIFU exposures (orange crosses) on a site and definition of the frame of reference with respect to the anatomy.
Between the two pulses the cooling time was automatically set by the Echopulse software to allow the skin to cool down, according to the acoustic power delivered. The mean cooling time was 30 ± 9 s. During sonication and the cooling interval between the two pulses, the blood flow was stopped by mechanical compression, which was induced by increasing the pressure inside the coupling balloon.
Immediately following the HIFU procedure, ultrasound images were acquired to measure the vein diameter of the treated segment. Vein diameter contraction was quantified as follows:
where
is the diameter of the treated vein segment and
is the diameter of the same vein segment before the HIFU exposures. Both diameters were measured with the hind limb elevated to have measurements performed with the same positioning of the limb.
At the end of the procedure, the animals were euthanized by an intravenous injection of pentobarbital (25 ml, Dolethal, Vetoquinol).
2.2. Numerical model
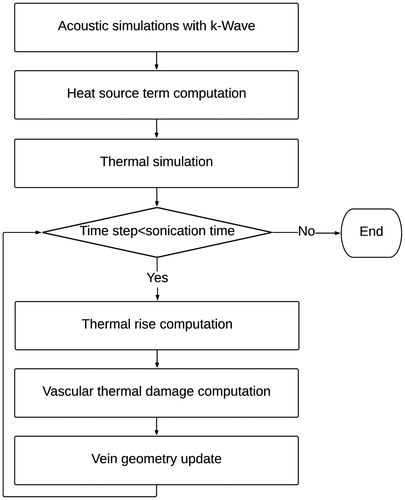
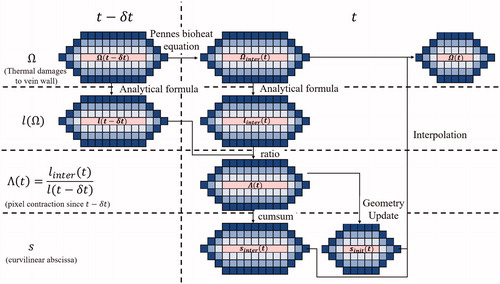
The mathematical shrinkage model was implemented in MATLAB (MathWorks, Inc., Natick, MA) and was based on dynamic computation of the vascular thermal damage estimated from the thermal increase induced by the HIFU pulses. An overview of the methodology is provided in .
Figure 3. Flowchart of the methodology followed to model the vein wall shrinkage. The ultrasound propagation is first modeled using the k-wave library. From the acoustic simulations, the temperature evolution in tissues is dynamically estimated during the treatment. Based on the updated temperature field, the thermal damage to the vein is computed and the geometry of the vein is updated.
2.2.1. Simulations
The experimentally employed treatment configuration was modeled numerically: two 8 s pulses delivered in continuous wave mode at 60 W acoustic power with the focus located 16 mm under the skin were used as input in the simulations. This situation corresponds to the treatment of one transverse slice of the vein.
The hole in the therapy transducer for the imaging probe broke the axial symmetry of the beam, making three-dimensional simulations necessary. Hereinafter, denotes the main propagation axis, pointing from the transducer to the focus, and
corresponds to the axis of the imaging probe, oriented from the left to right in the image.
is the cross-product of
and
so the
frame is orthonormal and right-handed ().
2.2.1.1. Acoustic simulations
The acoustic simulations were performed first, using the k-wave 1.2 library [Citation16,Citation17]. k-wave solves the first-order partial differential equations for momentum conservation, mass conservation, and the pressure–density relation using a first-order pseudo-spectral method. The use of a k-space pseudo-spectral method is convenient for 3D simulations as it allows for a coarser space grid and larger time steps compared with classic finite difference methods [Citation18]. Moreover, this model has been validated at high power levels [Citation19]. Despite the efficiency of the mathematical approach, a full 3D nonlinear simulation of the HIFU field is too costly in terms of memory. We therefore used a “layer by layer” approach [Citation20] to reduce the memory requirements. This approach entails dividing the computational grid into successive layers along the -axis with decreasing width and increasing spatial and temporal resolution. The ultrasound propagation is then successively simulated in each of these subdomains. In this study, ultrasound propagation was simulated from the transducer to 18 mm beyond the focus. The ultrasound waves successively propagated through the cooling liquid contained in the balloon fixed to the transducer, superficial tissues (skin, subcutaneous fat, and muscle), and muscle. The cooling liquid, superficial tissues, and muscle were modeled as homogenous media with the acoustic properties listed in .
Table 1. Acoustic properties of tissues used for simulations.
The tissue properties were assumed to remain constant during the procedure. Nonlinearities were modeled up to the fourth harmonic, with a spatial resolution of up to 62 µm. The Courant–Friedrichs–Lewy (CFL) coefficient was set to 0.5, resulting in a time step of 20 ns for the finest resolution. A perfectly matched layer was used to avoid reflections at the boundaries of the domain. The pressure amplitude source term was computed as:
where
is the pressure amplitude,
is the acoustic power,
is the acoustic density,
is the speed of sound, and
is the surface of the transducer.
and
were respectively set to
and
2.2.1.2. Thermal simulation
Based on the pressure field calculated by k-wave, the heat source term was computed as described in [Citation20]. The variation of the attenuation with frequency was set to 1.1 [Citation28]. The heat source term was multiplied times the ratio between the acoustic attenuations of the vein and muscle (see ) at each time step of the thermal simulation considering the updated vein geometry. In the simulations, the vein was considered compressed and the blood flow eliminated.
2.2.1.2.1. Modeling of vein contraction
To reproduce the in vivo experiments on sheep veins, simulations were run with actual pretreatment diameters d. The vein wall thickness was set to 0.5 mm in all of the simulations, which is the typical vein thickness reported in the literature [Citation29]. At the beginning of the treatment, the vein was modeled as an elliptic cylinder along the axis ().
The length of the semi-minor axis in the direction is denoted
and was set to 100 µm. The length of the semi-major axis
was computed based on the Euler approximation of the circumference of an ellipse:
The vein circumference was dynamically modified to account for the shrinkage induced by collagen denaturation. was held constant, and
was dynamically adapted to the local vein circumference in each plane. As described previously, we simulated only one plane in this study, where symmetrical exposure was delivered. To model the HIFU treatment that led to asymmetric shrinkage, we considered the left and right halves of the vein as two independent half-ellipses with semi-major axes
and
respectively. The continuity of the vein wall was guaranteed by the fact that
was considered constant.
2.2.1.2.2. Temperature rise simulation
The thermal simulations were based on an augmented Pennes bioheat equation:
where
correspond to the density, specific heat, and temperature, respectively; the subscripts
and
refer to tissue and blood, respectively;
is the perfusion coefficient;
is the tissue conductivity;
is the blood temperature; and
is the heat source term resulting from the power deposited by the acoustic wave. The blood temperature
was set to
The equation was solved in 3D using a first-order Euler explicit finite difference scheme with MATLAB® R2018b. The grid size was 38 × 38 × 25 mm. The time step was 50 ms, and the spatial step was 200 μm.
2.2.1.2.3. Vascular wall damage
The thermal damage to the vessel was computed with the vascular thermal damage model described by Agah [Citation30]. By considering the denaturation of collagen as a first-order reaction, the damage was modeled using the general Arrhenius equation:
where
(
t) is the damage parameter;
and
are the concentrations of the undamaged molecules at the beginning of the treatment and at time
respectively;
is the frequency factor
is the activation energy;
is the universal gas constant; and
is the temperature.
and
were set to 5.6 × 1063 s−1 and 430 kJ mol−1, respectively, according to [Citation30]. The degree of vessel damage was assessed using
t), where
defines the first noticeable irreversible damage and formally corresponds to the denaturation of 63% of the native proteins [Citation30]. The threshold for vascular coagulation was set to
5, which formally corresponds to denaturation of 99% of the collagen.
2.2.2. Vein wall constriction
2.2.2.1. Shrinkage model
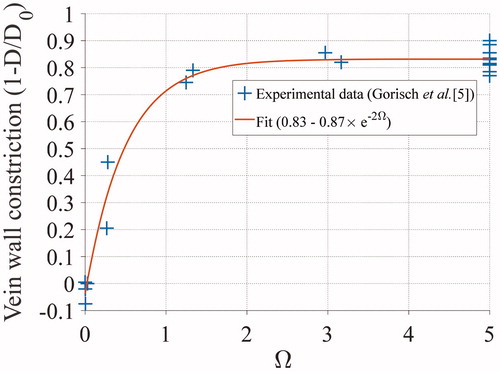
Shrinkage during heating brings distant parts of the vein wall toward the focal spot. Gorisch et al. [Citation5] reported the relative diameters of veins after 16 s of heating at different temperatures. A subset of these exposures was translated into vascular damage values () according to the formula reported by Agah et al. [Citation30]. The data were then fitted with an exponential curve to derive an analytical formula for the diameter shrinkage with respect to
(). The fitting curve was found to be:
Figure 4. Evolution of the vein contraction with Ω.
2.2.2.2. Model implementation
The vein wall was considered to be composed of several unitary voxels, each having a unitary length. With the parameters used in this study (vein wall thickness and spatial resolution), the initial vein wall mask consisted of three concentric rings of pixels.
The shrinkage was implemented based on the computation of in each voxel belonging to the vein wall. The contraction of each pixel was computed, and the vein diameter for the next time step was estimated. The updated vein wall mask was then populated with interpolated values of
based on the curvilinear coordinates along the vein wall.
The implementation of the diameter shrinkage was based on the use of a weighted curvilinear abscissa along the cross-section denoted as
represents the cumulative sum of the normalized lengths of each pixel along each vein wall ring relative to the previous time. The algorithm used for diameter shrinkage implementation is illustrated in and described further in the appendix (Algorithm for the implementation of the vein shrinkage).
Figure 5. Illustration of thermal damage and vein wall constriction process. The vein wall is represented here by concentric rings of blue pixels, having each a unitary length. Based on the updated temperature field modeled by the Pennes bioheat equation, the thermal damage within each voxel is updated and the vein wall constriction (
) is computed. The weighed curvilinear abscissa is then calculated and updated. Based on the special mean of the contracted pixel length, the new venous circumference is computed and the new geometry of the vein is updated. Finally, the thermal damage within each pixel of the updated vein wall is computed.
The shrinkage model is a function of which depends on the time dependence of the temperature. The whole time course of the sonication was accounted for in our model, including the 30 s pause between the two consecutive sonication pulses.
2.2.2.3. Estimation of the error induced by the Euler approximation
The impact of the Euler approximation used in this numerical model to estimate the vein wall shrinkage was also investigated. This approximation is an overestimation of the ellipse diameter and was reported to feature at most a positive error of 11% for elongated ellipses [Citation31]. To assess the maximum impact of this error on the final result of the shrinkage rate, the simulations were rerun considering a positive error of 11% for the length of the semi-major axis The shrinkage rates were then compared to the ones firstly estimated.
3. Results
3.1. Animal experiments
The measured pretreatment and post-treatment vein diameters () as well as the diameter contraction measurements are reported in . Hind limb elevation decreased the lumen diameter for all the sheep veins (). When the limbs were lowered, the vein diameters were comprised between 3.8 mm and 6.2 mm with a mean pretreatment diameter 4.8 ± 1.0 mm. When the hind limbs were elevated, the vein diameters ranged between 2.3 and 5.2 mm with a mean diameter of 3.4 ± 1.1 mm. The variability in the lumen diameter decrease between the samples may be related to the venous tone specific to each animal.
Figure 6. Post-treatment measurements of vein diameters.
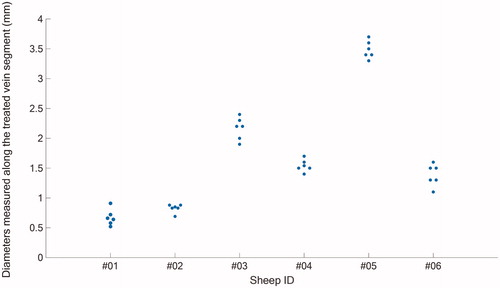
Table 2. Vein diameter reduction measurements.
All of the treated veins showed sonographically visible diameter reduction.
The mean diameter reduction compared to the pretreatment diameter was 53% ± 14%. In particular, for four of the six treated veins with an interrupted blood flow during sonications, a vein wall shrinkage of 58–68% was observed while a lower shrinkage rate was observed for two cases (32% and 40%) treated with a remaining blood flow.
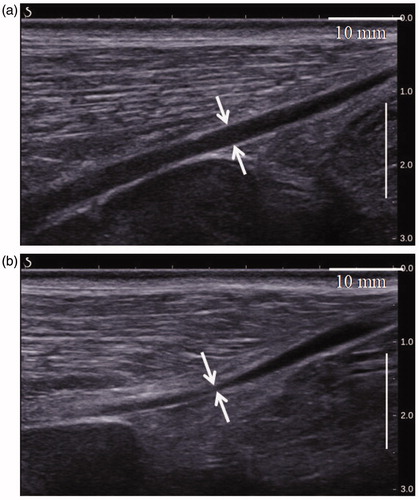
illustrates an example of vascular shrinkage observed immediately following the HIFU procedure. The luminal cross-section of the venous segment treated by HIFU () and indicated by the two white arrows is clearly smaller than the one measured before the treatment (, white arrows). Here, the cross-section of the vein lumen treated with HIFU is 0.5 mm and 2.6 mm in the control vein lumen. In addition to the vein wall constriction, the treated vein segment showed a blurred vascular contour. This latter is also an indicator of vein wall coagulation and has often been observed after HIFU treatments [Citation32]. No complications occurred during exposure.
Figure 7. Ultrasound images of a sheep vein before (a) and immediately after HIFU treatment (b) showing luminal shrinkage and blurred vascular contours.
3.2. Numerical model
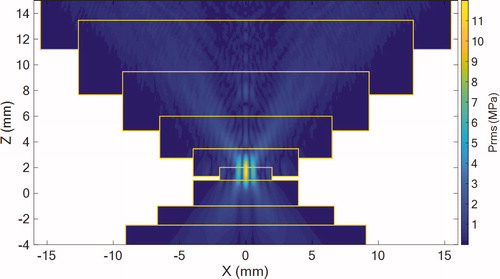
shows the distribution of the root-mean-square acoustic pressure (prms) field in the plane simulated using the “layer by layer” approach.
Figure 8. Simulated rms pressure field of the geometrical model in the plane. Pressure is expressed in MPa. Yellow rectangles represent the limits of the subsequent layers.
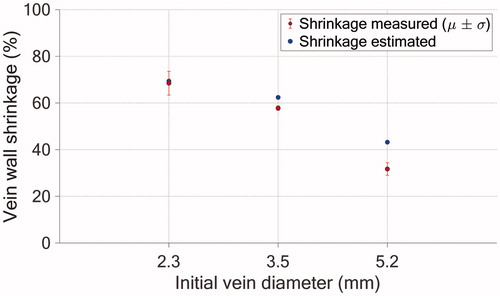
As displayed in , there were some differences in the pretreatment diameters of the veins. Simulations were run for initial pretreatment diameters of 2.3, 3.5, and 5.2 mm. shows the final shrinkage and thermal damage on the shrunken vein wall after HIFU exposure. illustrates the comparison between the estimated and measured vein wall shrinkage for the considered initial pretreatment diameters.
Figure 9. Shrinkage and thermal damage simulations for veins with an initial pretreatment diameter of 2.3 mm (top row), 3.5 mm (middle row) and 5.2 mm (bottom raw) after exposures of the vein. Left column: before treatment. Left column: after treatment. Note that the number of “yellow” pixels does not reflect the percentage of vein wall which is damaged since these pixels correspond to shrunken part of the vein wall. Typically, for the 5.2 mm vein, the coagulated pixels correspond to about 50 % of the initial vein wall.
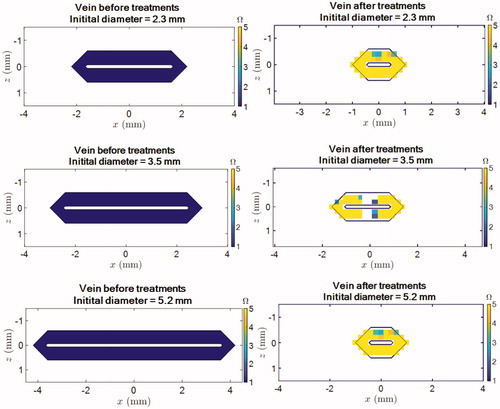
Figure 10. Comparison between the simulated (blue) and experimental (red) luminal shrinkage in one vein cross-section. The error bars refer to the experimental standard deviations () and means are represented by the red circles.
For the 2.3, 3.5, and 5.2 mm vein diameters, the percent shrinkage errors induced by the Euler approximation were found to lead to 0.06%, −3.3%, and −10.6%, respectively. Euler’s approximation leads thus to a limited error, calculated to be maximum 10.6% of the simulated shrinkage. provides all the results.
Table 3. Relative errors for the three diameters studied.
4. Discussion
In the present study, in vivo experiments were performed for the first time to investigate the vein wall shrinkage induced by HIFU treatment on medium-sized sheep veins. The veins were repeatedly sonicated for 8 s at a mean acoustic power of 61 ± 15 W, and the shrinkage was evaluated with B-mode imaging after the HIFU procedures.
At the end of the treatment, all of the treated veins (6/6) showed luminal constriction. The immediate findings revealed a mean vein wall contraction of 53 ± 14%. Exposing the vein to extracorporeal HIFU pulses placed across the circumference of the posterior vein wall can, thus, reduce the diameter of medium-sized veins (mean diameter: 3.4 ± 1.1 mm).
Vein shrinkage is known to be an early indicator of the long-term efficacy of venous ablation in varicose vein management. Proebstle et al. [Citation33] reported successful endovenous thermal ablation when inducing immediate vein wall shrinkage of at least 50%. Given the amount of diameter contraction in this study, the treatment parameters were deemed relevant for the ablation of medium-size veins (mean diameter of 3.4 ± 1.1 mm in our study).
According to the existing literature, only Yang et al. [Citation6] have investigated the shrinkage related to the application of HIFU to blood vessels with a medium diameter in vivo (rabbit aorta diameter: 3 mm). Unfortunately, after exposure to 4 MHz HIFU for 5 s, the rabbit aorta showed no evidence of constriction. We hypothesize that no shrinkage was observed due to blood flow cooling, which acted as a heat sink. In our study, the veins that showed less shrinkage (36% on average, range 32–40%) were the ones treated with the biggest diameters (3.7 mm and 5.2 mm). Nevertheless, they also correspond to cases in which the blood flow could not have been fully stopped during pulses. We hypothesize that this lower shrinkage rate observed for those two cases is more attributable to the presence of the blood flow during pulses that could have prevented to properly coagulate the vein wall. Besides, this can be supported by the marked difference of shrinkage rate between the veins of 3.5 and 3.7 mm that respectively showed a vein wall constriction of 58% and 40%. On the contrary, shrinkage of 58% or more was observed in the veins treated with complete interruption of blood flow during sonication. The difference in shrinkage rates observed in our study between the veins treated without blood flow and those with residual flow may be explained by a difference in temperature elevation at the vein wall during treatment. In this study, the temperature increase during sonication was not measured, but thermocouples were inserted in situ in another study [Citation4] to record the vein wall temperature during HIFU vein ablation in a dedicated cohort of sheep veins. The thermocouple measurements demonstrated that the mean peak temperature achieved in the intima for compressed veins (90 ± 7 °C) is similar to those achieved in RFA [Citation1,Citation2,Citation34].
In addition to stopping the blood flow, vein compression decreases the vein diameter, which may also increase the vein wall coverage. The lowest shrinkage (32%) was obtained without vein compression. Vein compression with full blood flow interruption during pulses should therefore be considered for future clinical application.
As shrinkage is related to the amount of thermal damage, the venous contraction due to thermal energy can be used to set and subsequently adapt treatment parameters for HIFU venous ablation. It is worth noting here that in endoluminal treatment, venous shrinkage is often considered for treatment evaluation and even for the procedure progress, as it is sometimes advised to advance the catheter/fiber to another vein segment once venous shrinkage is observed [Citation35,Citation36]. For the largest vein treated in this study (5.2 mm diameter), the shrinkage was significantly less than the 50% reduction that was recommended in [Citation33]. For such veins, the ultrasound parameters should be refined. Our shrinkage simulations successfully predicted that the vein diameter reduction should be less than 45% for such large veins, our shrinkage model could thus be useful for numerical testing to develop a more efficient sonication strategy. For example, more than two sonications could be delivered to sonicate the entire vein circumference adequately.
Among all of the literature reporting vessel shrinkage in vivo following HIFU exposure, only one article has quantified the luminal constriction [Citation7]. Diameter reduction of 50% or less has been reported after HIFU exposure (1.49 MHz, 1 s exposure) of rabbit femoral veins (1.0–1.3 mm). Our results compare favorably to those in [Citation7]. Nevertheless, direct comparison is difficult due to the differences in the vessel diameters (sheep veins are about three times larger than rabbit femoral vessels) and ultrasound parameters. Mechanical effects were responsible for the luminal narrowing described in [Citation7], while we investigated the thermal effects of ultrasound waves. To date and to the best of our knowledge, there have been no other reports of noninvasive shrinkage associated with luminal constriction of medium-diameter vessels (>3 mm diameter) with the use of thermal HIFU.
In the published literature, data quantifying the vein shrinkage achieved immediately following in vivo endovenous thermal ablation (RFA or laser ablation) are scarce. Only Weiss et al. [Citation37] quantified the thermally induced shrinkage in acute after laser and RFA of sheep jugular veins. In their study, 26% and 77% shrinkage was achieved after completion of the laser and radiofrequency (RF) procedures, respectively. The investigators also evaluated the evolution of the amount of shrinkage over time. They reported 27% and 50% shrinkage 1 week after laser and RF treatment, respectively.
Irreversible occlusion following endovenous thermal ablation is thought to result from a process of shrinkage in which the vein lumens narrow incrementally until the vein evolves into a fibrotic cord [Citation35,Citation38,Citation39]. However, Weiss et al. [Citation37] observed wall relaxation over time after RF treatment.
Histological analysis needs to be performed to confirm the thermal denaturation and shrinkage of collagen fibers. Such analysis could not be conducted with the current protocol, but we intend to perform another set of thermal lesions in sheep veins in order to provide histological assessment.
In this study, the experimental data of the HIFU-induced vein wall shrinkage were used to validate a numerical model of the shrinkage induced by HIFU treatment. The treatment parameters of the in vivo experiments were simulated numerically, and the vein wall shrinkage was estimated for all of the pretreatment vein diameters treated experimentally: 2.3, 3.5, and 5.2 mm. The simulated and measured vein wall shrinkages agreed well for the smallest diameters, with 4% and 6% relative errors for the 2.3 and 3.5 mm cases, respectively. The simulations tended to overestimate the vein wall shrinkage slightly. A 35% mismatch between the simulation and experiment was observed for the 5.2 mm case. In this particular case, the discrepancy between the estimated and actual luminal constriction can be explained by the fact that the vein was treated with continuous blood flow inside, which was not considered in our numerical model.
This model has other limitations: for example, only collagen denaturation was considered to be responsible for the thermally induced shrinkage. However, other processes may also contribute, such as vasospasms and water losses occurring at ablative temperatures [Citation40,Citation41]. Moreover, this model also assumed isotropic tissue properties, although blood vessels are anisotropic, like many other soft tissues [Citation42]. The contraction could, therefore, depend on the vein orientation relative to the HIFU field, which was not evaluated in this study.
Last, although temperature dependence of ultrasound parameters and thermal properties has been demonstrated experimentally [Citation41,Citation43–54], constant acoustic parameters were used in the simulations as performed in previously published studies [Citation55–58].
The numerical model could be a useful tool for setting or adjusting HIFU exposure parameters in terms of the vein diameter to maximize vein wall heating, especially for veins in which the blood flow can be stopped.
Disclosure statement
Nesrine Barnat, Anthony Grisey, Bjoern Gerold, Sylvain Yon, and Jérémie Anquez are employees of Theraclion.
Additional information
Funding
References
- Braithwaite B, Hnatek L, Zierau U, et al. Radiofrequency-induced thermal therapy: results of a European multicentre study of resistive ablation of incompetent truncal varicose veins. Phlebology. 2013;28(1):38–46.
- Lohr J, Kulwicki A. Radiofrequency ablation: evolution of a treatment. Semin Vasc Surg. 2010;23(2):90–100.
- Quehe P, Alavi Z, Kurylo-Touz T, et al. Endovenous Celon radiofrequency-induced thermal therapy of great saphenous vein: a retrospective study with a 3-year follow-up. SAGE Open Med. 2018;6:2050312118794591–2050312118794598.
- Barnat N, Grisey A, Gerold B, et al. Efficacy and safety assessment of an ultrasound-based thermal treatment of varicose veins in a sheep model. Int J Hyperthermia. 2020;37(1):231–244.
- Gorisch W, Boergen K-P. Heat-induced contraction of blood vessels. Lasers Surg Med. 1982;2(1):1–13.
- Yang R, Griffith S, Rescorla F. Feasibility of using high intensity focused ultrasound for the treatment of unresectable retroperitoneal malignancies. J Ultrasound Med. 1992;19:306–308.
- Hynynen K, Chung AH, Colucci V, et al. Potential adverse effects of high-intensity focused ultrasound exposure on blood vessels in vivo. Ultrasound Med Biol. 1996;22(2):193–201.
- Hynynen K, Colucci V, Chung A, et al. Noninvasive arterial occlusion using MRI-guided focused ultrasound. Ultrasound Med Biol. 1996;22(8):1071–1077.
- Rivens IH, Rowland IJ, Denbow M, et al. Vascular occlusion using focused ultrasound surgery for use in fetal medicine. Eur J Ultrasound. 1999;9(1):89–97.
- Mahoney K. Focused ultrasound effects on blood vessels in vivo – limits for vascular intervention; 2000 IEEE Ultrasonics. p. 1405–1408.
- Ishikawa T, Okai T, Sasaki K, et al. Functional and histological changes in rat femoral arteries by HIFU exposure. Ultrasound Med Biol. 2003;29(10):1471–1477.
- Nizard J, Pessel M, De Keersmaecker B, et al. High-intensity focused ultrasound in the treatment of postpartum hemorrhage: an animal model. Ultrasound Obstet Gynecol. 2004;23(3):262–266.
- Pichardo S, Milleret R, Curiel L, et al. In vitro experimental study on the treatment of superficial venous insufficiency with high-intensity focused ultrasound. Ultrasound Med Biol. 2006;32(6):883–891.
- Petrusca L, Salomir R, Milleret R, et al. Experimental investigation of thermal effects in HIFU-based external valvuloplasty with a non-spherical transducer, using high-resolution MR thermometry. Phys Med Biol. 2009;54(17):5123–5138.
- Barnat N, Grisey A, Lecuelle B, et al. Noninvasive vascular occlusion with HIFU for venous insufficiency treatment: preclinical feasibility experience in rabbits. Phys Med Biol. 2019;64(2):12.
- Treeby BE, Cox BT. k-Wave: MATLAB toolbox for the simulation and reconstruction of photoacoustic wave fields. J Biomed Opt. 2010;15(2):021314.
- Treeby BE, Jaros J, Rendell AP, et al. Modeling nonlinear ultrasound propagation in heterogeneous media with power law absorption using a k-space pseudospectral method. J Acoust Soc Am. 2012;131(6):4324–4336.
- Cox BT, Kara S, Arridge SR, et al. k-space propagation models for acoustically heterogeneous media: application to biomedical photoacoustics. J Acoust Soc Am. 2007;121(6):3453–3464.
- Wang K, Teoh E, Jaros J, et al. Modelling nonlinear ultrasound propagation in absorbing media using the k-Wave toolbox: experimental validation. IEEE Int Ultrason Symp IUS, 2012. p. 523–526.
- Grisey A, Yon S, Letort V, et al. Simulation of high-intensity focused ultrasound lesions in presence of boiling. J Ther Ultrasound. 2016;4(1):1–14.
- Grisey A, Heidmann M, Letort V, et al. Influence of skin and subcutaneous tissue on *High-intensity focused ultrasound beam: experimental quantification and numerical modeling. Ultrasound Med Biol. 2016;42(10):2457–2465.
- Duck FA. Physical properties of tissues: a comprehensive reference book. London: Academic Press; 1990.
- Xu F, Lu TJ, Seffen KA, et al. Mathematical modeling of skin bioheat transfer. Appl Mech Rev. 2009;62(5):050801.
- Solovchuk MA, Thiriet M, Sheu TWH. Computational study of acoustic streaming and heating during acoustic hemostasis. Appl Therm Eng. 2017;124:1112–1122.
- Wang S, Frenkel V, Zderic V. Preliminary optimization of non-destructive high intensity focused ultrasound exposures for hyperthermia applications. Proceedings of the 31st Annual International Conference of the IEEE Engineering in Medicine and Biology Society, 2009. p. 3055–3059.
- Kim M, Kim J-Y, Noh S-C, et al. Thermal characteristics of non-biological vessel phantoms for treatment of varicose veins using high-intensity focused ultrasound. PLoS One. 2017;12(4):e0174922.
- Gianmarco P. Numerical methods for nonlinear wave propagation in ultrasound. Durham: Duke University; 2007.
- Duck FA. Acoustic properties of tissue at ultrasonic frequencies. In: Physical properties of tissues: a comprehensive reference book. London: Academic Press; 1990. p. 73–135.
- Travers JP, Brookes CE, Evans J, et al. Assessment of wall structure and composition of varicose veins with reference to collagen, elastin and smooth muscle content. Eur J Vasc Endovasc Surg. 1996;11(2):230–237.
- Agah R, Pearce JA, Welch AJ, et al. Rate process model for arterial tissue thermal damage: implications on vessel photocoagulation. Lasers Surg Med. 1994;15(2):176–184.
- Gérard PM. Euler’s formula and the naive formula. [Online]. Available from: http://www.numericana.com/answer/ellipse.htm#error.
- Barnat N, Grisey A, Gerold B, et al. Efficacy and safety assessment of ultrasound-based thermal treatment of varicose veins. Int J Hyperthermia. 2020;37(1):231–244.
- Proebstle TM. Endovenous laser (EVL) for saphenous vein ablation. In: The vein book. London: Academic Press; 2007. p. 267–273.
- Newman JE, Meecham L, Walker RJ, et al. Optimising treatment parameters for radiofrequency induced thermal therapy (RFiTT): a comparison of the manufacturer's treatment guidance with a locally developed treatment protocol. Eur J Vasc Endovasc Surg. 2014;47(6):664–669.
- Goldman M, Bergan J, Guex J-J. Intravascular approaches to the treatment of varicose veins: radiofrequency and lasers. In: Sclerotherapy: treatment of varicose and telangiectatic leg veins. 4th ed. New York: Elsevier; 2007. p. 301–314.
- Arnoczky SP, Aksan A. Thermal modification of connective tissues: basic science considerations and clinical implications. J Am Acad Orthop Surg. 2000;8(5):305–313.
- Weiss RA. Comparison of endovenous radiofrequency versus 810 nm diode laser occlusion of large veins in an animal model. Dermatol Surg. 2002;28(1):56–61.
- Vuylsteke M. Endovenous laser ablation. Ann Vasc Surg. 2012;26:424–433.
- Min RJ, Khilnani N, Zimmet SE. Endovenous laser treatment of saphenous vein reflux: long-term results. J Vasc Interv Radiol. 2003;14(8):991–996.
- Sebek J, Albin N, Bortel R, et al. Sensitivity of microwave ablation models to tissue biophysical properties: a first step toward probabilistic modeling and treatment planning. Med Phys. 2016;43(5):2649–2661.
- Lopresto V, Argentieri A, Pinto R, et al. Temperature dependence of thermal properties of ex vivo liver tissue up to ablative temperatures. Phys Med Biol. 2019;64(10):105016.
- Hoskins PR. Physical properties of tissues relevant to arterial ultrasound imaging and blood velocity measurement. Ultrasound Med Biol. 2007;33(10):1527–1539.
- Bamber C, Hill JC. Ultrasonic attenuation and propagation sped in mammalian tissues as a function of temperature. Ultrasound Med Biol. 1979;5(2):149–157.
- Choi MJ, Guntur SR, Lee JM, et al. Changes in ultrasonic properties of liver tissue in vitro during heating-cooling cycle concomitant with thermal coagulation . Ultrasound Med Biol. 2011;37(12):2000–2012.
- Ghoshal G, Luchies AC, Blue JP, et al. Temperature dependent ultrasonic characterization of biological media. J Acoust Soc Am. 2011;130(4):2203–2211.
- Jackson E, Coussios C, Cleveland R. Nonlinear acoustic properties of ex vivo bovine liver and the effects of temperature and denaturation. Phys Med Biol. 2014;59(12):3223–3238.
- Gammell PM, Le Croissette DH, Heyser RC. Temperature and frequency dependence of ultrasonic attenuation in selected tissues. Ultrasound Med Biol. 1979;5(3):269–277.
- Chato J. Measurement of thermal properties of biological materials. Heat Transfer Med Biol. 1985;1:167–192.
- Valvano JW, Cochran JR, Diller KR. Thermal conductivity and diffusivity of biomaterials measured with self-heated thermistors. Int J Thermophys. 1985;6(3):301–311.
- Valvano J, Chitsabesan B. Thermal conductivity and diffusivity of arterial wall and atherosclerotic plaque. Lasers Life Sci. 1987;1:219–229.
- Damianou CA, Sanghvi NT, Fry FJ, et al. Dependence of ultrasonic attenuation and absorption in dog soft tissues on temperature and thermal dose. J Acoust Soc Am. 1997;102(1):628–634.
- Gertner MR, Wilson BC, Sherar MD. Ultrasound properties of liver tissue during heating. Ultrasound Med Biol. 1997;23(9):1395–1403.
- Techavipoo U, Varghese T, Chen Q, et al. Temperature dependence of ultrasonic propagation speed and attenuation in excised canine liver tissue measured using transmitted and reflected pulses. J Acoust Soc Am. 2004;115(6):2859–2865.
- Zderic V, Keshavarzi A, Andrew MA, et al. Attenuation of porcine tissues in vivo after high-intensity ultrasound treatment. Ultrasound Med Biol. 2004;30(1):61–66.
- Meaney PM, Clarke RL, Ter Haar GR, et al. A 3-D finite-element model for computation of temperature profiles and regions of thermal damage during focused ultrasound surgery exposures. Ultrasound Med Biol. 1998;24(9):1489–1499.
- Pinton G, Aubry J-F, Fink M, et al. Effects of nonlinear ultrasound propagation on high intensity brain therapy. Med Phys. 2011;38(3):1207–1216.
- Ten Eikelder HMM, Bošnački D, Elevelt A, et al. Modelling the temperature evolution of bone under high intensity focused ultrasound. Phys Med Biol. 2016;61(4):1810–1828.
- Constans C, Mateo P, Tanter M, et al. Potential impact of thermal effects during ultrasonic neurostimulation: retrospective numerical estimation of temperature elevation in seven rodent setups. Phys Med Biol. 2018;63(2):025003–025012.
Appendix:
Algorithm for the implementation of the vein shrinkage
This appendix contains the algorithm used for the implementation of the vein shrinkage.
At time, let
be the set of voxels (
) of the vein wall and
be the set of voxels of the
th vein wall ring. Therefore, u
. Further, let
represent the updated temperature field computed based on
and the bioheat equation.
Based on the updated temperature field, the thermal damage within each voxel of the vein wall is updated and is denoted as . At this stage, the vein has not yet been shrunk and
and
are defined on the same vein geometry. The vein wall constriction in each voxel during the current time step can be computed as
In each cross-section planned:
For each vein wall ring, the weighted curvilinear abscissa is updated and is calculated as a spatial cumulative sum along the cross-section:
Based on the spatial mean of the contracted pixel length, the new vein circumference is computed as follows:
The new geometry of the vein wall
is then computed.
On the updated geometry, the weighted curvilinear abscissa is computed for each vein wall ring considering all voxels of unitary length.
Initial sample points
Initial sample (thermal damage) values
Query points
Initial sample points
Initial sample values
Query points